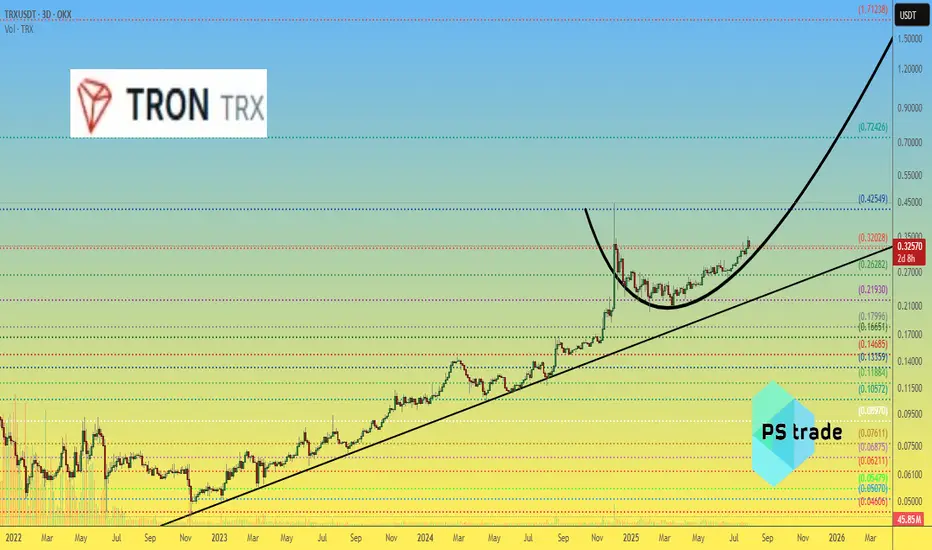
$TRX — "The Samurai Path" of Crypto? Long-term TRON outlook In a market where coins spike and crash from every tweet, CRYPTOCAP:TRX behaves like a stoic monk.
The price of OKX:TRXUSDT moves steadily, avoiding wild dumps and pumps — as if it exists in a parallel reality.
Now consider two events that would usually explode any altcoin’s chart — but not CRYPTOCAP:TRX :
📅 July 24 — Justin Sun’s TRON Inc gets listed on NASDAQ.
📅 July 28 — TRON Inc announces plans to raise $1B to buy back CRYPTOCAP:TRX and hold it on their balance sheet.
🔍 And yet… the chart remains calm. No hysteria. No euphoria.
Why?
Either CRYPTOCAP:TRX is so predictable that all news is already priced in —
or we simply don’t fully understand the inner mechanics of this ecosystem.
🧭 We call this "The Samurai Path":
Silent. Stable. Emotionless. But with serious long-term potential.
On the chart, we outlined how OKX:TRXUSDT has been moving — and what we expect next.
Because a market cap of $31B is already massive.
But $161B? That’s a statement...
📊 Can #TRON become the next “stable giant” of crypto — or will it surge when no one expects?
Tron
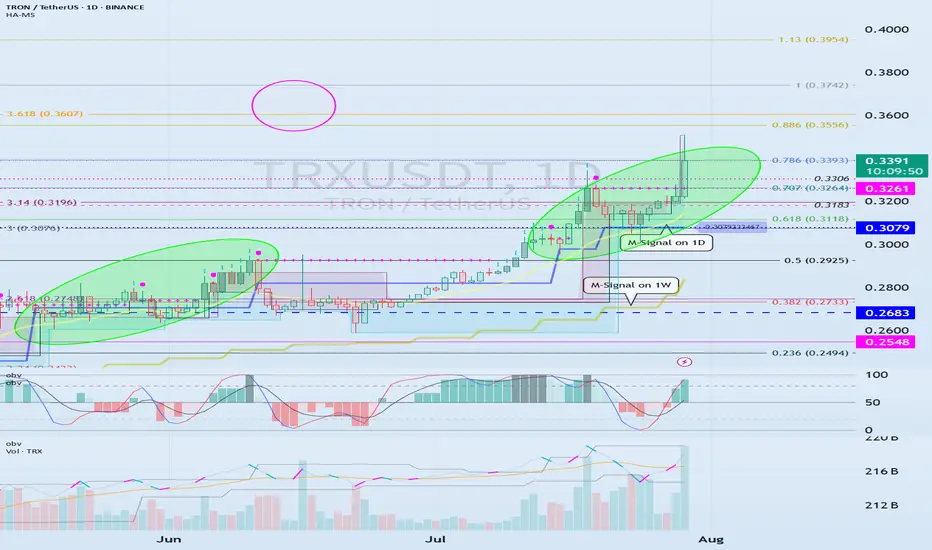
Check if the second step-up trend can be maintained
Hello, traders.
If you "Follow" us, you'll always get the latest information quickly.
Have a great day.
-------------------------------------
(TRXUSDT 1M Chart)
We need to see if the price can sustain itself by rising above the left Fibonacci level 3.618 (0.3607) and the right Fibonacci level 1 (0.3742).
When the next monthly candlestick is formed, we need to check the movements of the supporting indicators.
-
(1W Chart)
The DOM (60) indicator on the 1W chart is showing signs of forming a new trend.
Accordingly, we need to examine whether a rise above the left Fibonacci level of 3.618 (0.3607) will trigger a new wave.
The left Fibonacci level was created during the first rising wave.
Therefore, if the price rises above the left Fibonacci level of 3.618 (0.3607), a new wave is expected to form.
Since the HA-High indicator on the 1W chart is formed at 0.2683, if the price declines, support near 0.2683 will be crucial.
-
(1D chart)
If the price maintains above the 0.3079-0.3261 range, further upside is expected.
For the price to rise above the left Fibonacci ratio of 3.618 (0.3607) and the right Fibonacci ratio of 1 (0.3742), the OBV indicator of the Low Line ~ High Line channel must rise above the High Line and remain above it.
However, since the StochRSI indicator has entered an overbought zone, the upward movement may be limited.
Therefore, we need to consider how to reset the indicator.
-
The price is continuing a stepwise upward trend, rising above the HA-HIgh indicator.
It is currently in its second stepwise upward movement.
Therefore, the key is whether the price can sustain above the HA-High indicator.
Whether a third stepwise upward movement occurs will depend on whether the price can sustain itself around or above the 0.3079-0.3261 level.
-
Thank you for reading to the end.
I wish you successful trading.
--------------------------------------------------
- Here's an explanation of the big picture.
(3-year bull market, 1-year bear market pattern)
I'll explain more in detail when the bear market begins.
------------------------------------------------------
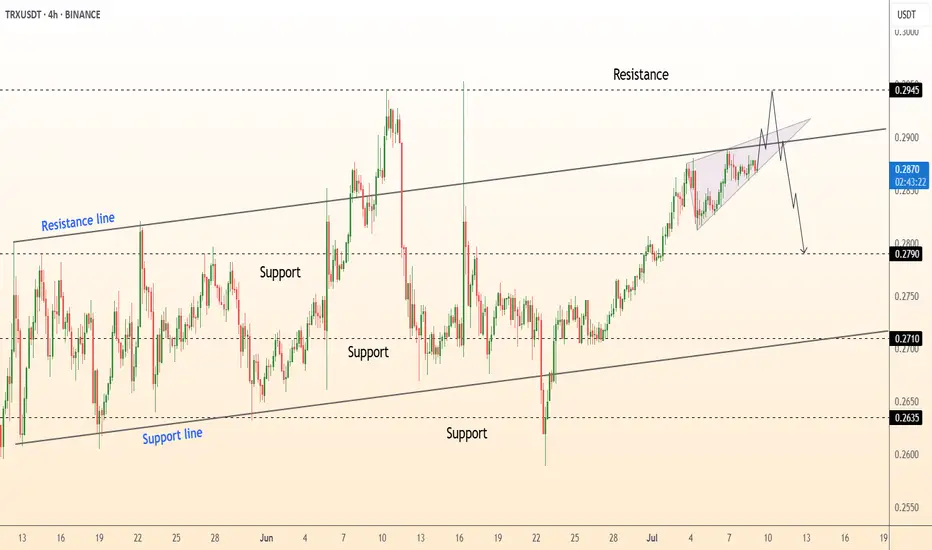
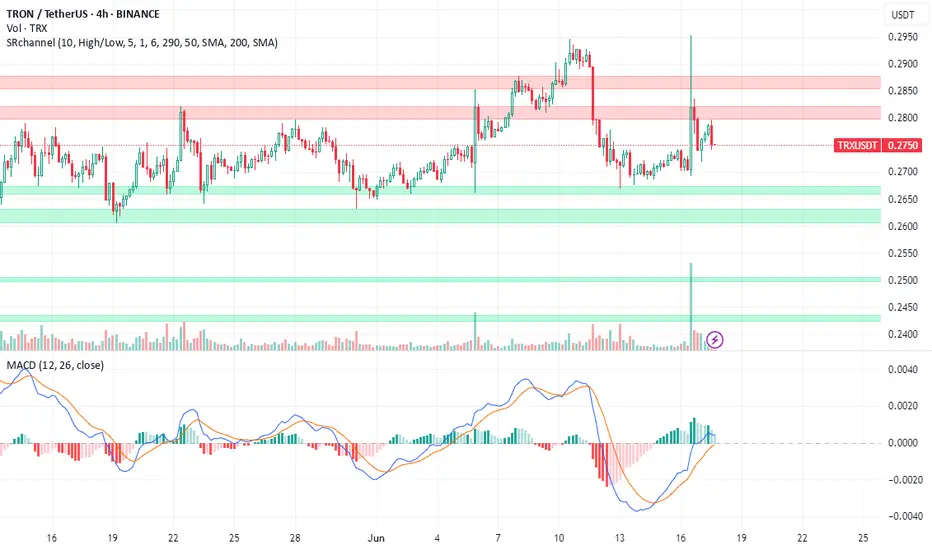
DeGRAM | TRXUSD reached the resistance line📊 Technical Analysis
● TRX is grinding the channel top (≈ 0.288-0.290) while printing a narrowing rising-wedge; momentum is fading as each thrust stalls just below the June trend-line.
● A decisive break beneath 0.285 would invalidate the wedge and hand control to sellers, opening 0.279 (mid-band) and the broader channel floor/April pivot at 0.271.
💡 Fundamental Analysis
● Glassnode notes TRON’s stable-coin inflow growth slowed to its weakest since March, hinting at waning on-chain demand, while renewed U.S. regulatory noise around offshore venues keeps speculative flows cautious.
✨ Summary
Sell 0.288-0.290; loss of 0.285 targets 0.279 → 0.271. Bear view void on an H4 close above 0.2945.
-------------------
Share your opinion in the comments and support the idea with a like. Thanks for your support!
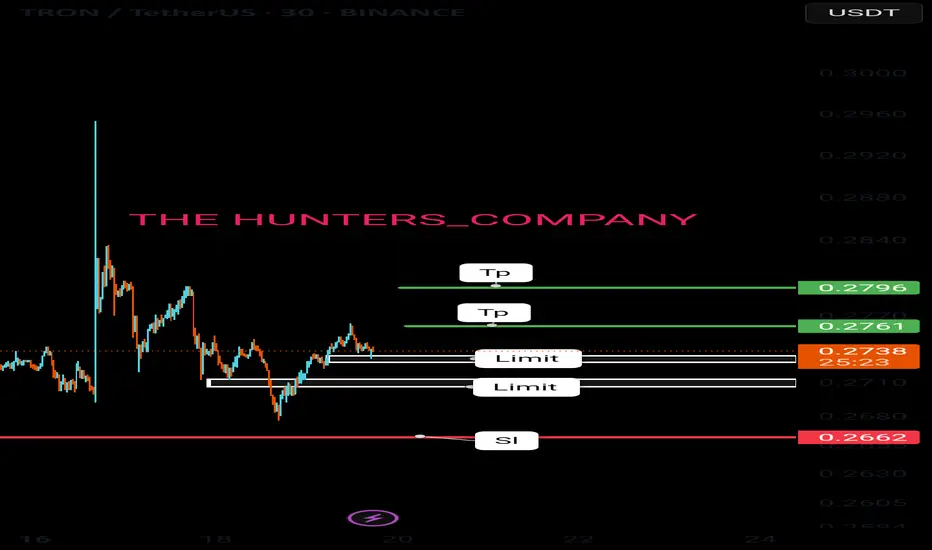
Free signals: today (TRX)hello friends✋️
Considering the drop we had, you can see that the price was well supported in the specified area and buyers came in. Now in the return of the price, we can buy step by step in the specified support areas and move with it until the specified goals, of course, with the management of shame and risk...
*Trade safely with us*
TA on Litecoin, Ripple, Dogecoin, Polkadot, TronQuick TA on Litecoin, Ripple, Dogecoin, Polkadot, Tron. What do you think?
CRYPTO:LTCUSD
CRYPTO:XRPUSD
CRYPTO:DOGEUSD
CRYPTO:DOTUSD CRYPTO:TRXUSD
Let us know what you think in the comments below.
Thank you.
77.3% of retail investor accounts lose money when trading CFDs with this provider. You should consider whether you understand how CFDs work and whether you can afford to take the high risk of losing your money. Past performance is not necessarily indicative of future results. The value of investments may fall as well as rise and the investor may not get back the amount initially invested. This content is not intended for nor applicable to residents of the UK. Cryptocurrency CFDs and spread bets are restricted in the UK for all retail clients.

Tron (TRX) Price Prediction: Nasdaq Deal Fuels Bullish ForecastThe $210 Million Nasdaq Rumor: Deconstructing the Hype for a Realistic Tron (TRX) Price Prediction
In the volatile theater of cryptocurrency, headlines can ignite market-moving frenzies, and few have been as potent as the recent whirlwind of news surrounding Tron (TRX). The prospect of a planned Nasdaq listing via a $210 million reverse merger, intertwined with the enigmatic presence of the Trump family, sent shockwaves through the community, promising a new era of mainstream legitimacy and sparking wildly bullish price predictions. However, as the dust settles, a clearer, more nuanced picture emerges—one that separates explosive rumors from the fundamental drivers that will truly dictate the future of Tron's price.
The core of the excitement stemmed from a strategic deal involving SRM Entertainment, a Nasdaq-listed company specializing in theme park merchandise. In a stunning pivot, SRM announced it would rebrand as Tron Inc., initiate a substantial TRX treasury funded by a $100 million private equity investment, and appoint Tron's founder, Justin Sun, as an adviser. This "reverse merger" was widely interpreted as a backdoor for the Tron blockchain to gain a coveted spot on a major U.S. stock exchange, a move that would grant it unprecedented access to traditional capital and validation. Adding a layer of political intrigue, the deal was facilitated by an investment bank where Eric Trump and Donald Trump Jr. serve on the advisory board.
This confluence of high finance, crypto ambition, and political association created a perfect storm for speculation. The stock price of SRM Entertainment skyrocketed over 500%, and the price of TRX saw a notable jump. However, the narrative quickly became more complex. Eric Trump clarified his position, denying any direct "public involvement" in the new company, despite expressing his admiration for Justin Sun and their established business connections.
While the deal with SRM Entertainment is very real, its direct implications for the TRX token are more complex than a simple "Nasdaq listing." The transaction is for the corporate entity, which will hold TRX in its treasury, not for the decentralized TRX asset itself to be traded on Nasdaq like a stock. This distinction is critical. The move provides Tron with a publicly-traded vehicle and significant capital, but the ultimate value of TRX still hinges on the utility and adoption of the Tron network itself. Therefore, a realistic price prediction must look beyond the initial hype and analyze the bedrock of Tron's fundamentals.
Deconstructing the Hype: The Nasdaq Deal and Trump Connection
The plan for SRM Entertainment, a Florida-based supplier of toys and souvenirs, to morph into Tron Inc. is a masterclass in financial engineering. Through a reverse merger, a private company (in spirit, Tron) can go public by merging with an existing publicly-traded company (SRM), bypassing the rigorous and lengthy process of a traditional Initial Public Offering (IPO).
The deal, valued at up to $210 million upon full exercise of warrants, involves SRM receiving a $100 million equity investment from a private investor to initiate a "TRX Treasury Strategy." This strategy mirrors the approach of companies like MicroStrategy with Bitcoin, where the public company's assets are heavily invested in a specific cryptocurrency, making its stock a proxy for that asset. With Justin Sun serving as an adviser, the new Tron Inc. plans to implement a TRX staking program and even a dividend policy for its shareholders, further intertwining its fate with the Tron ecosystem.
The involvement of the investment bank brokering the deal brought the Trump name into the headlines. Eric Trump and Donald Trump Jr.'s roles on the bank's advisory board led to speculation about their involvement in the new Tron Inc. However, Eric Trump later clarified his position, separating his personal and business relationships from a formal executive role in the public venture, though the connection undeniably added to the initial media frenzy.
Beyond the Rumors: Tron's True Fundamental Strengths
With the Nasdaq hype contextualized, the real question for investors is: what is the intrinsic value of the Tron network? The answer lies in its undeniable dominance in one of the most crucial sectors of the digital economy: stablecoins.
The Undisputed King of USDT
The Tron network has become the world's primary settlement layer for Tether (USDT), the largest stablecoin by market capitalization. The network hosts over $78 billion in USDT, a figure that has surpassed the amount on its main rival, Ethereum. This dominance is not accidental. Tron's architecture, which allows for high throughput and extremely low transaction fees, makes it the preferred network for USDT transfers, especially for retail users and in emerging markets.
During a single month in mid-2025, the Tron network processed over $694 billion in USDT transfers through nearly 90 million contract interactions. The vast majority of USDT holders on Tron are retail users with balances under $1,000, highlighting the network's deep penetration into everyday peer-to-peer and remittance use cases. This immense and consistent utility generates real, sustained demand for the network, forming the most solid pillar of its valuation.
A Growing DeFi and dApp Ecosystem
While stablecoins are its main draw, Tron's Decentralized Finance (DeFi) ecosystem is also substantial. The network holds a Total Value Locked (TVL) of over $8 billion, placing it among the top layer-1 blockchains. Platforms like the lending protocol JustLend and the decentralized exchange SunSwap are key contributors to this activity.
The network has processed over 10.5 billion transactions from more than 313 million user accounts, demonstrating a vibrant and active user base. Although a recent decline in TVL from its peak and slowing DEX volume has been observed, the sheer number of daily active users and transactions suggests a pivot towards non-DeFi dApps and peer-to-peer transfers, reinforcing its utility beyond pure financial speculation.
Tron (TRX) Price Prediction: Technical Analysis and Future Outlook
Given the strong fundamentals, particularly its role as the leading stablecoin platform, what can be expected from the TRX price?
Technical Indicators
As of mid-2025, TRX has shown resilience. Technical analysis reveals a generally neutral to bullish sentiment. The price has been consolidating in a horizontal channel, with key resistance and support levels being closely watched. Bullish signals, such as a "golden cross" and a bullish MACD crossover, suggest potential for upward momentum. A key indicator of its potential is its market-cap-to-TVL ratio, which, at 0.26, suggests the coin may be significantly undervalued compared to the value of the assets secured on its network.
Price Forecasts for 2025 and Beyond
Price forecasts for the end of 2025 vary but are generally optimistic, contingent on broader market conditions.
• Conservative Outlook: A conservative forecast places the potential price of TRX in a range between $0.18 and $0.35 for 2025. A move toward the upper end of this range would depend on a sustained crypto bull market and continued growth in Tron's user base.
• Bullish Scenario: An optimistic forecast suggests that if a full-blown "altseason" takes hold, TRX could surpass its previous highs and target levels between $0.45 and $0.70. Some long-term models even project a path toward $1.00 or higher by 2030, assuming Tron maintains its competitive edge and expands its use cases.
• Bearish Scenario: Risks remain. A regulatory crackdown on stablecoins, particularly Tether, could disproportionately impact Tron. Furthermore, a recent $2 billion drop in its DeFi TVL, despite user growth, suggests a potential weakness in its financial ecosystem that warrants monitoring. In a bearish turn, TRX could fall back to support levels around $0.21 or lower.
The "100x Gem" Fallacy
The headlines promoting Tron's Nasdaq deal were often accompanied by mentions of speculative new tokens like "BTC Bull Token," promising astronomical 100x returns. It is crucial for investors to recognize this as a common marketing tactic that leeches onto legitimate news to promote highly speculative and often worthless assets. The future success of Tron will not be found in chasing such gambles, but in the sustained growth of its core network. The real "alpha" is in understanding the fundamental utility that drives billions of dollars in transactions daily, not in lottery-ticket tokens.
Conclusion: A Bullish Continuation Built on Reality, Not Rumor
The story of Tron's Nasdaq listing is a potent reminder of the crypto market's susceptibility to hype. While the reverse merger with SRM Entertainment is a significant strategic maneuver that provides Justin Sun's ecosystem with a public-facing entity and a war chest, it is not the magic bullet that guarantees a higher TRX price.
The true bullish case for Tron is more mundane but far more powerful. It is the network's unparalleled dominance as the world's preferred highway for stablecoin transactions. This utility provides a constant, powerful demand for the network's resources. As long as Tron remains the fastest, cheapest, and most accessible platform for billions of dollars in daily USDT transfers, its intrinsic value will continue to grow.
The Nasdaq deal is a catalyst, but the engine is the ecosystem. Investors looking for a bullish continuation should focus on the steady hum of that engine—the growth in active wallets, transaction counts, and stablecoin volume—rather than the fleeting roar of market rumors. Based on these fundamentals, a steady, upward trajectory for TRX seems not only possible but probable, with the potential to retest and surpass previous highs as the digital asset market matures.
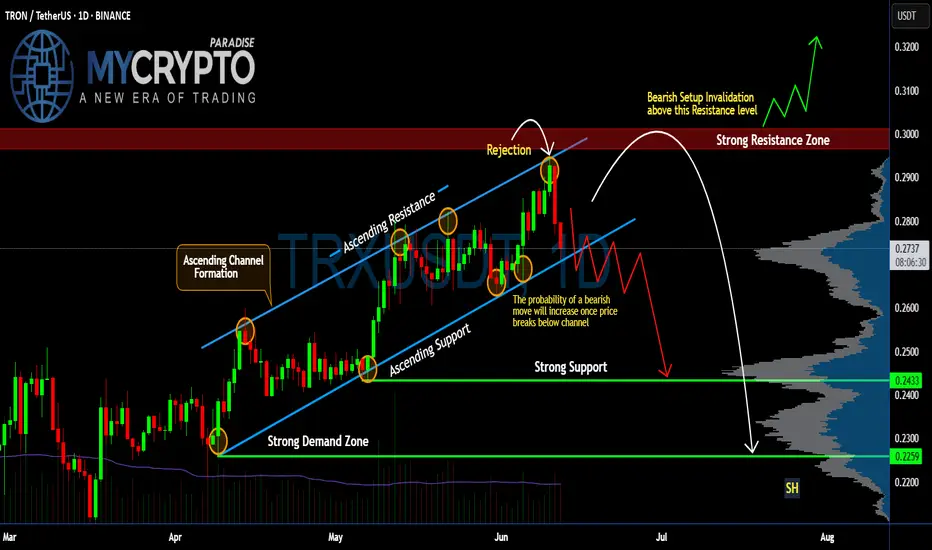
#TRX Ready for a Recovery or Another Fall Ahead? Key LevelsYello Paradisers! Are you watching the #Tron's recent moves in the market? Let's look at the latest setup of #TRXUSDT to see what could be the next move:
💎After forming a textbook Ascending Channel over the past few months, #TRX just got rejected hard from the upper boundary near the $0.29–$0.30 zone. That rejection didn’t just happen anywhere—it came right at the major resistance zone, which has acted as a key reversal point since early May. This kind of rejection, especially after multiple touchpoints, isn't just noise—it's a sign of momentum exhaustion at the top.
💎From an Elliott Wave perspective, it’s very likely that the first major impulse wave (Wave 1) has just been completed with this recent peak, and what comes next could be the start of Wave 2—a corrective phase that typically retraces deep and fast before the market resumes its larger trend. That means any weakness below the channel support could mark the beginning of a more prolonged decline, trapping breakout buyers and squeezing late longs out of their positions.
💎Price is now hovering dangerously close to the lower boundary of the channel, trading at $0.274 at the time of writing. This is where things start to get interesting. A decisive breakdown from this ascending support would not only confirm a bearish structural shift but would also trigger a cascade effect—invalidating the bullish channel and opening the door for a larger move to the downside.
💎If that breakdown plays out, the first meaningful support sits at the $0.2433 level. But that’s just the beginning. The next major demand lies down around $0.2259—a level loaded with historical volume and likely to attract strong buying interest. Until then, any small bounce is just noise in what could become a significant trend reversal.
Trade smart, Paradisers. This setup will reward only the disciplined.
MyCryptoParadise
iFeel the success🌴
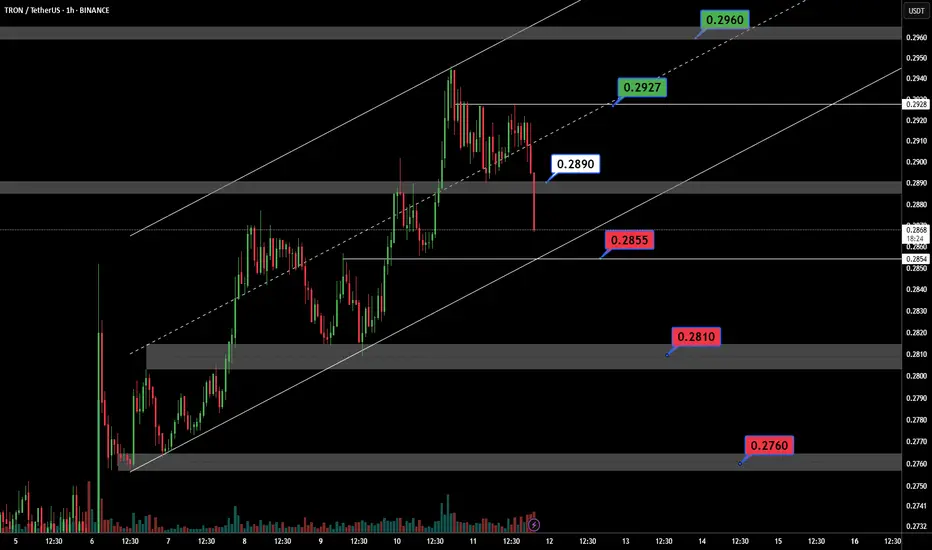
TRXUSDT In the 1-hour timeframe BINANCE:TRXUSDT , it shows an overall upward trend that has recently experienced a price drop near the 0.2855 level but remains within the main upward channel. If the price stays above 0.2890, there is a likelihood of the upward trend continuing toward 0.2960.
Key Support and Resistance Levels:
Support: 0.2760, 0.2810, 0.2855
Resistance: 0.2890, 0.2927, 0.2960
⚠️Contorl Risk management for trades.
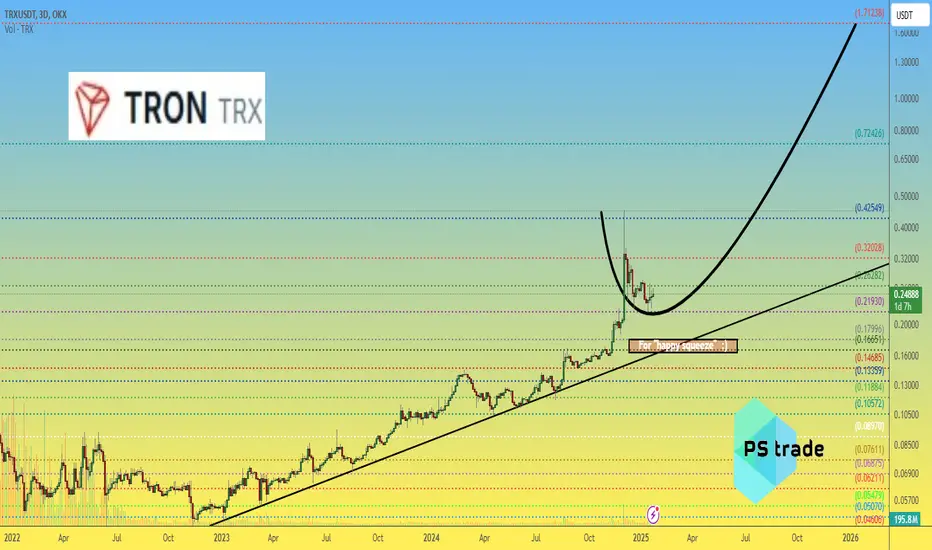
Public trade #15 - #TRX price analysis ( Tron )Earlier we wrote that if you want a stable crypto deposit growth, then invest in CRYPTOCAP:TRX
And although the fate of the project, roughly speaking, depends on one person, this person loves his creation!)
📊 Instead of a thousand words, just compare what happened to the alts in 2020 or 2022 and how stable the course and price vector of OKX:TRXUSDT was.
So, if you don't have #Tron in your investment portfolio yet, you should probably buy it at around $0.23. And buckets for “what if” in the range of $0.165-0.18
💰 Justin Sun - Just do it - #TRX to $1.7 !)
_____________________
Did you like our analysis? Leave a comment, like, and follow to get more
The key is whether it can find support near 0.2705 and rise
Hello, traders.
If you "Follow", you can always get new information quickly.
Have a nice day today.
-------------------------------------
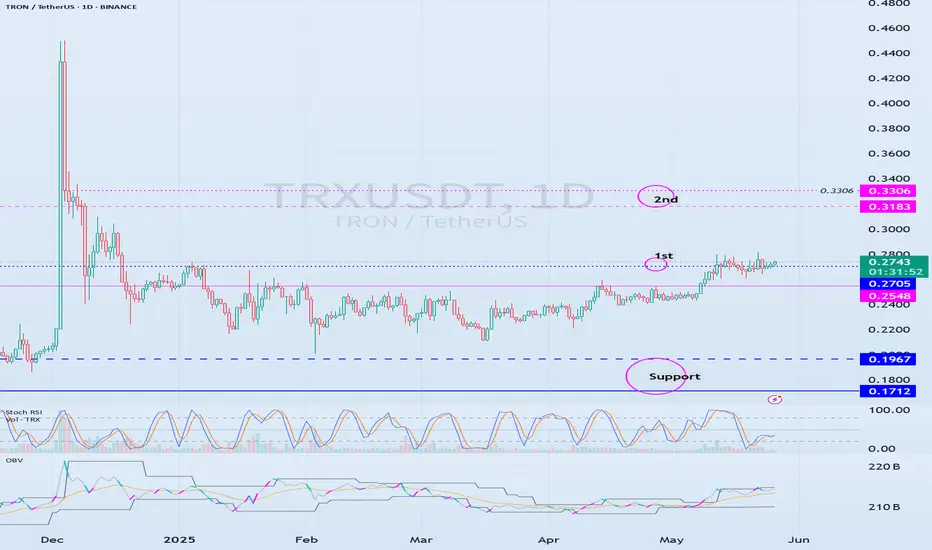
(TRXUSDT 1D chart)
The key is whether it can find support near 0.2705 and rise to 0.3183
If it goes down, the support range is expected to be around 0.1712-1967.
If it shows a downtrend, if the HA-Low indicator is generated, you can create a trading strategy depending on whether there is support around that area.
-
(30m chart)
Since the M-Signal indicator on the 1D chart is rising, if it goes down, it is expected that support around 0.2705 will be important.
If it is supported around 0.2734,
1st: 0.2772
2nd: 0.2811
You should respond depending on whether there is support around the 1st and 2nd areas above.
-
Thank you for reading to the end.
I hope you have a successful trade.
--------------------------------------------------
- This is an explanation of the big picture.
(3-year bull market, 1-year bear market pattern)
I will explain more details when the bear market starts.
------------------------------------------------------
TRON TRON (TRX) is a decentralized blockchain platform designed for smart contracts, decentralized applications (DApps), and digital content sharing. It aims to create a fast, scalable, and low-cost ecosystem for users and developers.
Key Features of TRON:
- High Transaction Speed: TRON can process up to 2,000 transactions per second, making it much faster than Bitcoin and Ethereum.
- Low Fees: Transactions on TRON are almost free, making it ideal for payments and transfers.
- Smart Contracts & DApps: Developers can build decentralized applications using TRON’s TRC-20 and TRC-10 token standards.
- TRC-20 USDT: TRON hosts a large portion of Tether (USDT) transactions, offering fast and cheap stablecoin transfers.
- Decentralized Finance (DeFi): TRON supports various DeFi projects, including JustLend DAO and SunSwap.
TRON was founded by Justin Sun in 2017 and has grown into one of the largest blockchain ecosystems

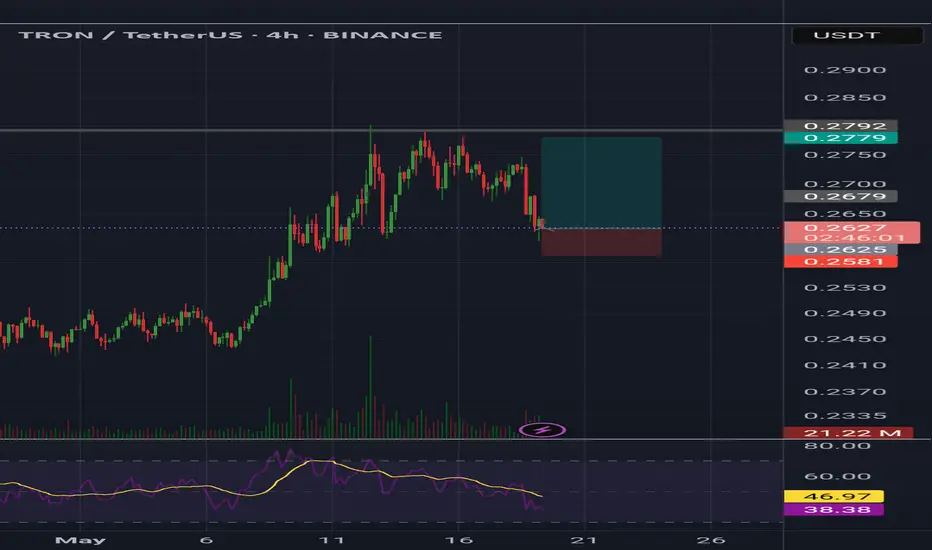
The Hidden TRX Buying Pressure Most Traders Are MissingI didn't draw the blue box below now, it's from my previous analysis,
I told you to wait and those who waited should be pretty happy right now TRX is still generally bullish and this is our current blue box and our assessment is as follows:
Contrary to the general market sentiment you might be seeing, my analysis of TRX is leaning positive.
What's caught my eye is the clear presence of buyers stepping in. This isn't just a fleeting moment of interest; the strength I'm observing suggests these buyers have the conviction and capital to genuinely drive the price upwards.
As always, I'm not just making a blind call. I'm seeing this strength reflected in the volume footprint, indicating genuine accumulation. The CDV (Cumulative Delta Volume) is also showing a positive divergence, supporting the idea of increasing buying pressure.
Now, while the overall market might be showing different signals, the concentrated buying activity in TRX is compelling. I'll be watching for low timeframe (LTF) confirmations of this strength continuing. If we see sustained buying volume and positive price action on the lower timeframes, this bullish outlook will be further validated.
It's important to remember that I focus on coins showing sudden and significant increases in volume, and TRX is currently exhibiting this. This concentrated interest from buyers suggests a potential for significant price movement, regardless of broader market headwinds.
Keep TRX on your radar. Sometimes, the real opportunities lie where the focused strength of buyers can overcome general market noise. You know I only bring you what I see as high-potential setups. Let's see if TRX can prove the broader market wrong.
📌I keep my charts clean and simple because I believe clarity leads to better decisions.
📌My approach is built on years of experience and a solid track record. I don’t claim to know it all but I’m confident in my ability to spot high-probability setups.
📌If you would like to learn how to use the heatmap, cumulative volume delta and volume footprint techniques that I use below to determine very accurate demand regions, you can send me a private message. I help anyone who wants it completely free of charge.
🔑I have a long list of my proven technique below:
🎯 ZENUSDT.P: Patience & Profitability | %230 Reaction from the Sniper Entry
🐶 DOGEUSDT.P: Next Move
🎨 RENDERUSDT.P: Opportunity of the Month
💎 ETHUSDT.P: Where to Retrace
🟢 BNBUSDT.P: Potential Surge
📊 BTC Dominance: Reaction Zone
🌊 WAVESUSDT.P: Demand Zone Potential
🟣 UNIUSDT.P: Long-Term Trade
🔵 XRPUSDT.P: Entry Zones
🔗 LINKUSDT.P: Follow The River
📈 BTCUSDT.P: Two Key Demand Zones
🟩 POLUSDT: Bullish Momentum
🌟 PENDLEUSDT.P: Where Opportunity Meets Precision
🔥 BTCUSDT.P: Liquidation of Highly Leveraged Longs
🌊 SOLUSDT.P: SOL's Dip - Your Opportunity
🐸 1000PEPEUSDT.P: Prime Bounce Zone Unlocked
🚀 ETHUSDT.P: Set to Explode - Don't Miss This Game Changer
🤖 IQUSDT: Smart Plan
⚡️ PONDUSDT: A Trade Not Taken Is Better Than a Losing One
💼 STMXUSDT: 2 Buying Areas
🐢 TURBOUSDT: Buy Zones and Buyer Presence
🌍 ICPUSDT.P: Massive Upside Potential | Check the Trade Update For Seeing Results
🟠 IDEXUSDT: Spot Buy Area | %26 Profit if You Trade with MSB
📌 USUALUSDT: Buyers Are Active + %70 Profit in Total
🌟 FORTHUSDT: Sniper Entry +%26 Reaction
🐳 QKCUSDT: Sniper Entry +%57 Reaction
📊 BTC.D: Retest of Key Area Highly Likely
📊 XNOUSDT %80 Reaction with a Simple Blue Box!
📊 BELUSDT Amazing %120 Reaction!
📊 Simple Red Box, Extraordinary Results
📊 TIAUSDT | Still No Buyers—Maintaining a Bearish Outlook
📊 OGNUSDT | One of Today’s Highest Volume Gainers – +32.44%
I stopped adding to the list because it's kinda tiring to add 5-10 charts in every move but you can check my profile and see that it goes on..

TRX/USDT Trade Setup & Why This Fibonacci Level Matters🚨 TRX/USDT Trade Breakdown 🔍💹
Taking a close look at TRX/USDT (Tron) — the chart is showing a strong, sustained bullish trend on the 4H timeframe 📈🔥.
At the moment, I’m waiting for a pullback into equilibrium ⚖️. If we apply a Fibonacci retracement from the current swing low to the recent high, the 50% level stands out as a key area of interest for a potential entry 🎯.
🧠 This zone offers a high-probability area to look for trend continuation, provided price respects it and holds structure. My Fibonacci tool also outlines projected targets, and I walk you through everything in the video 📽️🗺️.
📌 This is NOT financial advice — just my personal analysis and approach. Always do your own research and manage your risk accordingly. ⚠️
👇 Let me know your thoughts in the comments and don’t forget to like & subscribe for more setups!
TRX/USDT Trade Setup & Why This Fibonacci Level Matters

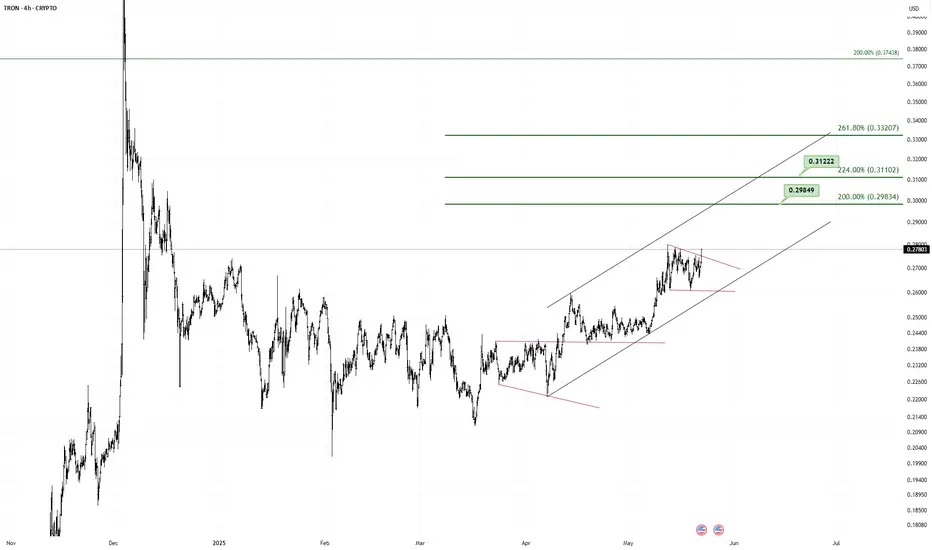
TRX/USDT Breakout Setup – Eyes on 0.298–0.332 Fibonacci TargetsTRON (TRX) is showing a bullish continuation structure within an ascending channel, following a breakout from a falling wedge pattern.
Currently, the price is consolidating inside a small bullish pennant, indicating a potential breakout to the upside. If this breakout materializes, it could trigger a rally toward the Fibonacci extension levels.
📌 Key Targets:
0.29849 (200% Extension)
0.31102 – 0.31222 (224% Cluster)
0.33207 (261.8% Extension)
📈 Technical Confluences:
Price is trending steadily within an ascending channel
Previous breakout from a falling wedge pattern confirms bullish sentiment
Higher lows structure remains intact
The pennant pattern typically resolves in the direction of the prevailing trend
📉 Invalidation Level:
A breakdown below the lower trendline and 0.258 support would invalidate the bullish scenario.
This chart setup offers a favorable risk/reward opportunity if the breakout is confirmed with strong volume.
TronTrx usdt Daily analysis
Time frame hourly
Short time Target 0.278 $
Risk rewards ratio >3.5 👈👌
This short time analysis is in the big Daily analysis that you can see in my forecasts before
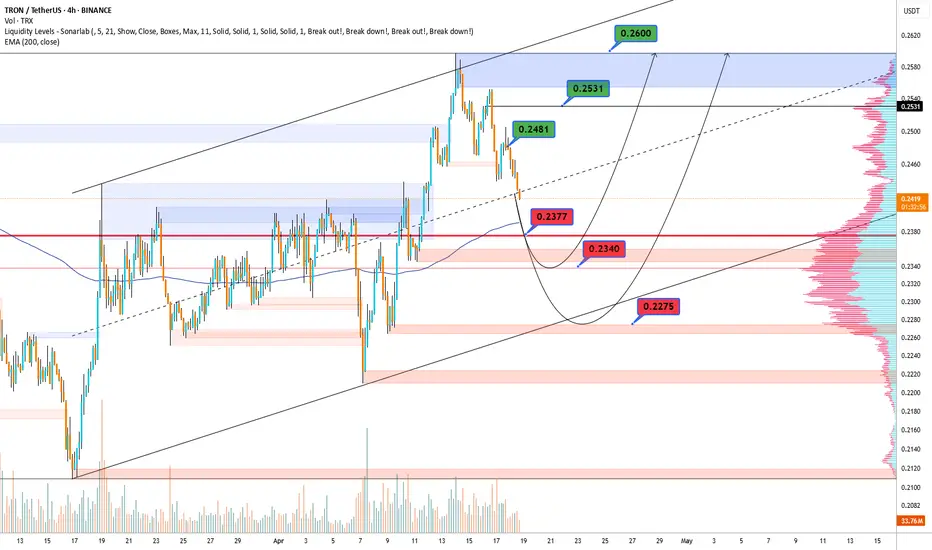
TRXUSDTTRX Price Analysis – Key Levels to Watch
🔍 Current Price Action:
TRX is currently trading within a tight range, with key resistance at 0.2431 and support at 0.2275. The recent close near 0.2418 indicates a strong battle near the upper resistance zone. A confirmed breakout above 0.2431 could pave the way for bullish continuation. However, failure to break through may trigger a pullback toward 0.2340 or even retest the 0.2275 support level.
📉 Trend Outlook & Next Moves:
A breakout above resistance may drive TRX toward higher price targets with strong bullish momentum.
Conversely, a breakdown below support could indicate a deeper correction ahead.
👉 Keep an eye on price reactions at these critical levels for confirmation of the next trend direction.
TRON Accumulation Phase Signals Potential for Explosive Growth TRON Accumulation Phase Signals Potential for Explosive Growth as On-Chain Metrics Point to Network Consolidation
The cryptocurrency market, a realm of perpetual motion and often bewildering volatility, occasionally presents moments of deceptive calm. These periods, far from indicating stagnation, can be the breeding grounds for significant future price movements. For TRON (TRX), a prominent blockchain platform known for its high throughput and focus on decentralizing the web, recent on-chain data and market behavior are increasingly pointing towards such a phase: a sustained period of accumulation, potentially heralding a major price surge as the network undergoes a subtle yet profound consolidation.
While the broader market narrative often chases fleeting trends and explosive, short-lived pumps, savvy investors understand the importance of identifying quieter, underlying currents. The concept of an accumulation phase, where smart money and long-term believers strategically build their positions, is a cornerstone of market cycle analysis. For TRON, the convergence of specific on-chain indicators – from whale activity and exchange flows to transaction patterns and staking metrics – suggests that such a phase is not just underway but is maturing, laying a robust foundation for a potential upward revaluation. This isn't about fleeting hype; it's about observing the methodical groundwork being laid for what could be a significant and sustained rally.
Understanding TRON: A Brief Overview of the Ecosystem
Before delving into the intricacies of its current market phase, it's essential to grasp what TRON represents. Launched by Justin Sun, TRON aims to build a decentralized internet. Its blockchain supports smart contracts, various kinds of blockchain systems, and decentralized applications (dApps). With its Delegated Proof-of-Stake (DPoS) consensus mechanism, TRON boasts high transaction speeds (TPS) and low transaction fees, positioning itself as a strong contender in the competitive Layer 1 landscape, particularly for applications requiring scalability, such as decentralized finance (DeFi), non-fungible tokens (NFTs), and GameFi.
The TRON network has cultivated a substantial ecosystem over the years. It hosts a significant volume of stablecoin transactions, particularly USDT, making it a key infrastructure layer for value transfer. Its TRC-20 token standard is widely adopted, and the platform has seen notable activity in dApp development and user engagement. This underlying utility and established presence are crucial, as accumulation phases are often rooted in a fundamental belief in the long-term viability and growth potential of an asset, rather than mere speculative fervor.
The Anatomy of an Accumulation Phase: Setting the Stage for a Breakout
An accumulation phase in financial markets is a period characterized by relatively flat or gradually inclining price action following a significant downtrend or a prolonged consolidation after an uptrend. During this time, informed investors, often referred to as "smart money" – which can include institutional players, large individual holders (whales), and project insiders – begin to quietly buy up the asset. Their strategy is to acquire substantial positions without causing a sharp price spike that would alert the broader market and increase their average entry cost.
Key characteristics of an accumulation phase include:
1. Reduced Volatility: Price swings tend to become less erratic as selling pressure from weaker hands subsides and buying pressure from accumulators absorbs supply.
2. Volume Signatures: While overall volume might appear subdued compared to peak bull market frenzy, there can be spikes in volume on minor price dips (as accumulators buy the lows) or during periods of sideways movement, indicating consistent buying.
3. Price Floor Formation: The price often establishes a strong support level, repeatedly bouncing off it as buyers step in to defend it.
4. Sentiment Shift: Public sentiment may range from bearish or indifferent (a hangover from a previous decline) to cautiously optimistic among those recognizing the underlying value. The rampant euphoria of a bull run is typically absent.
5. Duration: Accumulation phases can last for weeks, months, or even years, depending on the asset and the market cycle. The longer and more robust the accumulation, often the more powerful the subsequent markup phase.
For TRON, the suggestion of an accumulation phase implies that these sophisticated market participants perceive TRX as undervalued at its current levels and anticipate future catalysts or a broader market shift that will drive its price significantly higher.
Decoding TRON's On-Chain Signals: A Network Consolidating for Growth
On-chain data provides a transparent window into the activity occurring directly on a blockchain, offering insights that traditional technical analysis alone cannot capture. For TRON, several on-chain trends are converging to paint a picture of network consolidation and strategic accumulation.
• Whale Watching: The Giants Amass Their Holdings
One of the most telling signs of accumulation is the behavior of large wallet holders, or "whales." An increase in the number of addresses holding substantial amounts of TRX, or an increase in the balances of existing whale addresses, often indicates that those with significant capital are building positions. This can be observed by tracking the distribution of TRX tokens across different wallet tiers. If smaller retail wallets are shedding tokens (perhaps due to impatience or fear) while larger wallets are consistently adding to their stacks, it’s a classic sign of accumulation. These large players often have access to more in-depth research or a longer-term investment horizon, and their actions can be a leading indicator of future price strength. The quiet, steady absorption of TRX by these entities reduces the freely floating supply, making the asset more sensitive to future demand shocks.
• Exchange Dynamics: A Flight to Self-Custody
The flow of tokens to and from cryptocurrency exchanges is another critical on-chain metric. During accumulation phases, it's common to see a net outflow of the asset from exchanges to private wallets. This suggests that investors are acquiring tokens with the intention of holding them for the medium to long term (HODLing), rather than actively trading them. When tokens move off exchanges, it reduces the immediately available supply for sale, creating a supply squeeze that can exacerbate upward price movements when demand picks up. Conversely, large inflows to exchanges often signal intent to sell. If TRON is experiencing sustained periods where outflows significantly outweigh inflows, it strongly supports the accumulation thesis. This movement to self-custody also indicates a growing conviction among holders in the security and long-term prospects of their TRX investment.
• Staking and Supply Squeeze: Locking Up TRX
TRON's DPoS consensus mechanism involves staking, where TRX holders can lock up their tokens to participate in network governance and earn rewards. An increase in the amount of TRX being staked is a bullish indicator for several reasons. Firstly, it signals user confidence and engagement with the network. Secondly, and more directly relevant to price, staking removes tokens from the circulating supply. The more TRX that is staked, the less is available for trading on the open market. This reduction in liquid supply, similar to exchange outflows, can significantly amplify the impact of new buying pressure. If on-chain data shows a steady rise in the percentage of total TRX supply being staked, it contributes directly to the consolidation of supply and the potential for a more volatile upward move when demand surges.
• Transaction Patterns: Quality Over Quantity?
While high transaction volume can sometimes indicate strong network activity, during an accumulation phase, the nature of transactions can be more revealing than the sheer number. For instance, an increase in the average transaction size, even if the total number of transactions is stable or slightly decreasing, might suggest larger players are moving significant amounts of TRX, possibly consolidating them into fewer wallets or moving them to staking contracts. A decrease in "noise" transactions (very small, frequent transfers often associated with retail speculation or bot activity) coupled with an increase in larger, more deliberate transfers can be a sign of network maturation and consolidation by more substantial entities.
• Active Addresses and Network Growth:
While a surge in new active addresses is typically bullish, during a deep accumulation phase, the growth rate of new addresses might temporarily slow down as the market sheds speculative retail participants. However, the activity of existing addresses, particularly those identified as long-term holders or accumulators, becomes more critical. If these cohorts show increased activity in terms of receiving tokens or interacting with staking and DeFi protocols within the TRON ecosystem, it signals underlying strength and commitment, even if the headline number of daily new users isn't explosive. The consolidation here refers to a strengthening of the core user and holder base.
• Development Activity and Ecosystem Health:
Beyond direct token movements, the underlying health and development activity of the TRON ecosystem play a crucial role in attracting long-term accumulators. Consistent updates to the TRON protocol, new partnerships, growth in its DeFi sector (e.g., JustLend, JustStables), expansion of its NFT marketplaces, and successful GameFi projects all contribute to the fundamental value proposition. On-chain data can sometimes reflect this through increased smart contract interactions or growth in Total Value Locked (TVL) within TRON's DeFi applications. Investors accumulating during this phase are often betting on this continued ecosystem growth translating into increased demand for TRX.
The Mechanics of a Price Surge Post-Accumulation: Coiling the Spring
Once an accumulation phase is sufficiently mature, the stage is set for a potential "markup" phase, where prices can rise significantly. This happens because the prolonged period of buying by strong hands has effectively absorbed most of the available sell-side liquidity. The "weak hands" – impatient or fearful sellers – have been flushed out.
With a reduced floating supply, even a moderate increase in demand can have an outsized impact on the price. This demand can come from several sources:
1. Breakout Traders: Technical traders who identify the end of the accumulation range and the beginning of an uptrend often jump in, adding to buying pressure.
2. Retail FOMO (Fear Of Missing Out): As the price starts to move decisively upwards and breaks key resistance levels, it attracts attention from the broader retail market, leading to a fresh wave of buying.
3. Positive News Catalysts: Fundamental developments, such as major partnership announcements, technological breakthroughs, or favorable regulatory news, can act as triggers, igniting the demand that the accumulated supply cannot easily meet.
The price action during a markup phase is often characterized by a series of upward impulses, followed by brief consolidations or pullbacks, before the next leg higher. The strength and duration of this surge are often proportional to the length and thoroughness of the preceding accumulation. A well-established accumulation base acts like a coiled spring, storing potential energy that is released during the markup.
Catalysts Beyond Consolidation: What Could Ignite TRON's Rally?
While the on-chain evidence of accumulation and network consolidation provides a strong foundation, several external and ecosystem-specific catalysts could ignite the anticipated price surge for TRON:
1. Broader Crypto Market Bull Run: TRON, like most altcoins, is significantly influenced by the overall sentiment and price action of Bitcoin and the wider cryptocurrency market. A sustained bull market led by Bitcoin would likely lift all boats, providing a favorable tailwind for TRX to realize the potential built up during its accumulation.
2. Major Ecosystem Developments: Significant advancements within the TRON ecosystem could be powerful catalysts. This could include the launch of a highly anticipated dApp, a major upgrade to the TRON protocol enhancing its scalability or functionality (like advancements in its Layer 2 solutions or cross-chain capabilities), or a surge in adoption of its existing DeFi or NFT platforms.
3. Strategic Partnerships and Integrations: New, high-profile partnerships with established companies or integrations with other popular blockchain networks or traditional finance (TradFi) players could significantly boost TRON's credibility and utility, attracting new users and investors.
4. Increased Stablecoin Dominance: TRON is already a major player in stablecoin transactions. Further growth in this area, particularly if it captures more market share or integrates new, popular stablecoins, would solidify its role as a key financial infrastructure and drive demand for TRX for transaction fees and network participation.
5. Regulatory Clarity: Positive regulatory developments in key jurisdictions that provide greater clarity and legitimacy for cryptocurrencies, including TRON, could unlock institutional investment and broader retail adoption.
6. Justin Sun's Influence: While sometimes controversial, Justin Sun remains a highly influential figure in the crypto space. Strategic announcements or initiatives led by him can often generate significant market interest and speculative buying for TRON.
7. Narrative Shifts: The crypto market is often driven by narratives. If a narrative around high-throughput, low-cost Layer 1s for dApps and stablecoin transfers regains prominence, TRON is well-positioned to benefit.
Navigating the Waters: Considerations and Potential Headwinds
While the signs of accumulation and potential for a price surge are compelling, it's crucial to approach the market with a balanced perspective and acknowledge potential risks:
1. Duration of Accumulation: Accumulation phases can be protracted. There's no guarantee of an immediate breakout, and patience is often required.
2. False Breakouts ("Springs" or "Shakeouts"): Markets can experience false breakouts below the accumulation range to shake out remaining weak hands before the true markup begins. Similarly, initial moves upward can sometimes fail and fall back into the range.
3. Market Manipulation: While on-chain data offers transparency, sophisticated actors can still attempt to manipulate sentiment or price in the short term.
4. Overall Market Conditions: A severe downturn in the broader cryptocurrency market or global macroeconomic headwinds could delay or dampen any potential TRON-specific rally, regardless of its strong accumulation pattern.
5. Competition: The Layer 1 blockchain space is fiercely competitive. TRON faces ongoing competition from numerous other platforms, and its ability to maintain and grow its market share is critical.
6. Regulatory Risks: The regulatory landscape for cryptocurrencies remains uncertain in many parts of the world. Adverse regulatory actions could negatively impact TRON and the broader market.
Conclusion: Is TRON Coiling for a Major Move?
The confluence of on-chain indicators – from the subtle yet persistent buying by large holders and the movement of TRX off exchanges to the increasing amount of staked tokens and the underlying consolidation of network activity – paints a compelling picture. TRON appears to be in a classic accumulation phase, a period where the groundwork is meticulously laid for future growth. This isn't the frenetic energy of a market peak, but rather the quiet confidence of informed capital positioning itself for what it anticipates will be a significant upward revaluation.
The network consolidation suggests a strengthening of TRON's core, a pruning of speculative froth, and a concentration of its native token, TRX, into the hands of those with a longer-term conviction. While no outcome in the cryptocurrency market is guaranteed, and risks always persist, the current on-chain trends for TRON are undeniably bullish from a structural perspective.
If this accumulation phase completes successfully and is met with favorable market conditions or specific catalysts within the TRON ecosystem, the subsequent price surge could be substantial. The "coiled spring" analogy is apt; the longer and deeper the compression during accumulation, the more explosive the release can be. For investors and market observers closely watching TRON, the current period of apparent quietude might very well be the deceptive calm before a significant storm of buying pressure and a powerful move upwards, reaffirming the age-old market wisdom that fortunes are often built not in the frenzy of the bull run, but in the patient, strategic accumulation that precedes it. The signs suggest TRON's engines are being primed; the question is not if, but when, they will fully ignite.

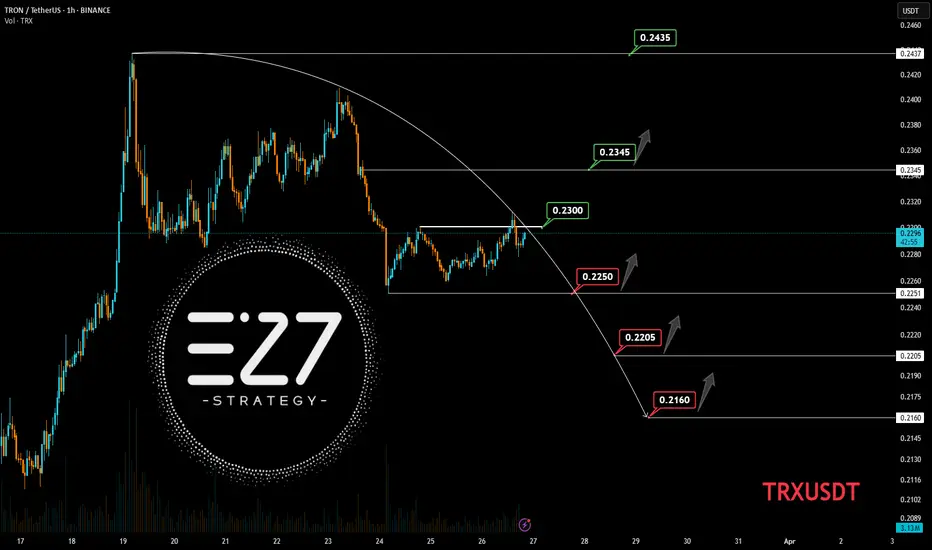
TRXUSDT TRXUSDT Price Action Analysis (1H Timeframe)
🔹 Overall Trend: After a strong rally, the price is in a correction phase, currently trading at 0.2291. The key resistance at 0.2300 must be broken for a bullish continuation.
🔹 Bullish Scenario:
A breakout above 0.2300 with confirmation could push the price towards 0.2345 and 0.2435.
If this happens, the bearish structure will be invalidated, increasing bullish momentum.
🔹 Bearish Scenario:
Failure to break 0.2300 may lead to a pullback towards 0.2250 and 0.2205.
Losing 0.2205 could open the way for a deeper drop to 0.2160, a critical support zone.
🎯 Conclusion: Watch key levels closely; a confirmed breakout above 0.2300 signals a buy opportunity, while losing 0.2250 strengthens the bearish outlook.
Liquidity Grab Ahead? Why TRX (Tron) May Retrace Soon TRX (Tron) is currently trading near a significant resistance zone, aligning with the upper boundary of a descending channel on the 4-hour timeframe 📉. This area is likely to hold liquidity in the form of buy stops resting above the previous range highs. Given the broader downtrend and the strong resistance overhead, the price may retrace as it taps into this liquidity pool.
This setup presents a compelling short opportunity, with the expectation that TRX will reject this level and move lower, targeting support zones below. Traders should remain cautious and monitor price action closely for confirmation before entering a position ⚠️.
Disclaimer: This analysis is for informational purposes only and does not constitute financial advice. Cryptocurrency trading involves significant risk, and you should consult with a financial advisor before making any investment decisions. Always trade responsibly! 🚨

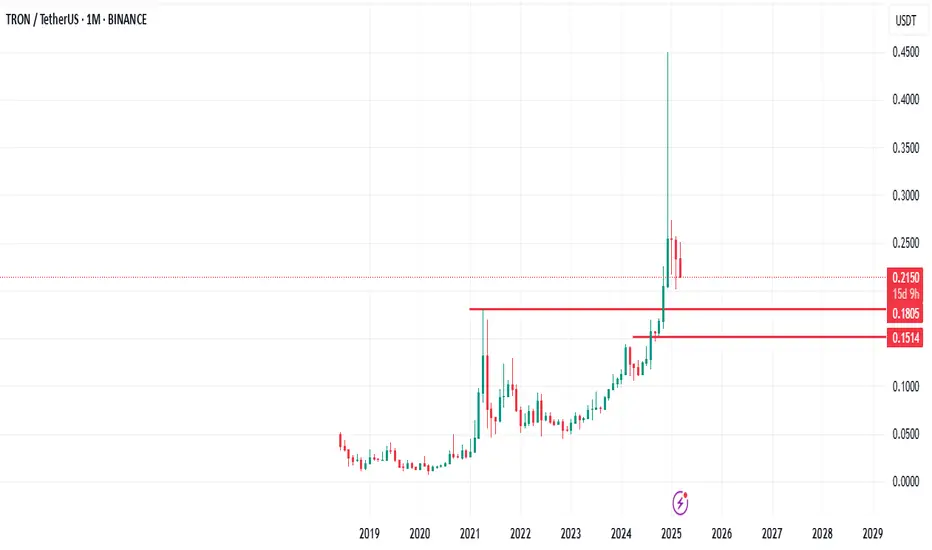
TON the sell is not over. Keep in view $0.18TON the sell is not over. Keep in view $0.18
Have you bothered to look deep into TRX monthly chart?
I feel $0.18 is solid place for TRON to cool off its selling pressure long term.
I look forward to this shit happening for me to load my shopping cart
TRX - asset Punchingasset Punching a slant on a third touchdown.
the target after the breakthrough is the minimum (marked with a blue unit).
I suspect that bad news about this asset is coming.
if you like the idea, please "Like" it. This is the best "Thanks!" for the author 😊 P.S. Always do your own analysis before a trade. Put a stop loss. Fix profits in installments. Withdraw profits in fiat and please yourself and your friends.

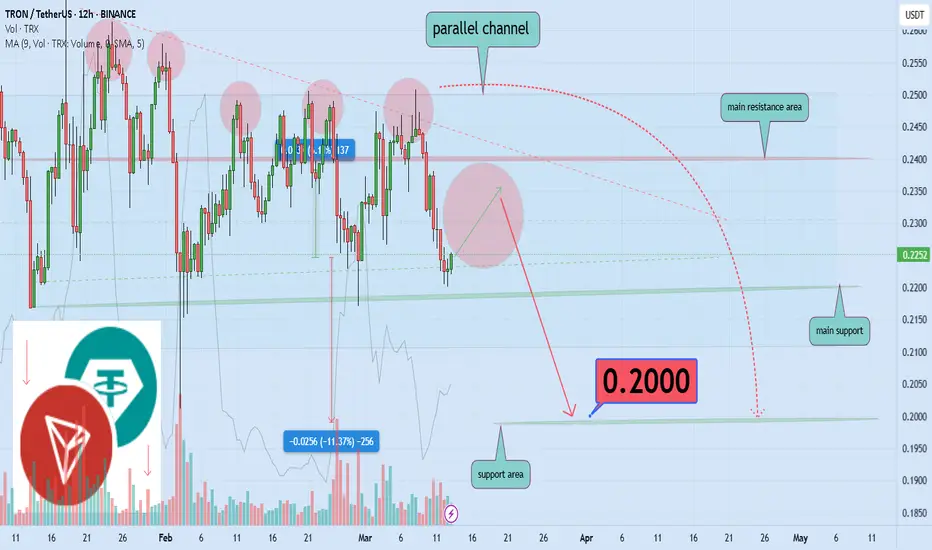
Will Tron Correct 11% and Hit $0.20 Strong Support?Hello and greetings to all the crypto enthusiasts, ✌
Let’s dive into a full analysis of the upcoming price potential for Tron 🔍📈.
Tron is positioned within a parallel channel, nearing a key resistance level. Given its relative strength in the current market compared to other altcoins, I foresee a potential correction of up to 11%. This could lead the price to $0.20, a significant psychological support zone with strong technical backing.📚🙌
🧨 Our team's main opinion is:🧨
Tron is approaching key resistance, with an 11% drop likely to $0.20 support.📚🎇
Give me some energy !!
✨We invest hours crafting valuable ideas, and your support means everything—feel free to ask questions in the comments! 😊💬
Cheers, Mad Whale. 🐋
TRXUSD Another 2 months of consolidation is possible.Last time we looked at TRON (TRXUSD) was almost 6 months ago (September 25 2024, see chart below) when we called for a 1D MA50 (blue trend-line) buy:
The immediate rally that followed, hit our 0.2100 Target in less than 2 months, even breaking above the long-term Channel Up. Since then, the Bullish Leg deflated and settled sideways on a trade within the 1D MA50 (blue trend-line) and 1D MA200 (orange trend-line).
This is an Accumulation Phase and on the current 2023 - 2025 Bull Cycle, it is not the first time we've seen one. In fact the Higher Lows Zone had such phases since its start but the most notable and most similar to the current one is the one between March - August 2024.
Always supported by the 1W MA50 (red trend-line), this Accumulation Phase displayed the same kind of 1D MACD Bullish Divergence and once it formed its first Higher Highs trend-line and rebounded on the 1D MA200, it entered the Parabolic Rally Phase.
If the symmetry holds, then we might see TRX hit 0.6000 by September 2025.
-------------------------------------------------------------------------------
** Please LIKE 👍, FOLLOW ✅, SHARE 🙌 and COMMENT ✍ if you enjoy this idea! Also share your ideas and charts in the comments section below! This is best way to keep it relevant, support us, keep the content here free and allow the idea to reach as many people as possible. **
-------------------------------------------------------------------------------
💸💸💸💸💸💸
👇 👇 👇 👇 👇 👇
