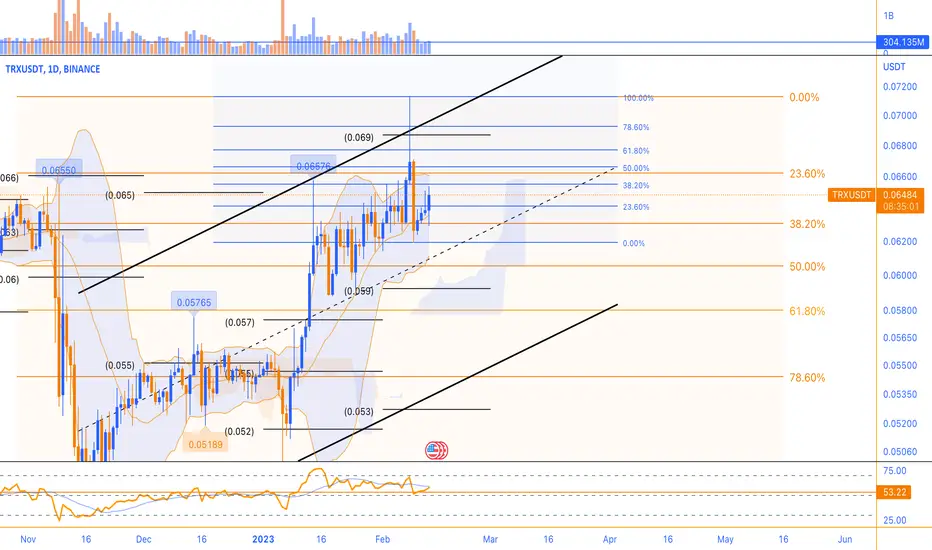
TRX triangle breakoutPlease 1st of all click the boost 🚀 button if you want me to post more ideas and follow me to support my work! It's absolutely for free.
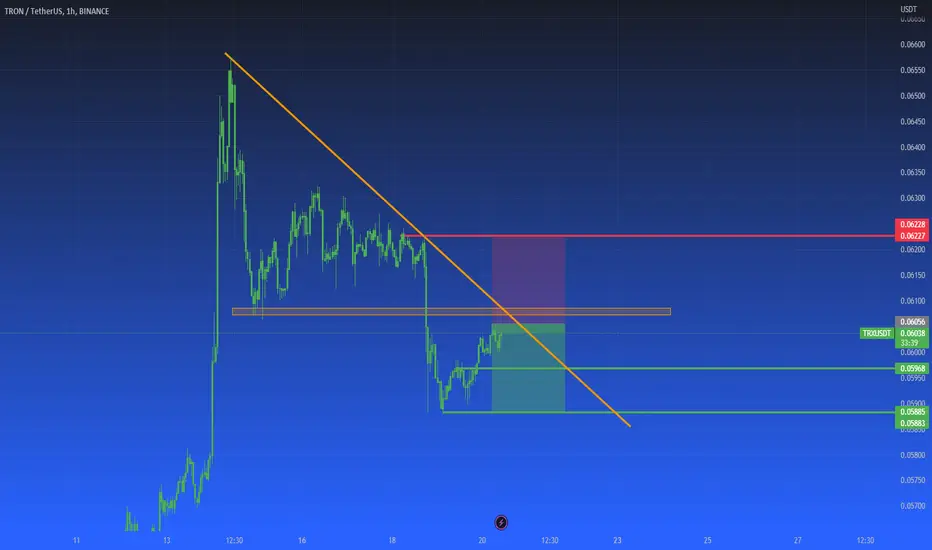
Tron broke up this triangle📐 and now backtested it's upper edge. I think there is chance for run to 0.06905 and even lower. Buying here makes sense to me.
ENTRY : @ 0.06270
STOPLOSS (SL) : local high @ 0.06093
TARGET (TP) : height of the triangle projected from midpoint of the local range @ 0.06905
REWARD RISK RATIO (RRR) : 3.3
INVALIDATION : when SL level hit
Check my other stuff in related ideas.
Please boost🚀, comment🗣️, follow me✒️, enjoy📺!
⚠️Disclaimer: I'm not financial advisor. This is not a financial advice. Do your own due dilingence.
Tron

TRX inverted H&SIn the beginning of this year Tron broke up the major downtrendline☝️. Then after this👇 sucessful call...
... TRX formed Inverted Head and Shoulders 🤷 on the daily timeframe and triggered the pattern by breaking the neckline up (zoom in to see the details). Price then fell back down below the neckline and recently broke up once again. I think there is chance for run to 0.08555 and even higher. The yellow uptrendlines could act as a guide.
INVALIDATION (SL) : Right Shoulder @ 0.05879
TARGET (TP) : Inverted H&S target projection @ 0.08555
Check my other stuff in related ideas.
Please boost🚀, comment🗣️, follow me✒️, enjoy📺!
⚠️Disclaimer: I'm not financial advisor. This is not a financial advice. Do your own due dilingence.

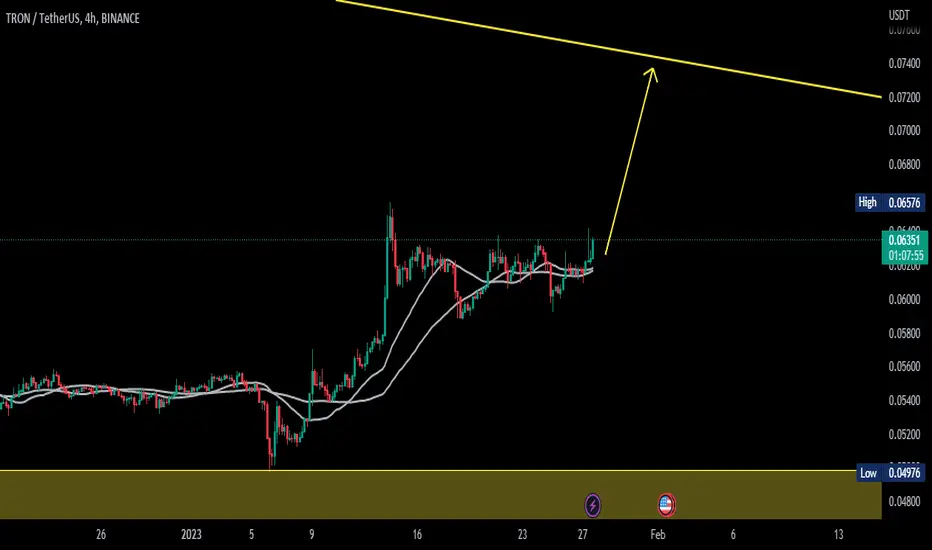
Tron's price volatility range is expected at a level of $0.060For the current week, we can expect the trend to be in the range for the current week, as long as we do not have a strong return below the $0.060 level. But if the selling pressure increases, Tron's price decline can continue to the bottom of the channel, i.e. the support range of $0.056 to $0.058. This week, the TRX price volatility range is expected at a level of $0.060.
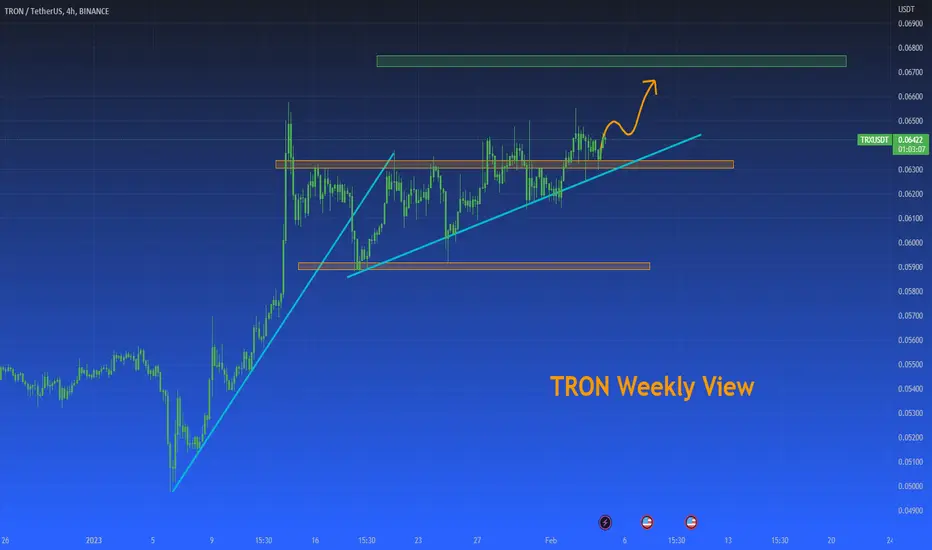
TRON Weekly View - February 2023Hello Guys, Weekly Analysis is on the TRXUSDT Symbol in a 4H Time frame, I Hope it Will be Useful for You, Don't Forget to Like, Follow, Comment

Contracting Bollinger Bands on the 1W chartHello?
Traders, welcome.
If you "Follow", you can always get new information quickly.
Please also click "Boost".
Have a good day.
Following yesterday, today we changed the background color of the chart.
Please leave a comment on which chart is more eye-catching, yesterday's background color or today's background color.
For your information, there is a significant difference between viewing a chart in real time and sharing a chart with a picture.
Therefore, I would be grateful if those who share and use my charts leave comments.
-------------------------------------
(TRXBTC 1W Chart)
The key is whether it can rise above 0.0000 0318 in order to release the upward force.
---------------------------------------
------------------------------------------
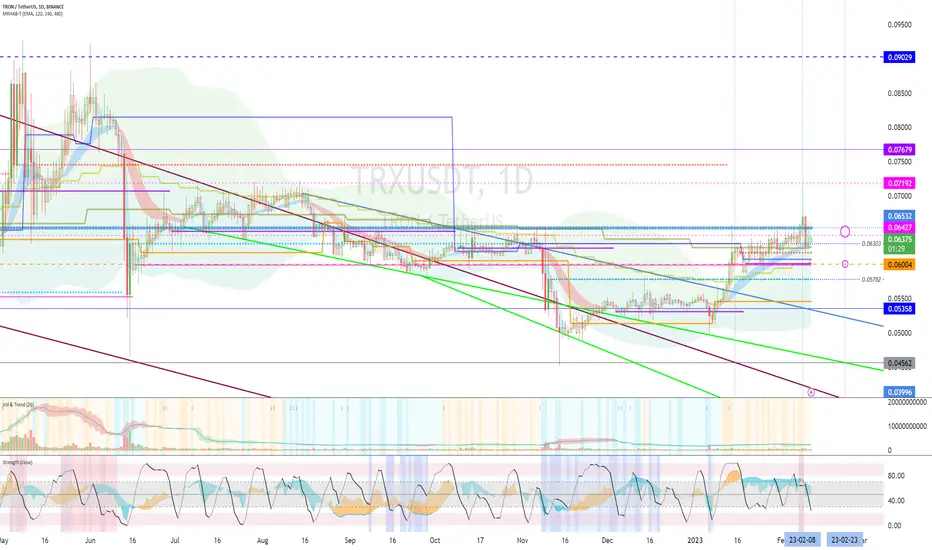
(TRXUSDT 1W chart)
The key is whether it can be supported at 0.06427.
In particular, as the Bollinger Bands are contracting, volatility is expected in the near future.
(1D chart)
It is important to be able to rise above the 0.06427-0.06532 section and be supported.
If not, you should check for support around 0.06004.
TRX is holding the price near the M-Signal on the 1M chart, so it can be clearly seen that the long-term trend is about to turn into an uptrend.
Therefore, as mentioned in the explanation of the 1W chart, it can be seen that the current position is located in a very important section.
If the mid- to long-term wiggle starts, there is a possibility of touching around 0.05358, so you should think about how to respond now.
-------------------------------------------------- -------------------------------------------
** All descriptions are for reference only and do not guarantee profit or loss in investment.
** If you share this chart, you can use the indicators normally.
** The MRHAB-T indicator includes indicators that indicate points of support and resistance.
** Check the formulas for the MS-Signal, HA-Low, and HA-High indicators at ().
(Short-term Stop Loss can be said to be a point where profit or loss can be preserved or additional entry can be made by split trading. This is a short-term investment perspective.)
---------------------------------
✅TS ❕ TRXUSD: ascending wedge✅✅ TRX has formed an ascending wedge.
The price is testing the support level.
The reversal will begin after consolidation under the support level. ✅
🚀 SELL scenario: short to 0.0602. 🚀
----------------------------------------------------------------------------
Remember, there is no place for luck in trading - only strategy!
Thanks for the likes and comments

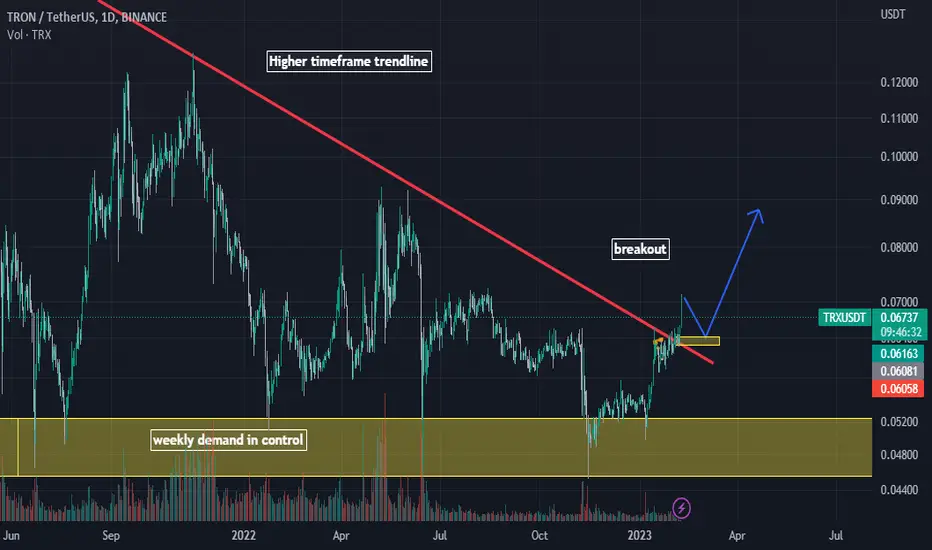
TRX/USDT pumping is near?Hi Dears
Do you heard about WOW TRADE strategy?
We have a higher time frame trendline line (weekly). We are near the demand in control zone of higher timeframe. We break the trendline and after that we have a pullback to the trendline, base that cause this breaking or break even zone.
After that the price will be in the moon.
And now we are watching this strategy for trx usdt.
I hope it works properly.
Sincerely
Hosein Poursaei
Tron TRX is breaking out! Explosive pump is likely.
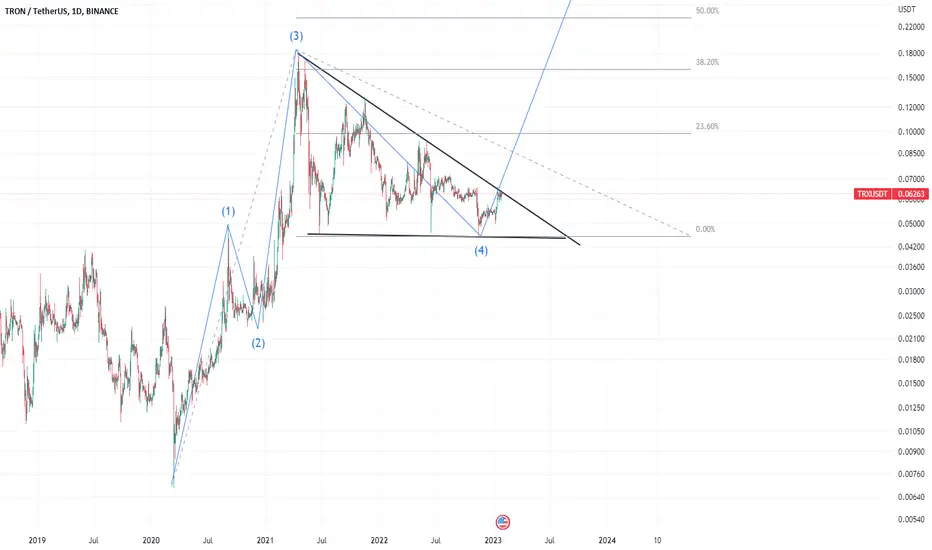
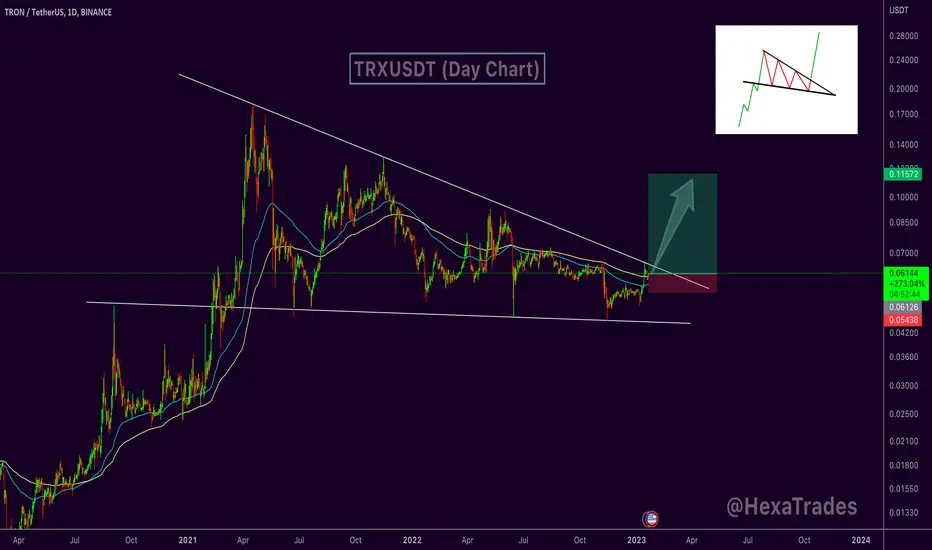
As you can see, TRX is currently breaking out of the descending triangle on the daily/weekly timeframe, and an explosive pump is now likely!
The take-profit is at the top of the triangle, which is 0.18 USDT. I think it's possible to go higher, but we don't want to risk anything, because we could be in wave 5 from the Elliott Wave perspective. Triangles are typically formed as a 4th corrective wave.
This bull market that started in January is absolutely amazing, and I hope it will continue as long as it possibly can! We want to take as much profit as possible from this bull run.
Sending USDT via the TRX network (TRC20) is very popular among crypto people. Furthermore, Tron's value held up very well during the 2022 bear market. It's definitely a positive sign.
Now is the best time to buy TRX if you don't want to miss out on the upcoming pump! It will be huge!
This analysis is not a trade setup; there is no stop-loss, entry point, profit target, expected duration of the trade, risk-to-reward ratio, or timing. I post trade setups privately.
If we take a look at the previous price action from 2020 to 2021, there are no gaps that need to be filled. In other words, it's possible that we will never go back to these levels.
I'm not sure how you feel about it, but I'm already long in the futures market. 171% is a good profit, so be greedy!
Thank you, and for more ideas, hit "Like" and "Follow"!

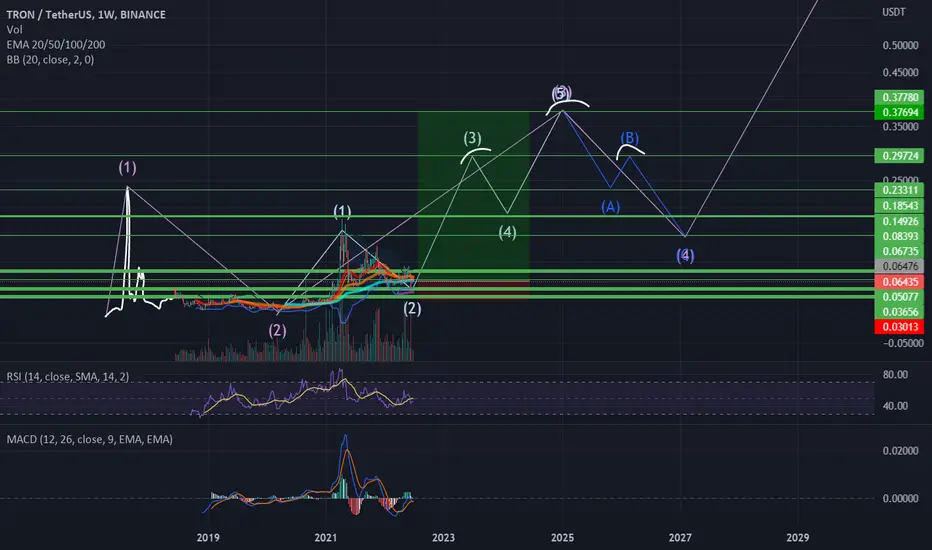
TRX/USDTesting/tracking elliot wave theory. Please do not trade off idea without S/L. Not financial advice.
I had to draw some data in here that was not shown (white squiggly lines) Without full data on a chart, it's hard to count waves accurately. This chart is on the weekly timeframe.
I cannot predict time, however I am trying to with this chart. Future resistance and support lines are also predictions.
RR: 9
Possible upside: 480%
Possible downside: 53%
TRON Weekly View - February 2023Hello Guys, Weekly Analysis is on the TRON Symbol in a 4H Time frame, I Hope it Will be Useful for You, Don't Forget to Like, Follow, Comment
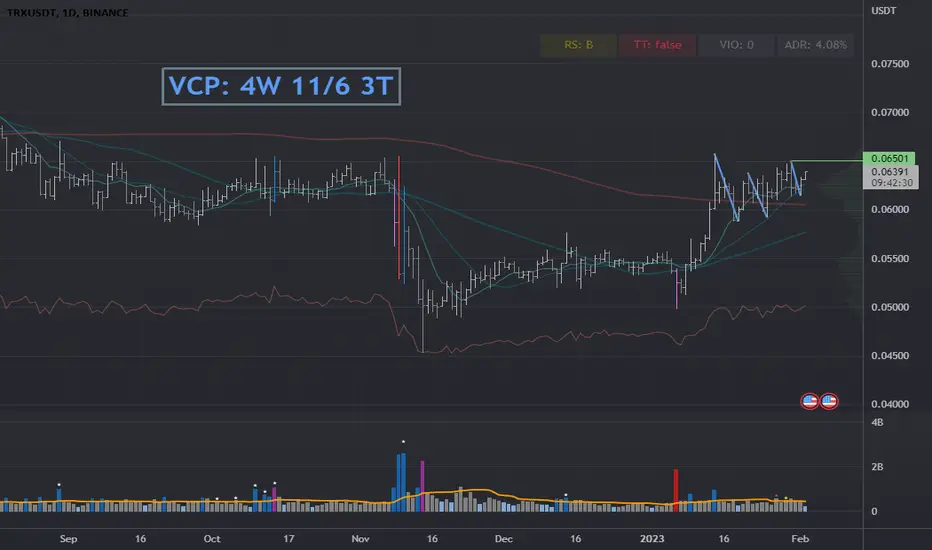
TRXUSD: Daily VCPVCP: 4W 11/6 3T
The posted chart contains a VCP (volatility contraction pattern). The first label "W" stands for weekly and shows the duration of the entire consolidation. In the middle label, the percentage of contractions is indicated (for example, "15/4"), with 15 representing the -15% depth of the base and 4 representing -4% of the last contraction. The last part "T" represents the number of contractions. The light blue lines in the chart correspond to the contractions. A more detailed description can be found in Mark Minervini's books.
RS stands for relative strength and measures the strength of the stock compared to the overall market. The value range is 1-99 with 99 being the highest value. The rank was generated by fyntrade.
TRX Breaking Out the Triangle which is the 4th WaveTRX Breaking Out the Triangle which is the 4th Wave. Projection based on 0.618% fib extension.
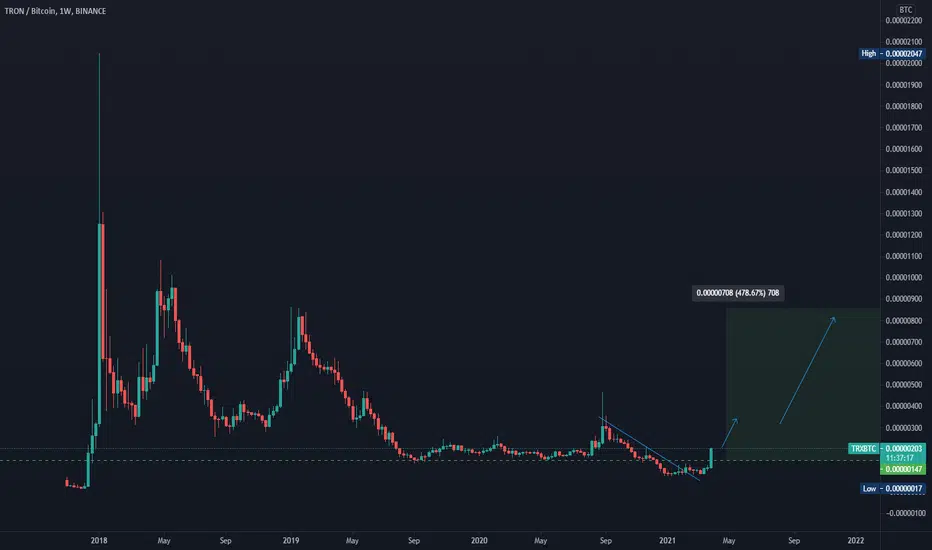
TRX/BTCThis is weekly chart - I am not intraday scalper.
Now Iam in previous accumulation area, I believe this is about time.
First stop will be around 350, second 850.
My position at 147.
TRON Weekly View - JANUARY 2023Hello Guys, Weekly Analysis is on the TRON Symbol in a 4H Time frame, I Hope it Will be Useful for You, Don't Forget to Like, Follow, Comment

✅TS ❕ TRXUSD: broke the ascending structure✅✅ TRX is held under at the bottom of the consolidation zone.
Price is trying to break the structure.
I expect further decline. ✅
🚀 SELL scenario: short to the lower boundary of upward channel . 🚀
----------------------------------------------------------------------------
Remember, there is no place for luck in trading - only strategy!
Thanks for the likes and comments

TRXUSD ❕ liquidity zoneTron is trading in the liquidity zone.
Price is testing 50EMA as support (4H TF)
I expect price to rise while holding in the liquidity zone.
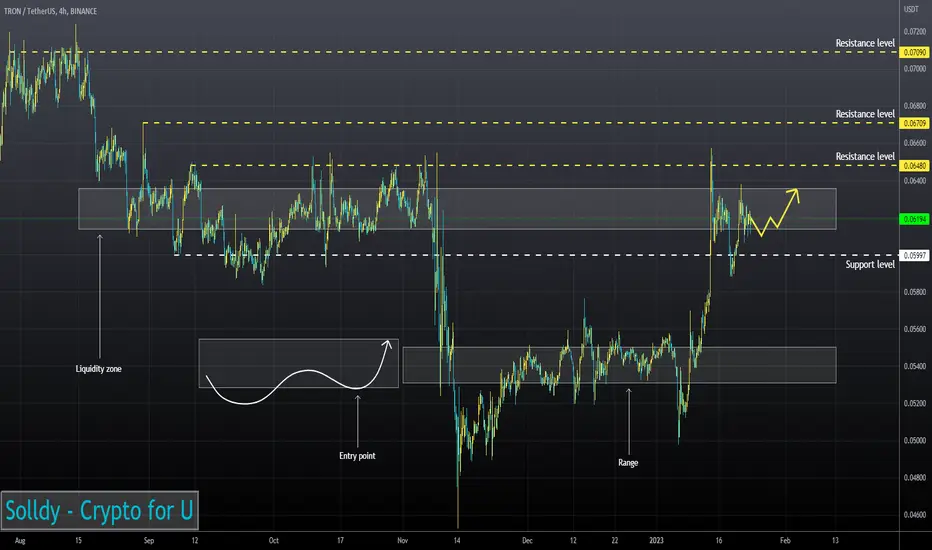
TRXUSDT Ready For Takeoff!TRXUSDT Technical analysis update
If the price breaks above the resistance line then we can expect a good up move in Tron.
Buy zone: Below $0.062
Stop loss: $0.054
Take Profit 1: $0.068
Take Profit 2: $0.077
Take Profit 3: $0.092
Take Profit 4: $0.115
Always keep stop loss
Thanks
Hexa
TRXUSD ❕ correctionTRX trades under liquidity.
Trading volumes remain low.
Price in overbought RSI zone (1H and 30m TFs)
Asset tests 200EMA as resistance (30m TF)
I expect the continuation of the correction after fixing under the liquidity zone.

TRXUSDT Analysis -20 JANUARY 2023Hello Guys, Today's Analysis is on the TRXUSDT Symbol in a 1H Time frame, I Hope it Will be Useful for You, Don't Forget to Like, Follow, Comment
Tron is a low-risk investment, but better than gold and TetherI think that Tron is one of the least risky currencies in the market, which maintained its stronghold and did not experience a large drop, and now I believe that in the weekly analysis, Tron can be considered as a safe and more profitable investment than gold and gold.
For the medium term and of course the long term
Good luck

TRX - Tron is Ready to Breakout of a 2 Year Bullish Pennant!You will be hard-pressed to find a more bullish USD alt chart out there. Tron has a beautiful bullish continuation structure here on the daily that has been forming since the COVID crash in March of 2020. This massive pennant the price action has bouncing within is almost 2 years in the making. I think the breakout here could be huge. The price action is currently repeating the same exit pattern it had back in 2021. If Tron breaks out, buckle your seat belts and HODL on tight! I'm long here.

TRX/USDT :: which one ?TRX/USDT :::
The price may be able to reach the 0.06 range again, but in which direction will it break the triangle ?!
