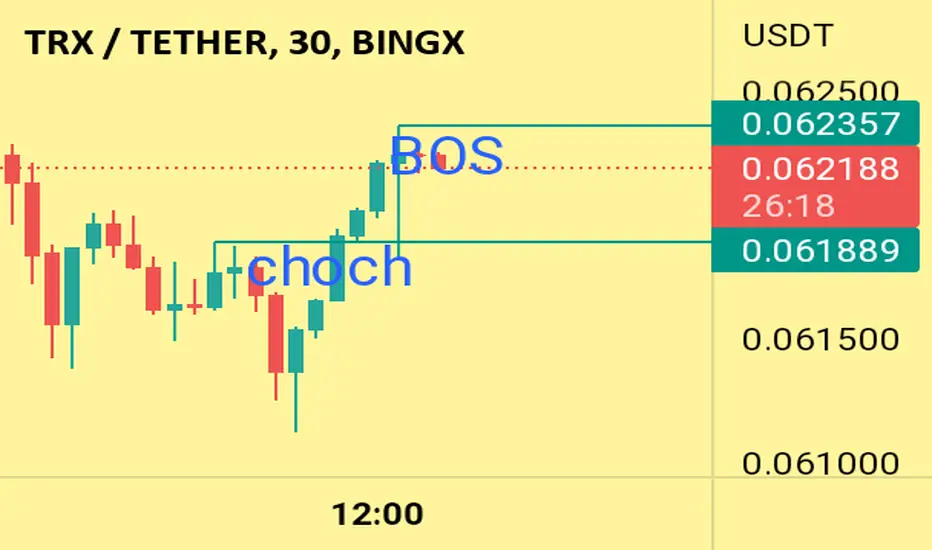
TRX/USDT LONG? Hello friends. This is my comment for the trx chart. By breaking and stabilizing above the BOS line, we can have a bullish view
Trxusdt
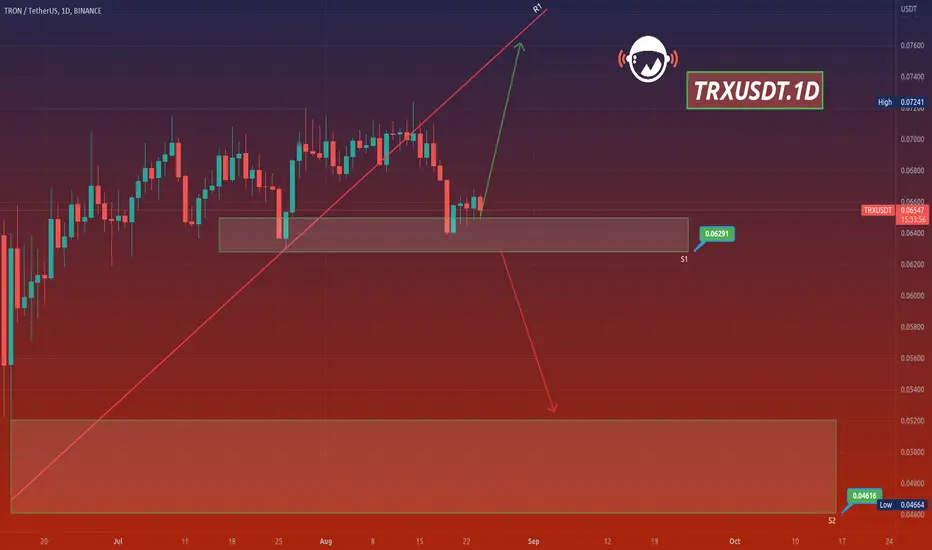
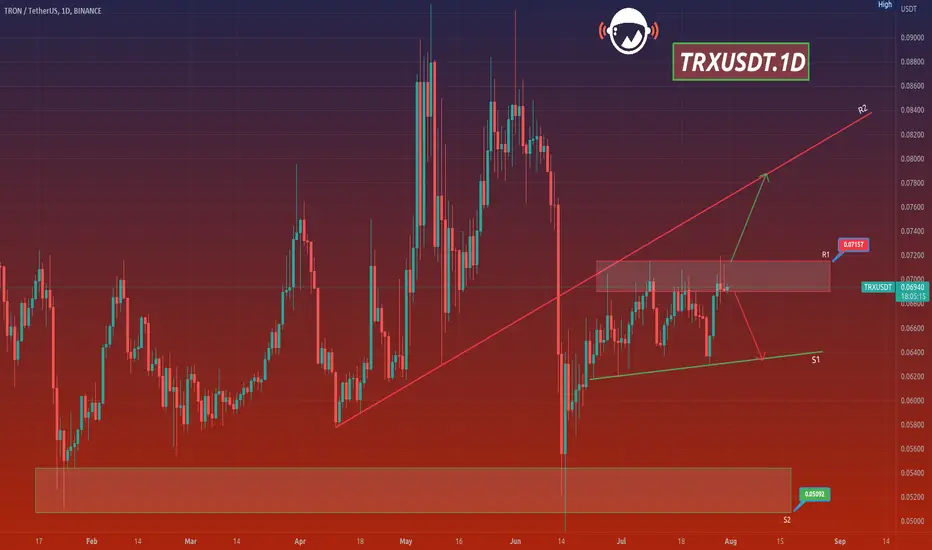
TRXUSDTHello Crypto Lovers,
Mars Signals team wishes you high profits.
This is a one-day-time frame analysis for TRXUSDT
According to our last analysis on August 9, we expected a falling trend and now our expectation came true and all our targets are hit. Here we have R1 that used to be a support line. And S1 and S2 are the support areas which express the support of the price at several points. At the moment, we have the price fluctuating on S1 and we have two scenarios to happen. Either we will receive some rising signs and confirmation candles and we predict an increase for the price to R1 and more. Or the price loses the support here and it will face a decline toward S2. So we must wait and see what happens in the future.
Warning: This is just a suggestion and we do not guarantee profits. We advise you to analyze the chart before opening any positions.
Wish you luck
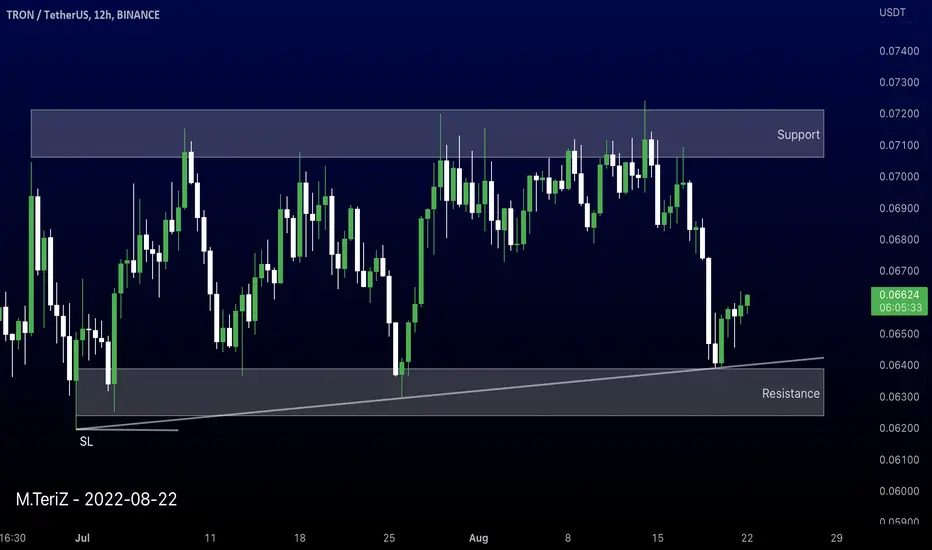
TRXusdt 12H TA: Support & ResistanceAccording to the chart, in the 12-hour time frame, I determined the important support and resistance limits, which are suitable for entry in case of breaking the resistance zone.
Its not Buy or Sell SIGNAL
DYOR
BY : Mohamad Teriz - @AtonicShark
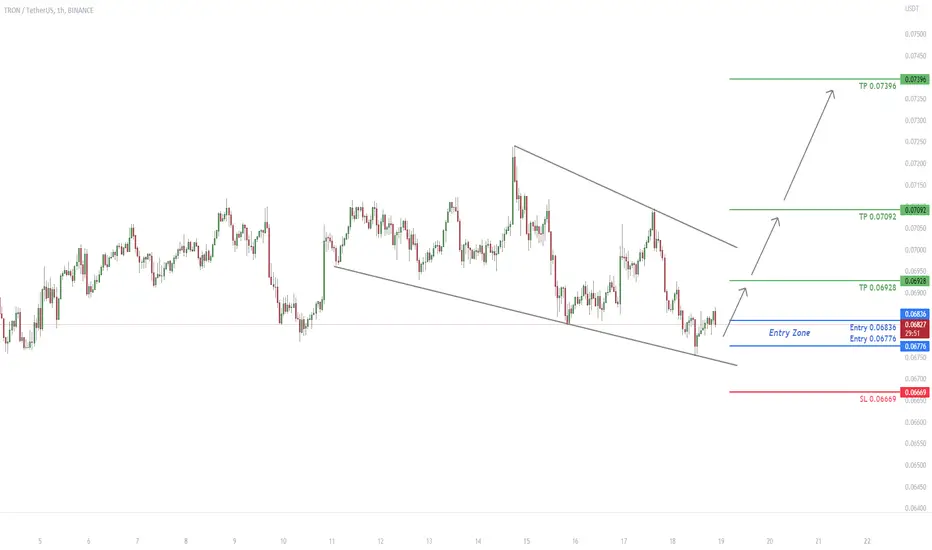
TRXUSDT has got rejected from a major Support zoneTRXUSDT has got rejected from a major Support zone. It has also formed a wedge pattern. There is a potential that the price goes higher.
💎 TRXUSDT
🔵 Entry zone 0.06776- 0.06836
🟢 TP1 0.06928
🟢 TP2 0.07092
🟢 TP3 0.07396
🔴 SL 0.06669
Good Luck 🎲
TRON (TRX) - August 18hello?
Welcome, traders.
If you "follow", you can always get new information quickly.
Please also click "Like".
Have a good day.
-------------------------------------
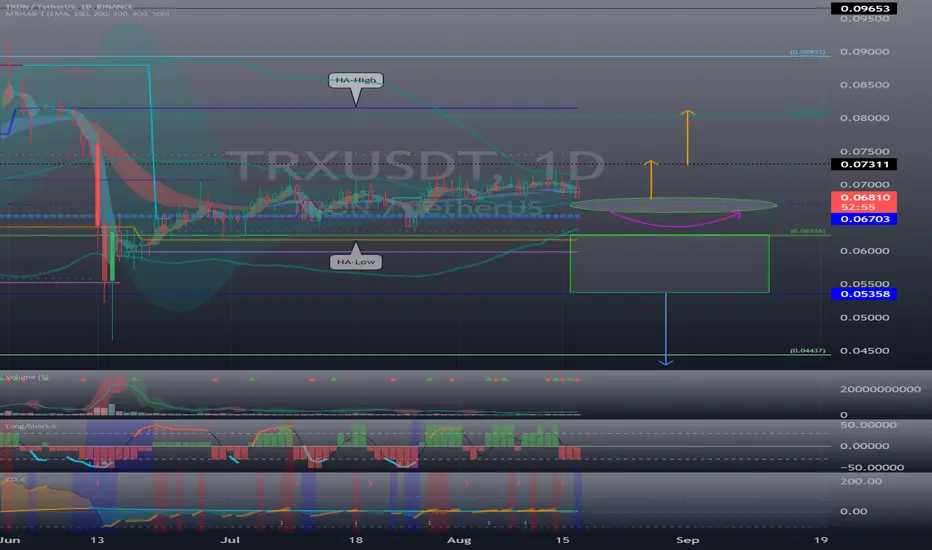
(TRXUSDT 1W Chart)
If the price is maintained above the 0.05358-0.06236 range, the uptrend is expected to continue.
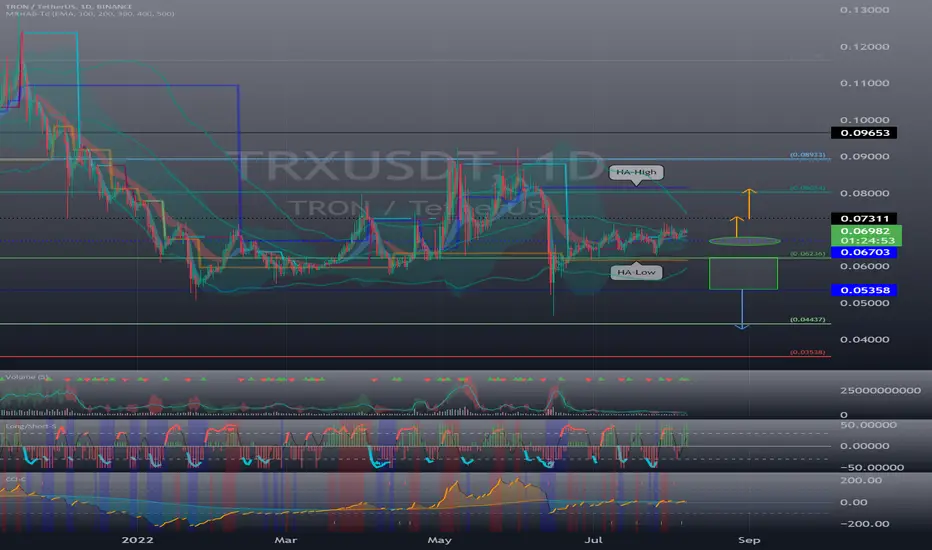
(1D chart)
Primary resistance: 0.07311
Secondary resistance: 0.08034
1st support: 0.06703
2nd support: 0.05358-0.06236
In order to continue the uptrend, it should find support and move higher near 0.06703.
------------------------------------------------------------ -------------------------------------------
** All descriptions are for reference only and do not guarantee a profit or loss in investment.
** The MRHAB-T indicator, which is inactive on the chart, contains indicators that indicate support and resistance points.
** Background color of Long/Short-S indicator: RSI oversold and overbought sections
** Background color of CCI-C indicator: When the short-term CCI line is below -100 and above +100, oversold and overbought sections are displayed.
** The OBV indicator was re-created by applying a formula to the DepthHouse Trading indicator, an indicator disclosed by oh92. (Thanks for this.)
(Short-term Stop Loss can be said to be a point where profit and loss can be preserved or additional entry can be made through split trading. It is a short-term investment perspective.)
---------------------------------
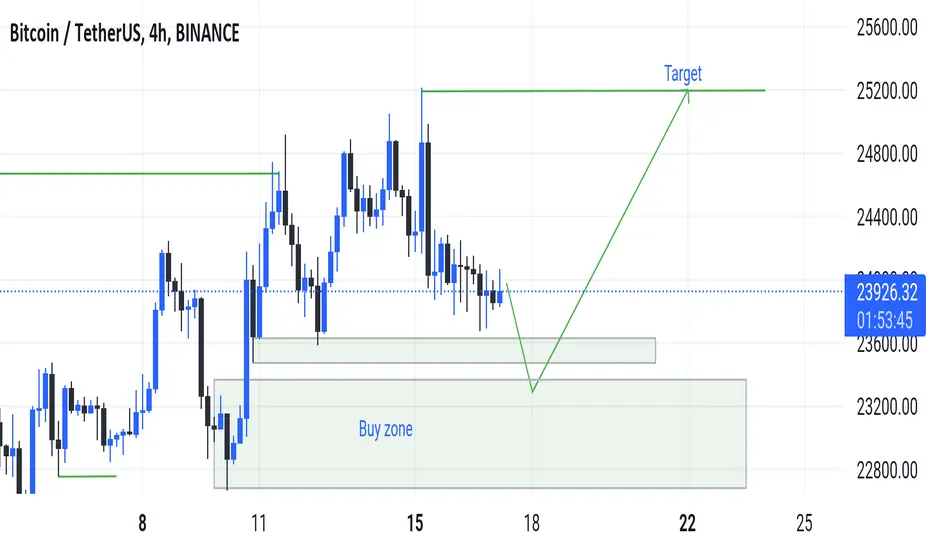
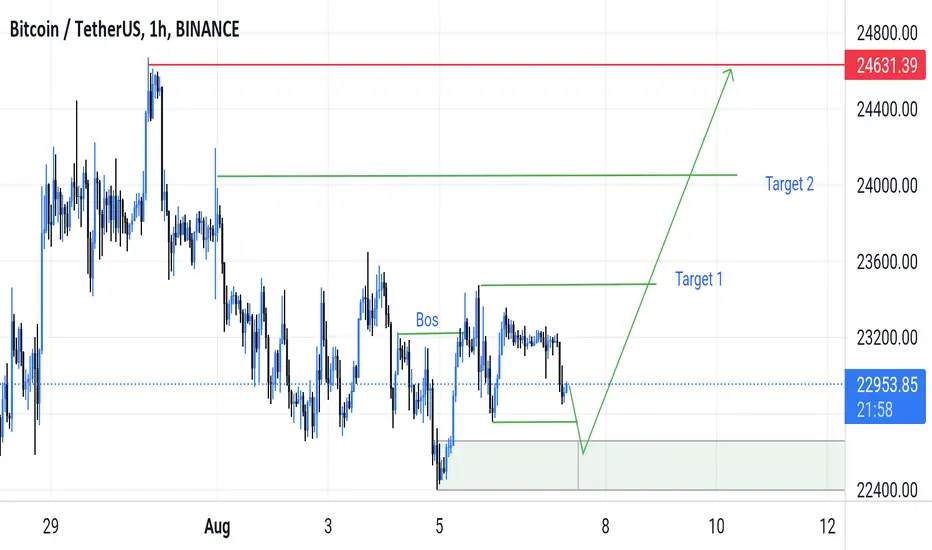
Btc usdt long ideaMarket showing some bullish moment, buy and target mentioned on chart,
Always must use risk management and stop los,
, Always do your analysis before the take entry, thanks for watching,
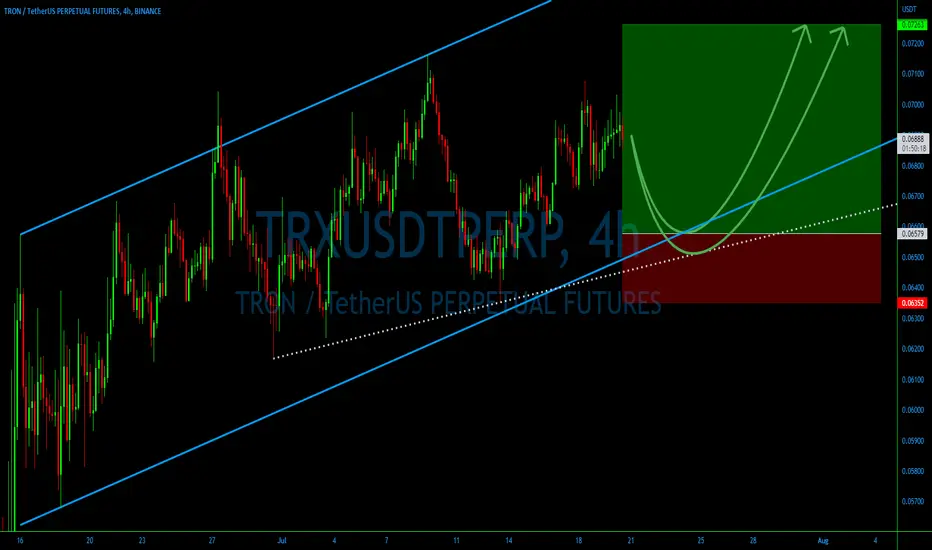
Tron update 16 August 2022 For more information check out my show on YT, thank you all for clicking that boost button.
Red block is worst case, green represents the best case although price ranges are conservative
TRXUSDT |Coin Review| Breakdown by 6% to the depositHello everyone, I wrote a new idea for you. I think it's easy to like and subscribe to the channel, thanks😉
📌Ascending Triangle Formation
📌The price has broken through the support zone of the pattern, I expect a further decline to approximately the zone ($0.06522)
📌 Bitcoin is dominating now, alt dominance is on ATH When bitcoin starts to rise, alt will catch a deep correction.
📌Not financial advice, just sharing my thoughts on what I think about the schedule!

TRXUSDTHello Crypto Lovers,
Mars Signals team wishes you high profits.
This is a 4-hour-time frame analysis for TRXUSDT
Based on our last analysis on July 31, we predicted a rising trend and now the price is on the rise after it faced a little fall. In the current chart, there is R2 which used to be a support line and R1 is the resistance line that shows the price was not able to rise. Also, S1, S2, and S3 are the support areas that all contain the support of the price at different points. So here we have the fluctuation of price on S1 and we predict two options for it. Either it is able to rise over this line and by giving us some confirmation candles, more rise is waiting for it up to R1. Or it will lose the support at this point and falls to S2 and then by a pull back to S1, it will have another fall.
Warning: This is just a suggestion and we do not guarantee profits. We advise you to analyze the chart before opening any positions.
Wish you luck

TRON (TRX) - August 8Hello?
Welcome, traders.
By "following", you can always get new information quickly.
Please also click "Like".
Have a good day.
-------------------------------------
(TRXUSDT 1M Chart)
In the long term, keeping the price above 0.05358 is key to sustain the uptrend.
(1W chart)
Resistance: 0.08034-0.08933
Support: 0.05358-0.06236
In order to show an upward trend from a mid- to long-term perspective, the price needs to be maintained above the HA-High indicator.
To do this, you need to shake it up and down to make the HA-High indicator fall or rise above the HA-High indicator.
(1D chart)
Primary resistance: 0.07311
Secondary resistance: 0.08034-0.08933
1st support: 0.06703
2nd support: 0.05358-0.06236
Whether it can move higher than 0.07311 is the key.
Since they are holding an uptrend on the 1M chart, i.e. long term, the key is whether they can turn into an uptrend in the short and medium term.
------------------------------------------------------------ -------------------------------------------
** All descriptions are for reference only and do not guarantee a profit or loss in investment.
** The MRHAB-T indicator, which is inactive on the chart, contains indicators that indicate support and resistance points.
** Background color of Long/Short-S indicator: RSI oversold and overbought sections
** Background color of CCI-C indicator: When the short-term CCI line is below -100 and above +100, oversold and overbought sections are displayed.
** The OBV indicator was re-created by applying a formula to the DepthHouse Trading indicator, an indicator disclosed by oh92. (Thanks for this.)
(Short-term Stop Loss can be said to be a point where profit and loss can be preserved or additional entry through split trading. It is a short-term investment perspective.)
---------------------------------
TRON TRX short Entry Range, Take Profit and Stop LossTRX/USDT short
Entry Range: $0.067 - 0.073
Price Target 1: $0.064
Price Target 2: $0.057
Price Target 3: $0.052
Stop Loss: $0.077

Btcusd longBtc Usdt showing bullish moment , buy and target mentioned on chart,
Always do your analysis before entry,
Happy trading
TRX - descending Chanel Resistance hey guys this is my idea about TRXusdt the price is getting close to descending channel resistance and more likely it will get rejected like before

TRXUSDT Elliott Waves Analysis (Global Vision)Hello friends.
Please support my work by clicking the LIKE button👍(If you liked). Also i will appreciate for ur activity. Thank you!
Everything on the chart.
It is quite possible that we're still in triangle Global Wave of (IV).
Cancellation of scenario - consolidation under ~0.044.
Stop: ~0.42
Main target zone: 0.3 - 0.35
Risk/Reward: 1 to ~20
Good luck everyone!
Follow me on TRADINGView, if you don't want to miss my next analysis or signals.
It's not financial advice.
Dont Forget, always make your own research before to trade my ideas!
Open to any questions and suggestions.

TRX/USDT Analysis for next movePrice is expected to fall to buy zone which is around 0.05$ which is a good buy zone.
Please Like, share and comment.

TRXUSDTHello Crypto Lovers,
Mars Signals team wishes you high profits.
This is a one-day-time frame analysis for TRXUSDT
In the present chart, we have R2 that used to a support area. R2 is our resistance line and the disability of the price to rise is shown. And S1 and S2 are the support areas which include the support of the price at several points since the past. Presently, the price is fluctuating in R1 area and we must wait for it to leave the area. Thus we will have two scenarios for it. Either it will rise over R1 and by giving a fixation and receiving some confirmation candles, we expect more rise or it toward R2. Or it is possible to fall below R1 and then have more decline to S1.
Warning: This is just a suggestion and we do not guarantee profits. We advise you to analyze the chart before opening any positions.
Wish you luck
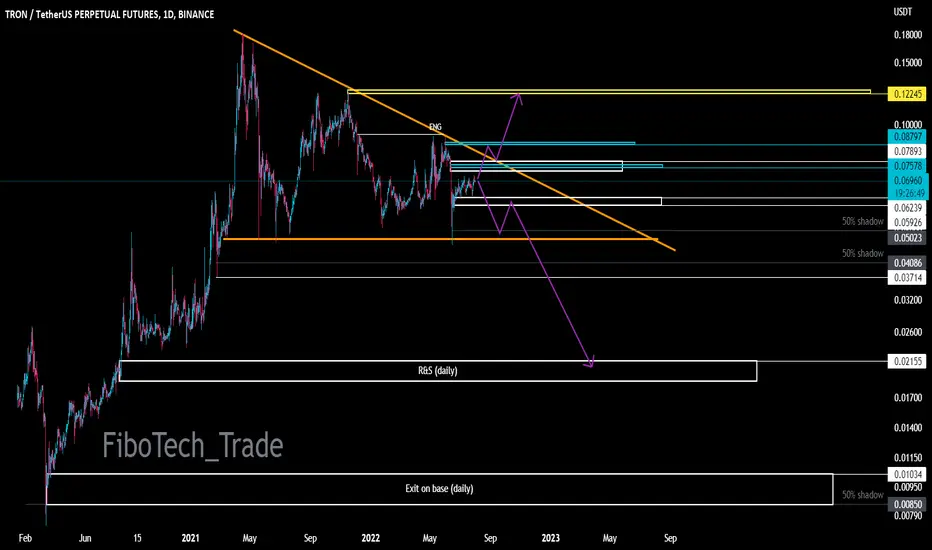
TRXUSDTHello my dear friends
The triangle pattern is very cleanly formed in the higher time frames.
If the current trend is below the price range of $0.0592, the possibility of forming a downward trend similar to the drawn scenario is not out of mind.
But if the current trend is above the price range of $0.07893, there is a possibility of forming an upward trend similar to the drawn scenario.
According to the momentum of the current trend, the possibility of forming the first scenario (downtrend) is more likely.
We would be happy to hear your comments.
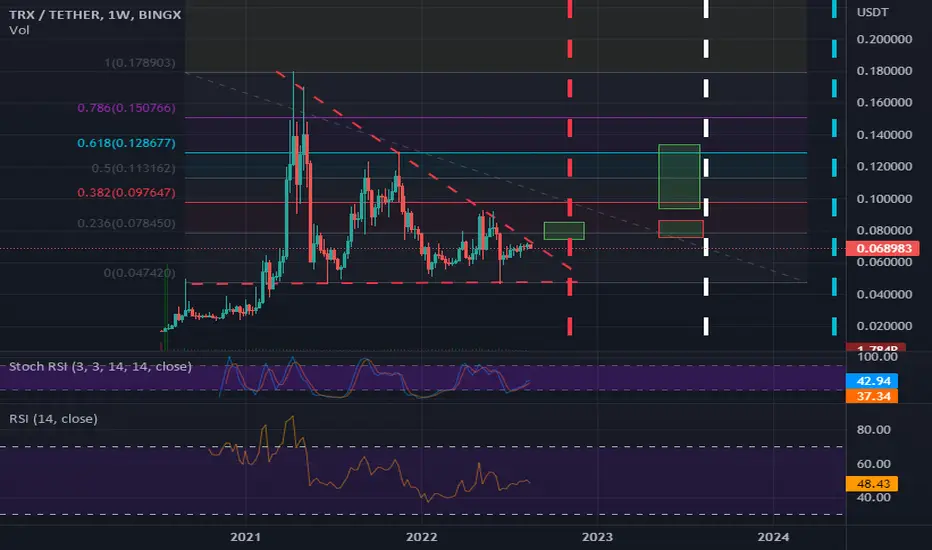
TRON setup in 1 Look! TRXUSDT Update 📈📉Hello traders, what's going on today ?!
Since 21 FEB 2022, that I posted the last analysis
for trxusdt , TRON has continued to fluctuate in a symyrycal triangle till now . (more than 30%💰 (1x)short).
Also today as you see in the weekly timeframe for trxusdt , it can continue to fluctuate more , then finally will breakout this great triangle pattern ,which typically a strong bullish pattern , but at the current situation due to uncertainty about the future , I' not sure that it can massively rise or may fall again after any breakout
but I know where more likely the price action have a reaction , thus for any possible scenario I already have a proper setup with a favorable R:R ,that can be triggered automatically !
✌️ Good luck with your trading and investing and remember: Trade smart…OR JUST DON’T TRADE!
--------------------------------------------------------------------------------------------------------------------
👉This analysis is my personal opinion ,not a financial advice ,so do your own research.
💜 if you're fan of my analyses please follow me , give a big thumbs 👍 OR drop a comment 🗯

TA 2022-07-27: TRX/USDTTechnical Analysis By: Yaser Rahmati
1. Date: 2022 27 July
2. Pair: TRX/USDT
3. Position: Short
4. Entry: 0.06595
5. SL: watch OB @ 0.06762, maybe retest up to this level
6. TP1: 0.06511
7. TP2: 0.06437
8. TP3: 0.06383
9. Market: Future

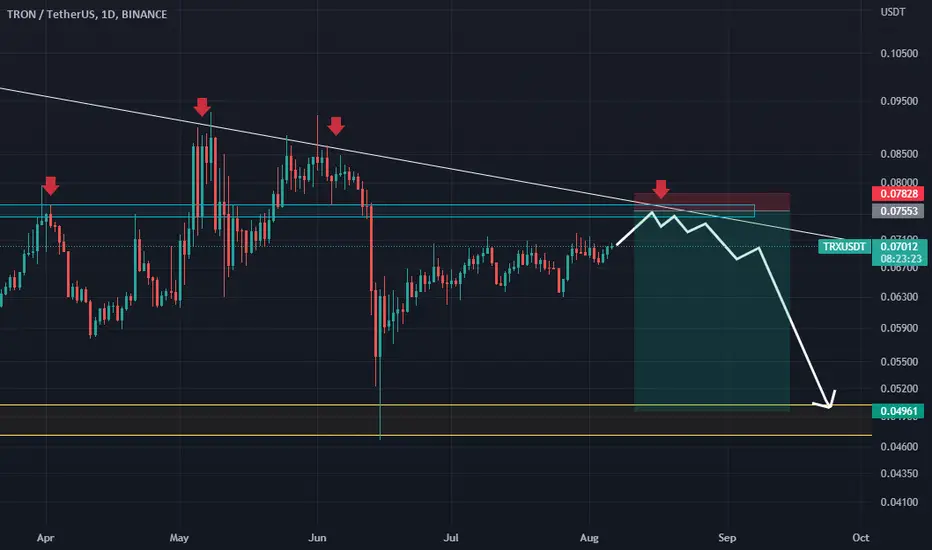
TRX Tron short Entry Range, Take Profits and Stop LossTRX/USDT short
Entry Range: $0.063 - 0.070
Price Target 1: $0.060
Price Target 2: $0.057
Price Target 3: $0.052
Stop Loss: $0.073
another short chart

TRX/USDT - waiting long-term buyTrend starting to turn bullish as for multiple other altcoins. Yet, pullback would be ideal for a good risk/rewards buying opportunity. Waiting....
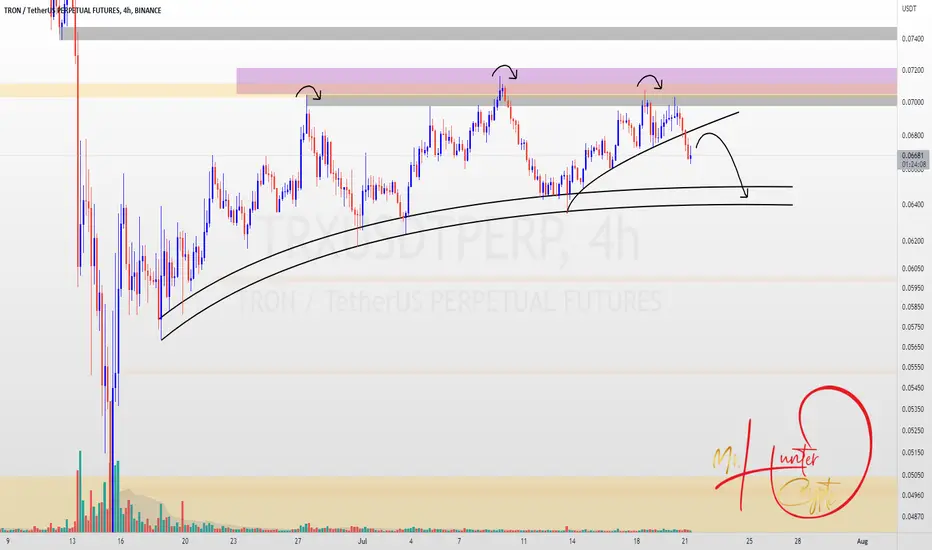
TRXUSDTPERPAfter the sharp fall of the price in this width, we have witnessed the formation of a very strong resistance in the area of 0.07. This time, the price has formed a head and shoulder pattern by rejecting from this area. Pullback broke into the trend line and continued to fall, but in case of further fall without pullback, the 0.064 area can be considered as an important support area, and if it is lost, lower prices are considered for this.