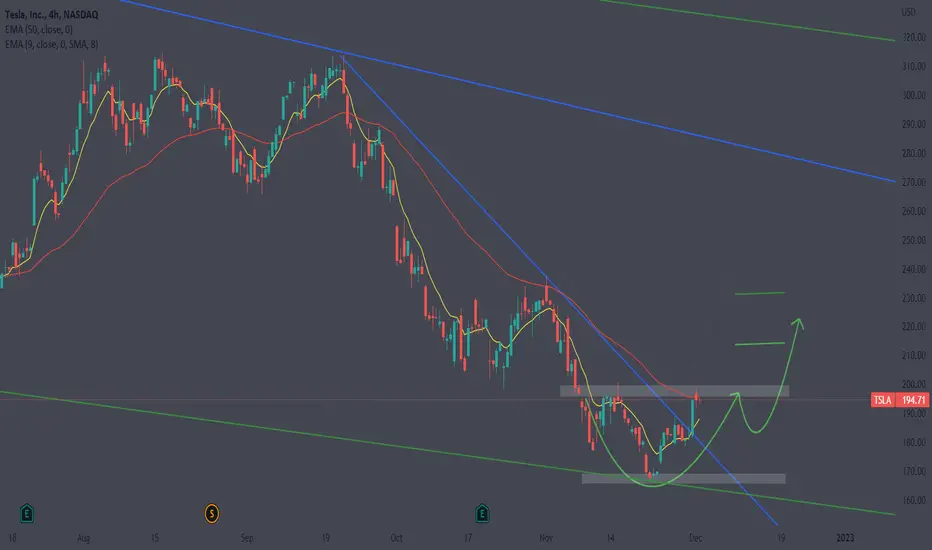
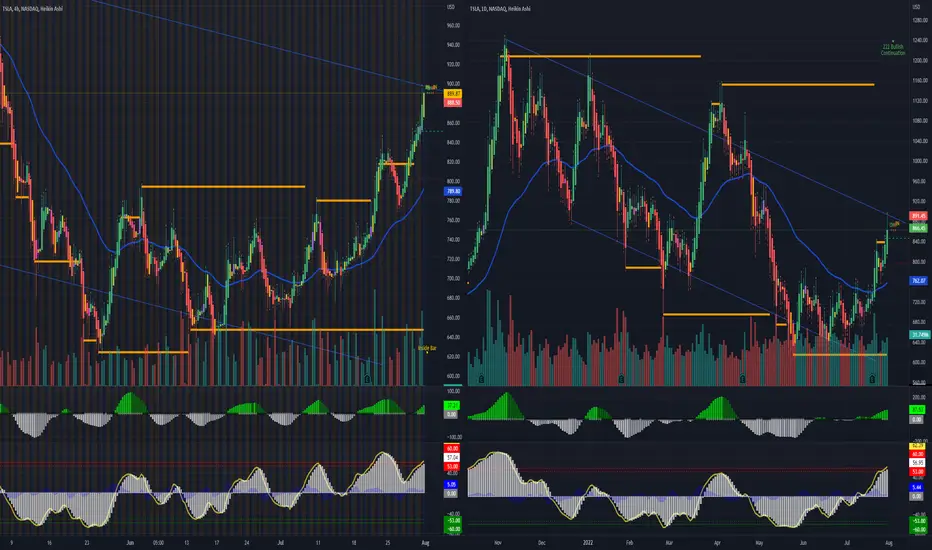
$TSLA pull back is a bear trap?$TSLA soars after beating the eps couple weeks ago, along with the market bounce from inflation data and other news.
i think this pull back is a must to cool off after soaring almost 100$ in a month. daily chart rsi shows its over bought and
4hour chart show its entering the squeeze zone. but the momentum of tsla still looking strong for now until the higher time
frame breaks below moving average.
TSLA average price move per day is $7-$13 per day depending on market volatility and catalyst.
Below is the price level I'm looking for entries and exit for TSLA:
Buy call above 200.60 and sell at 204.90 or above
Buy puts below 192.09 and sell at 188.06 or below
make sure that you set up alerts on those key level so you wont miss the move.
and always to take your profits as you see one.
Tslaidea

Tesla + Trade Setup
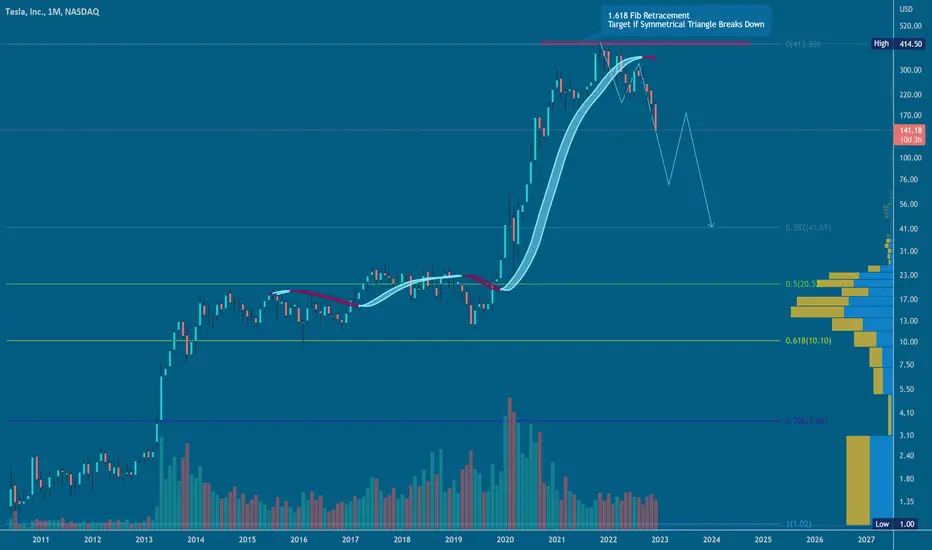
I think that this share is in an upward trend.
Currently, the ascending wave 3 has been completed and the share is in a corrective A B C trend, in this A B C wave A is completed and we are building wave B, wave C will be much bigger and faster.
Trading tip: Personally, I will trade wave c, and the return point or trading target may be a little lower than the parts specified and a candlestick with a very long shadow will be formed. As a result, I will do the opposite transaction with more patience and at the bottom of the shadow.
General conclusion: This share has a lot of growth potential and the best point of selling and exiting the entire share is as follows: 35% is at the price of 3150 and 65% is around the price of 9000 to 1000 dollars.
Warning: This analysis is valid until the previous ceiling of $410 is completely broken with a powerful candlestick. If it is not broken and the double ceiling is formed, scenario 2 will be activated, which I will definitely update at the right time.
In any case, the transaction up to the previous limit has a low risk.
Be successful and profitable.

TSLA at weekly resistance. A pullback expected.TSLA hitting a weekly resistance here. A pullback is expected here even if the momentum is there to break it in coming weeks.
In case of pullback from the current weekly resistance, price should find a support here and continue its upward journey from here. The probability of this scenario is very high.
If the price breaks the first support then the probability of this monthly support holding the price is extremely high.

TSLA - A Short Story ;DIf you didn't short Tesla at $386 then I don't know what you were busy doing! Easiest short ever with PE @ 1396.86! Buy again when PE gets below 50!
$TSLA - Get ready! $TSLA - Get ready! 🚀
It's brewing nicely at a great support:
Support: 165
Resistance: 200
Break above 200 next areas of interest are between 210 - 230 Break below 160 areas this idea is no longer valid.
Longer term: 260-270 could be achieved.
Enjoy
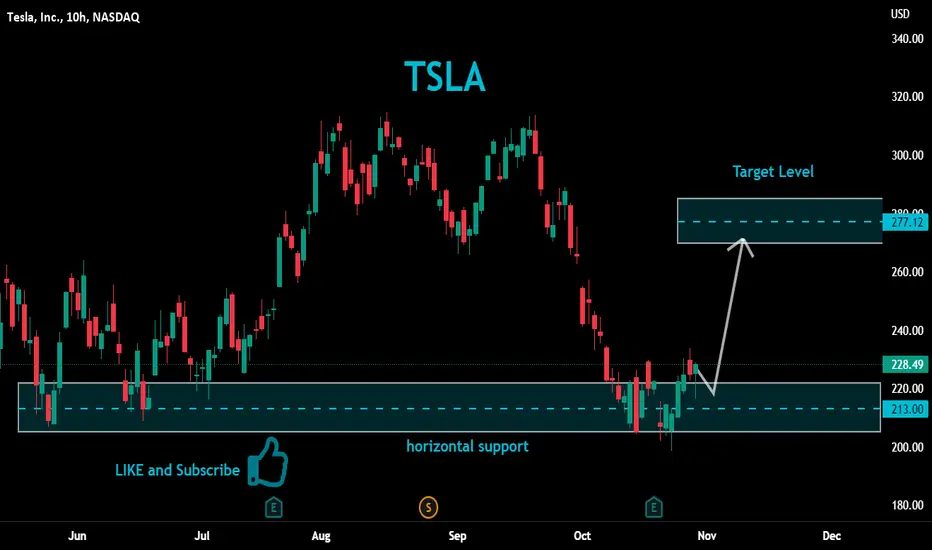
TSLA Long From Support!TSLA has retested a horizontal support AT 213.00
From where we are already seeing
A bullish rebound and I think
That the move up will continue
Towards the target above !!
TSLA EASY SCALPING IDEA (little risky) $$$TSLA is oversold on the RSI, and we may see a lot of buying pressure this week to close the gap we made today. Looking at previous RSI bounces, we bounced off levels 29-30 twice recently, so it is possible we bounce back when the RSI reaches around 29 - 30. Please keep in mind that my outlook on TSLA remains bearish, but it is more likely that we may see bullish price action in the short term

TSLA Time To sellafter the rejection of the price several times at the level of a supply zone with a divergence of the Rsi we will see a drop in the price

$TSLA - Bullish Channel Intact $347 price TargetLooks like a clear channel has been formed to the upside with the price target at the intersection between the top of the channel line and the Pennant line at around $347. All Moving Averages looks like a bullish squeeze and converge about to take place

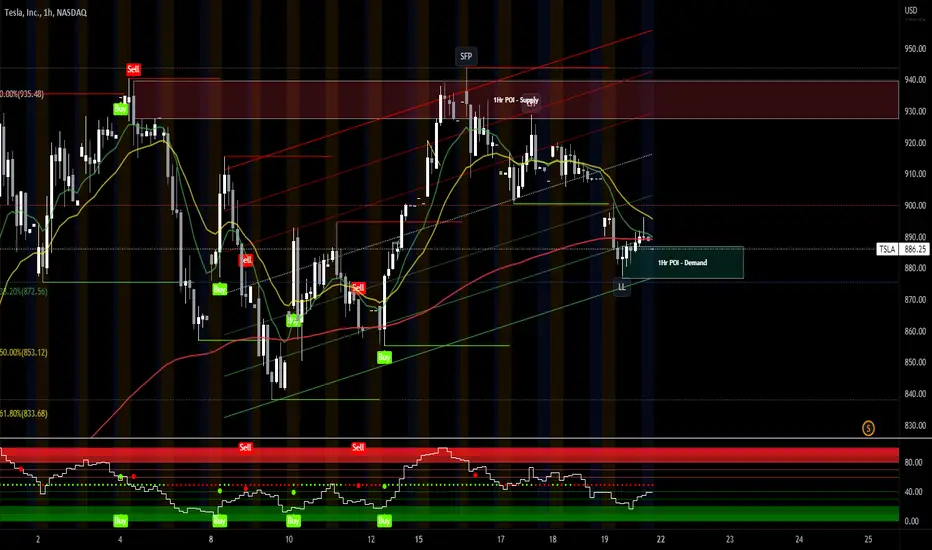
$TSLA ready to boost production for the split?🔸️Ticker Symbol: $TSLA timeframe: 1 Hour 🔸️2X Bull Pattern 🔸️Investment Strategy: Long
TECHNICAL ANALYSIS: The whole market started to pullback at the end of last week; If we take a look back on $TSLA, we see that the indicators have been spot on with predicting market moves 1-2 days before price reacts correctly to the projections. I have two predictions for $TSLA moving into next week;
1.) We pull back into the 1-hr demand level from Friday; I will be personally looking for the Swing Fail Pattern if we can stay above 877.57; but it is very possible we retest the top of demand at $886.86; if price holds this demand, then look for a run up to the $930's before the split occurs this Thursday (25 Aug).
2.) Price breaks below 877.57, and we continue to our next support level at $855. This is not my favorite setup, as we have money momentum moving back into the market, we have a nice bounce off the bottom of our regression channel, and I will be looking for our middle band to turn green come Monday.
** Play smart on $TSLA, and react to these key levels (bounce at $886 to go long and a break below $877 for a short position)!
🔔 Follow for daily stock, crypto and forex technical analysis .
⚠️ Trading is risky, and I understand nothing is guaranteed. Proper risk management should be in place at all times to minimize losses. Please consult a financial advisor before trading. All Inclusive Trading LLC is not a financial advisor and may not be held liable for any losses which may occur.
$TSLA bulls is back!$TSLA stock climbs after beats its earnings expectation few days ago and continue to soars after fed meeting. No major news about the pipeline just pure technical breakout.
as for the chart pattern, TSLA is making lower high and i expect TSLA will pull back tomorrow, before is starts to push to high again.
here my price target for $TSLA for monday 08/01/22.
============================================================
For calls; buy above $911 and sell at 935 or above
For puts, buy below 880.89 and sell at 874.18 or below
============================================================
Welcome to this free technical analysis . ( mostly momentum play )
I am going to explain where I think this stock might possibly go the next day or week play and where I would look for trading opportunities
for day trades or scalp play.
If you have any questions or suggestions on which stocks I should analyze, please leave a comment below.
If you enjoyed this analysis, I would appreciate it if you smashed that LIKE button and maybe consider following my channel.
SHORT TSLATSLA downside looks like it's just getting started...
TARGET 1: $522
TARGET 2: $350-$400
TARGET 3: $275
TARGET 4: $185
I don't know if all downside targets will happen, but I think we see $500 range relatively quickly and can reassess from there

$TSLA - Bullish Pennant Setup, Imminent BreakoutGreat Buy Signal at the bottom of pennant with Stock RSI in oversold territory. Coiling into imminent breakout to the upside intact. $1,500-1,800 price objective per upward channel by EOY.

TSLA ALERT ⚠️ 📢 Late but it will go down today and will close at its rasistance but will go up after 2 days

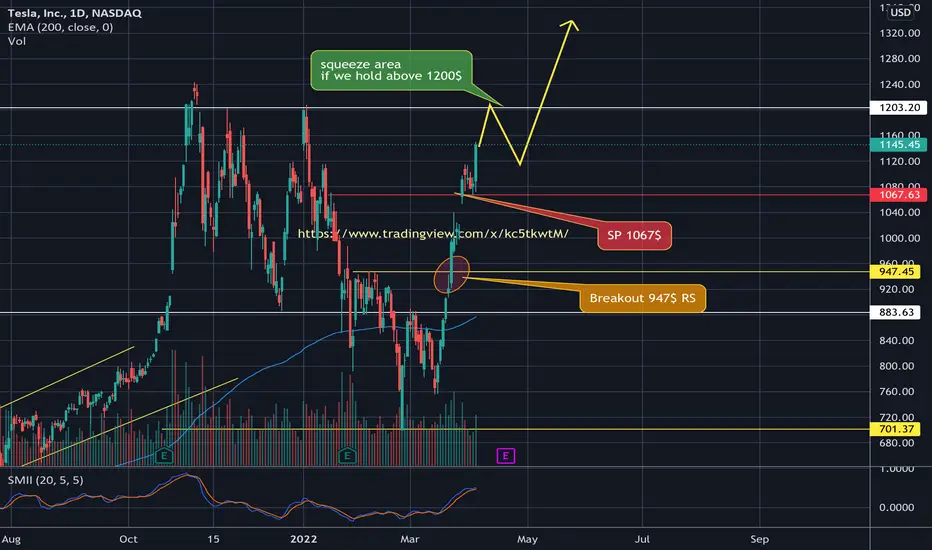
TSLA Bull-run continuation we have one Resistant lift at 1200$, which will be another breakout, and seeing all time high for tsla, but we expect a bit of fighting back from the short around this area , but we need to hold our first support to confirm the strength of our trend , other wise we will go back to the second support .
holding above the 1200$ will confirm the bull-run contention for tsla .
$TSLA - $1,500 Channel Trajectory INTACT-Stock price can trade outside of the channel,
but has in the past revert back into its channel.
-Stock Price has many times bounced off its 200MA.
The upward direction of the Channel is still well intact.
Price target herein purely based on technical channel. Fundamental target in my opinion is much higher by year end for the bull case.

Tesla Analysis 22.01.2022Hello Traders,
welcome to this free and educational analysis.
I am going to explain where I think this asset is going to go over the next few days and weeks and where I would look for trading opportunities.
If you have any questions or suggestions which asset I should analyse tomorrow, please leave a comment below.
I will personally reply to every single comment!
If you enjoyed this analysis, I would definitely appreciate it, if you smash that like button and maybe consider following my channel.
Thank you for watching and I will see you tomorrow!

TSLA (Tesla) LONG Inverse Head&ShoulderBUY TSLA at $982.00 OR NOW AT $1040
Take Profit 1- $1100.00
Take Profit 2- $1190.00
Take Profit 3- $1243.00
Take Profit 4- $1310.00
Support: $980.00-$1000.00/ $940.50-$930.00/ $909.00/$860.00/ $830.00 / $780.00-$780.00
Resistance: $1078.00/ $1115.00/ $1196.00/ $1245.00
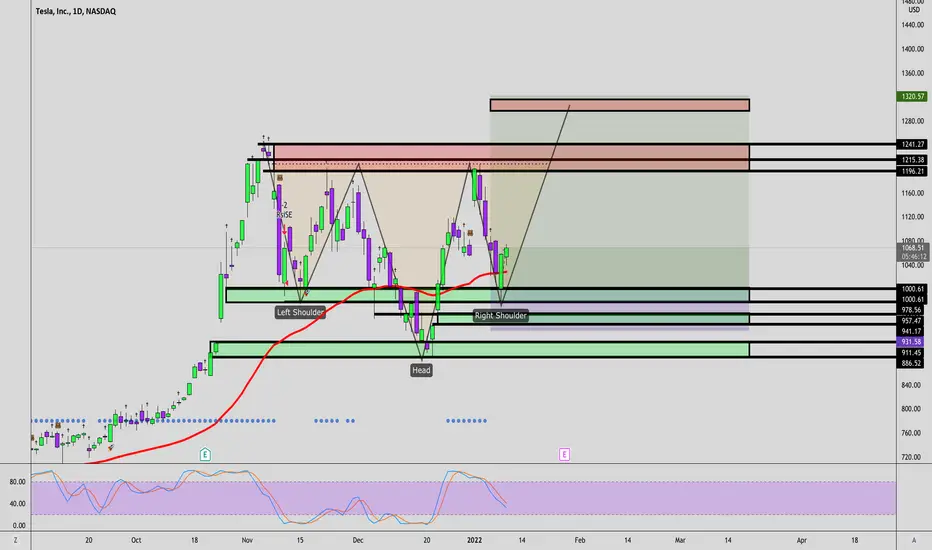
$TSLA - Bullish Inverse Head & ShoulderChart is setting up for a major breakout with a clear Inverse Head & Shoulder pattern. This is a Bullish Pattern. Great buying opportunity.

$TSLA on the top end of the down channel; will it rip or dip?This one is a wild card folks. Strong support in the 1060s, but shorts have been ruthless, along with low volume I am surprised this hasnt dropped more; which is a good sign to me. I do see this being a 50/50 on the drop next week but with volume intending to come back into stocks, and tax loss harvesting season over I got a good feeling about this. Finally TSLA China numbers should be released in the next day or two, which is a big factor in the stocks price movement especially with the recent recalls. As with most tech, this will most likely correct again in March with tapering ending, and rates rising.
NFA.

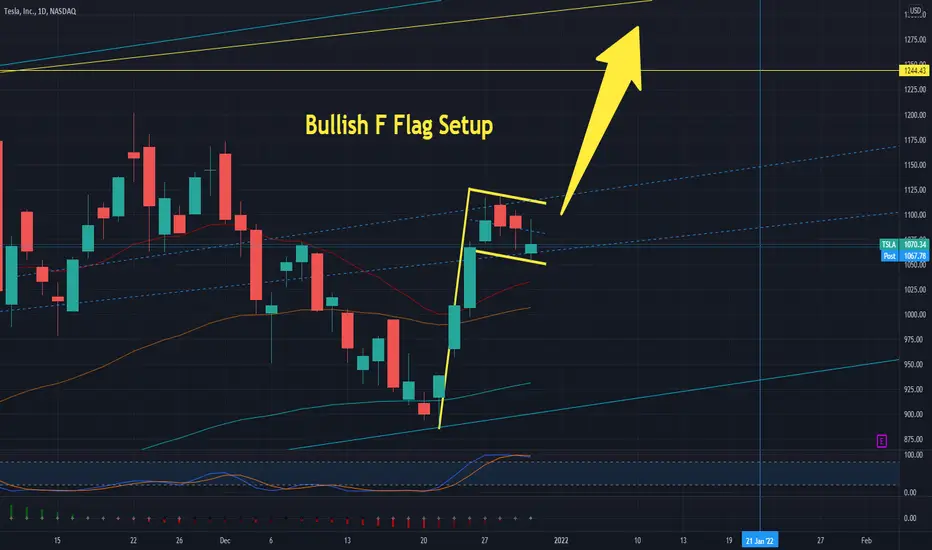
$TSLA - Bullish F FlagChart is showing a bullish F Flag setting up, great buy point at lower flag for a breakout.
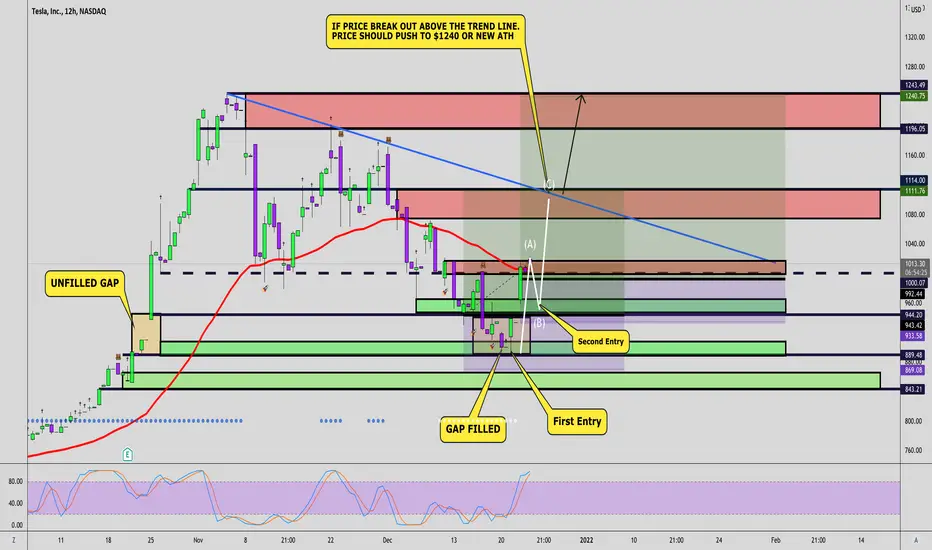
TSLA (TESLA) LONG SET UP (UPDATE)TSLA TRADE UPDATE
Our Tesla Gap fill entry has hit Take Profit 1 for 680 pips
We might get a pullback to $950 before hitting take profit 2 at $1090
I plan to add a second entry if we get a pullback to $950 before Take Profit 2
BUY TSLA at $932.00 ACTIVE ENTRY
Take Profit 1- $1000.00 (Target 1 Reached)
Take Profit 2- $1090.00
Take Profit 3- $1190.00
Take Profit 4- $1243.00
Support: $1000.00-$980.00-/ $940.50-$930.00/ $909.00/$860.00/ $830.00 / $780.00-$780.00
Resistance: $1078.00/ $1115.00/ $1196.00/ $1245.00
TSLAHello. Due to the negative divergence in the weekly time frame and the formation of the weekly candle, it is predicted that the correction will continue
