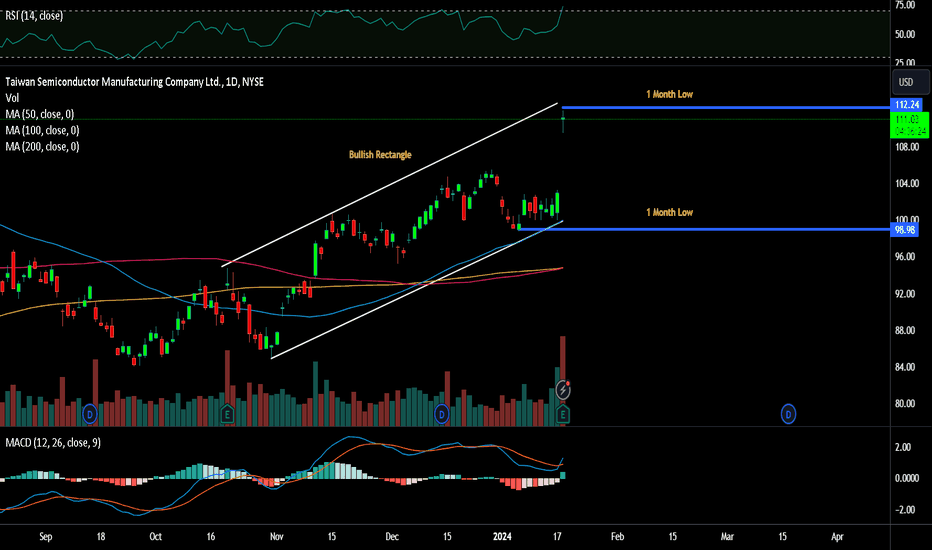
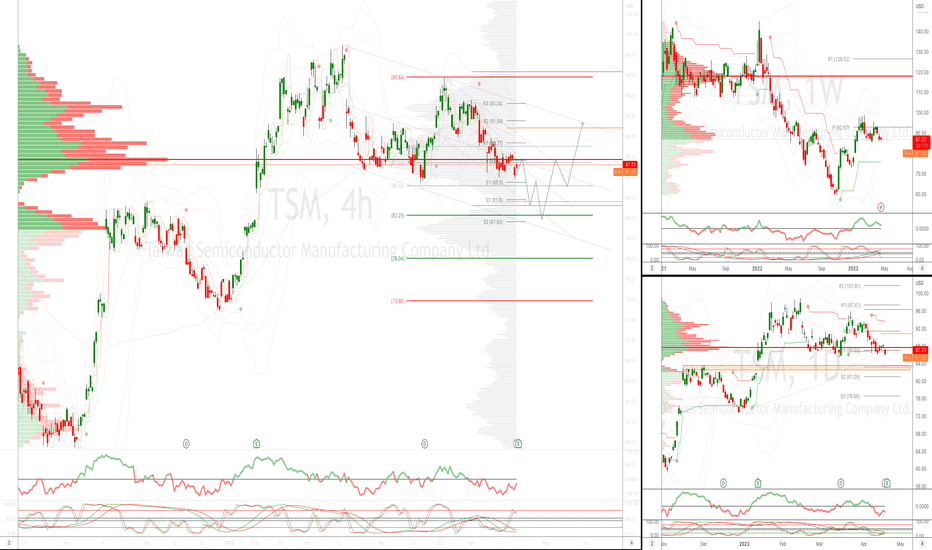
TSMC's Strategic Moves and Strong Earnings Fuel Bullish OutlookTaiwan Semiconductor (NYSE: NYSE:TSM ) has recently reported impressive fourth-quarter earnings, surpassing analyst expectations with an EPS of $1.44, beating estimates by $0.06. Additionally, the company's revenue for the quarter came in at $19.62 billion, slightly edging past the consensus estimate of $19.61 billion. This stellar performance, combined with the announcement of a new chipmaking plant in Japan, positions BCBA:TSMC as a compelling investment opportunity. We will delve into the key factors contributing to TSMC's positive outlook, including its financial success, global expansion strategy, and the significance of its upcoming facility in Japan.
I. Financial Performance:
TSMC's robust financial performance in the past quarter reflects its resilience and adaptability in a challenging global landscape. With positive earnings surprises and consistent revenue growth, the company has demonstrated its ability to navigate through geopolitical tensions and industry challenges. Investors are likely to be drawn to TSMC's strong fundamentals, making it an appealing choice in the ever-evolving semiconductor market.
II. Global Expansion Strategy:
The announcement of TSMC's new chipmaking foundry in Japan's Kyushu island signifies a strategic move to diversify its manufacturing footprint. Chairman Mark Liu emphasized the importance of meeting customer needs and securing government subsidies to support global expansion. This forward-thinking strategy not only bolsters TSMC's presence in the Japanese market but also positions the company to tap into government initiatives aimed at boosting domestic semiconductor production. As TSMC continues to evaluate the potential for a second plant in Kumamoto, Japan, it showcases the company's commitment to collaborating with governments and adapting to the evolving dynamics of the semiconductor industry.
III. Rising Stock Trends:
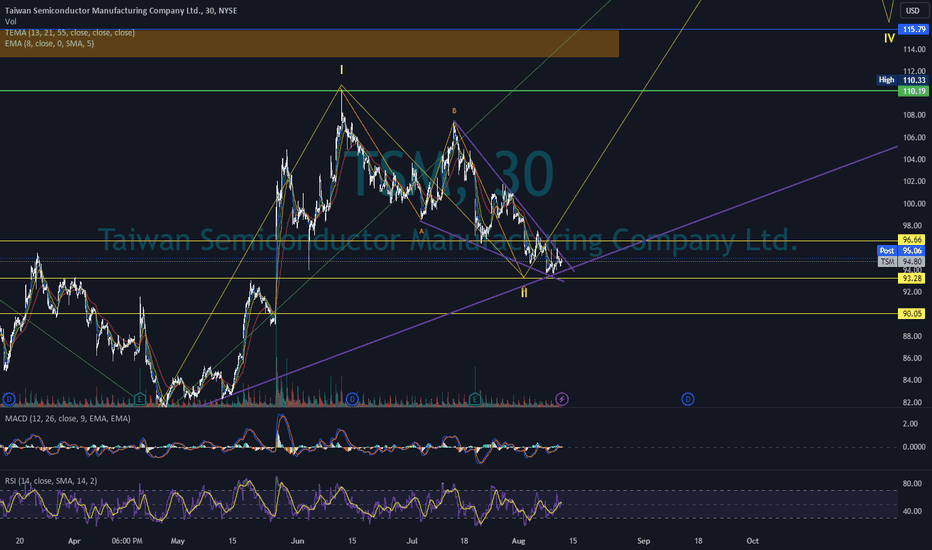
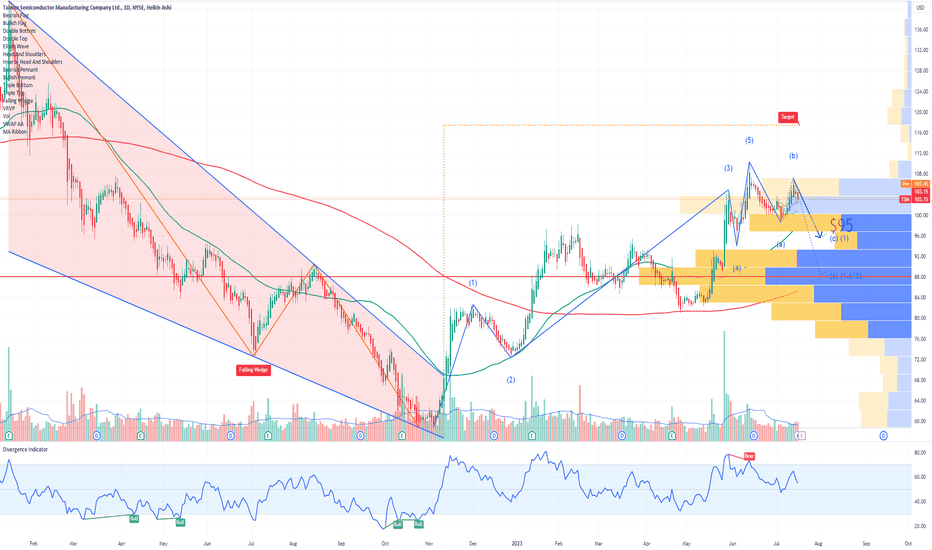
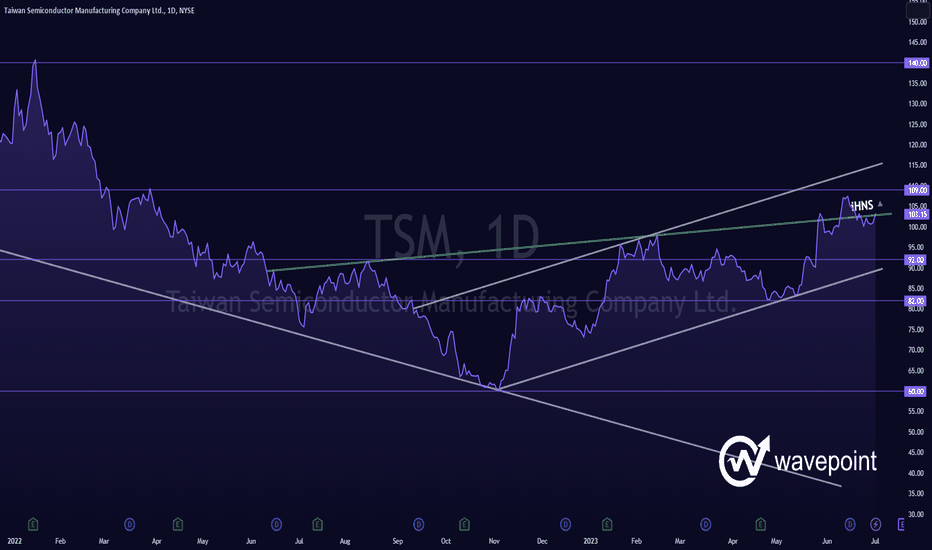
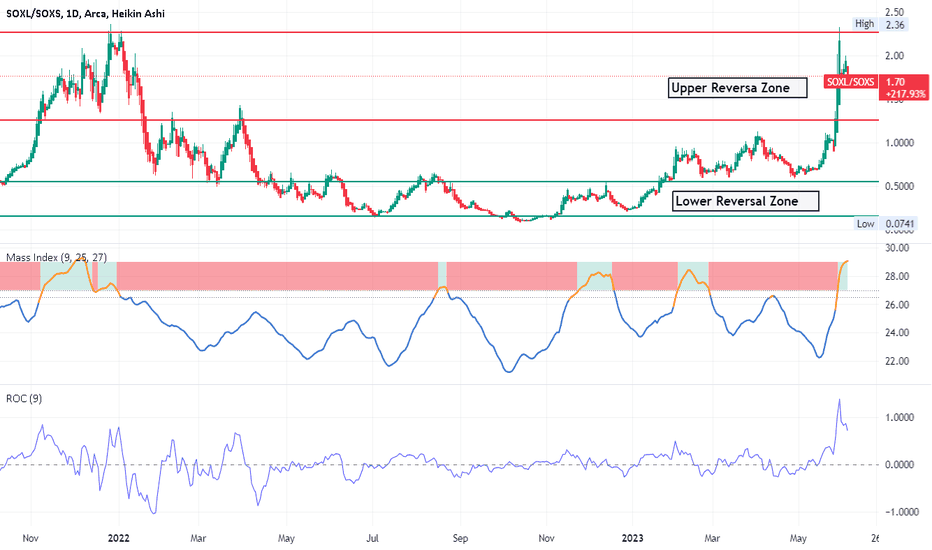
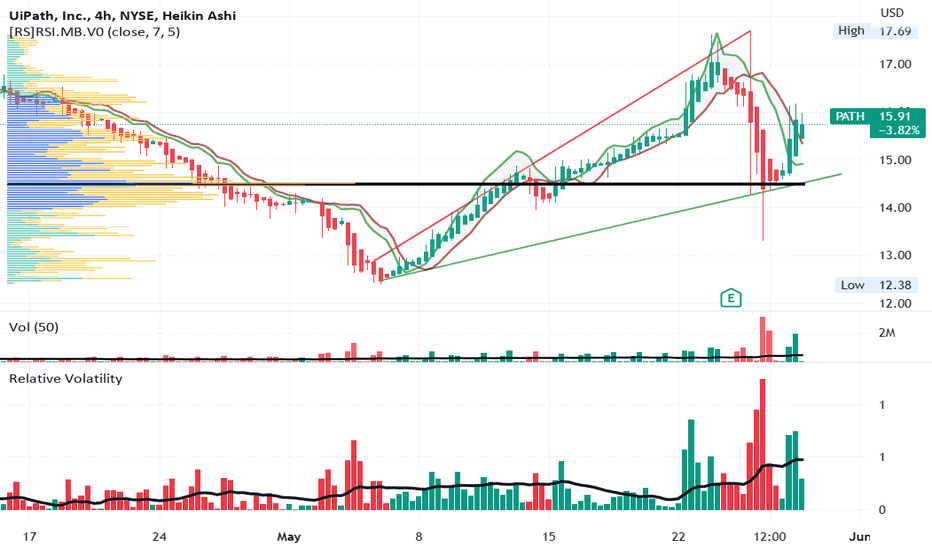
From a technical perspective, TSMC's stock is currently in a rising trend channel, indicating positive development and increasing buy interest among investors. The continued positive signal from the inverse head and shoulders formation hints at a sustained upward trajectory.
IV. Geopolitical Considerations:
TSMC's ability to navigate geopolitical challenges, particularly those between the United States and China, showcases its resilience and adaptability. The company's expansion into Japan aligns with a broader trend of decentralizing semiconductor production to mitigate risks associated with global geopolitical tensions. By strategically diversifying its manufacturing locations, TSMC aims to build trust among customers, fuel future growth, and attract global talent.
Conclusion:
Taiwan Semiconductor's recent financial success, global expansion strategy, and positive stock trends position it as a compelling investment option. The company's ability to navigate geopolitical challenges, coupled with its commitment to meeting customer needs and exploring government partnerships, underscores its long-term vision for sustained growth. As BCBA:TSMC continues to innovate and adapt to industry dynamics, investors may find it to be an attractive addition to their portfolios in the dynamic world of semiconductor manufacturing.
TSM
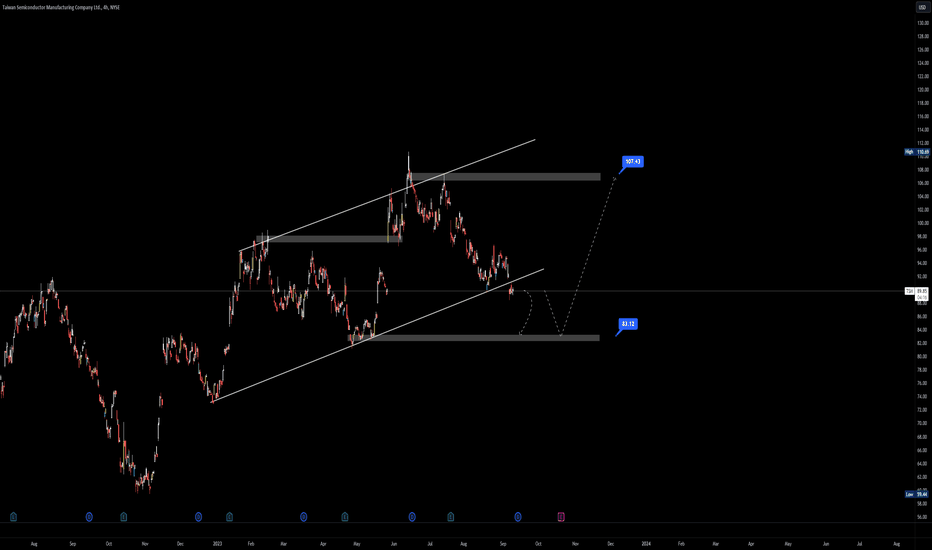
TSM Heading Lower. $80 Target?Been trackin' this for a while so here's the cheat sheet. TLDR; we goin' lower unless some wild earning's get put out. 50 / 200 day EMAs crossed lower and RSI is teetering on the edge. Bounce is possible, but my money is literally on headin' south since that trend line retest failed.
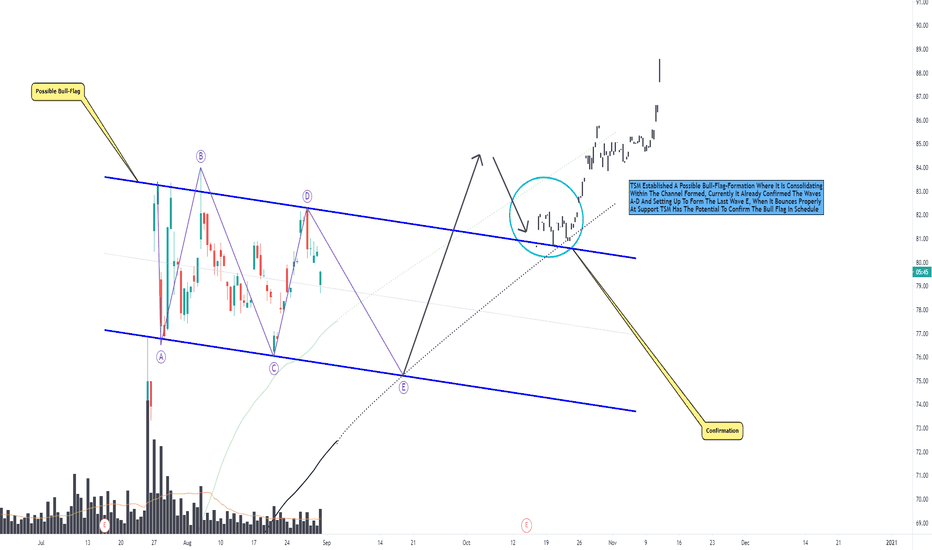
TSM, Possible Flag-Formation, These Scenarios Important To Show!Hello Traders Investors And Community, welcome to this analysis where we are looking at TSM 4-hour timeframe perspective, the recent events, the current formational structure, how possible confirmations can look like and what to expect the next times. The global stock market is approaching higher and recovered on the surface from the massive corona breakdowns seen this year as many retailers rushing into the market and smart money staying out it is important to look for stocks which have the potential to growth as there are many which arent and looking rather bearish than forming solid bullish formations. In this case, I detected the importances within TSM which can show up with some good possibilities, therefore it is important to confirm some meaningful levels in order to approach further in destiny.
Looking at my chart you can watch that TSM is trading within this huge channel formation marked in blue where the price already touched the upper and lower boundary several times to form this possible bull-flag, furthermore the price formed a overall wave-count where the wave A-D already formed and now setting up to form the final wave E in the structure. When the stock manages to do this and confirms the underlying support cluster at the lower boundary coming together with the 100-EMA marked in black there is some good possibility to bounce and confirm the bull-flag-formation properly. This will happen when the price crosses above the upper boundary with a protracted strong volatile bullish move, what will also be good is when the price pulls back to the upper boundary and confirms it as support.
Overall the stock has some solid potentials to confirm the bull-flag appropriately on the other side when the stock does not manages to hold the support and falls below it this will increase bearish pressure to the downside when the stock closes below the EMAs and lower boundary, nevertheless this is not the most likely scenario currently, the bullish confirmation is much more expected. This can be traded either aggressively with immediate entry or conservative with entry after confirmation, although the immediate entry is also possible here the conservative entry will be much better as it is confirming to a solid risk-reward in the structure. Targets will be firstly at around the 88.5 level, when the stock approaches this level it has to be elevated if it continues further or sets up to form a pull-back as supply entering, as there are still higher targets possible the bullish continuation can be taken seriously in consideration.
In this manner, thank you for watching, support for more market insight, all the best!
"If you have the conditions, you get the results."
Information provided is only educational and should not be used to take action in the markets.
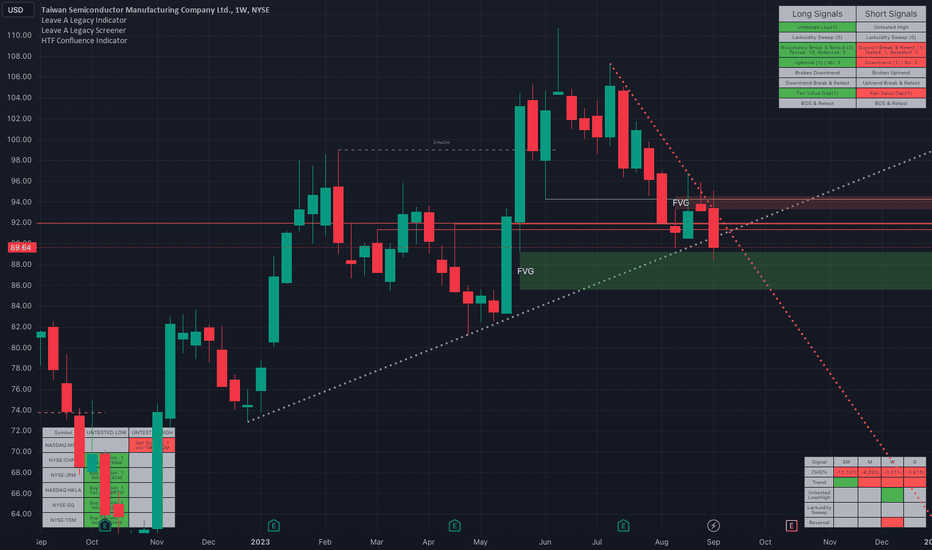
$TSM Weekly Long SwingNYSE:TSM is showing the following bullish signals in the Leave A Legacy Indicator:
Test of an uptrend created from the low of Dec. 2022 and April 2023
Reached fair value gap created throughout May
Break & Retest of high ($91.88) from April.
Swept buy side liquidity from the week of Aug. 14 (Untested Low $89.56)
CONTACT ME FOR ACCESS TO THE INDICATOR/SCREENER
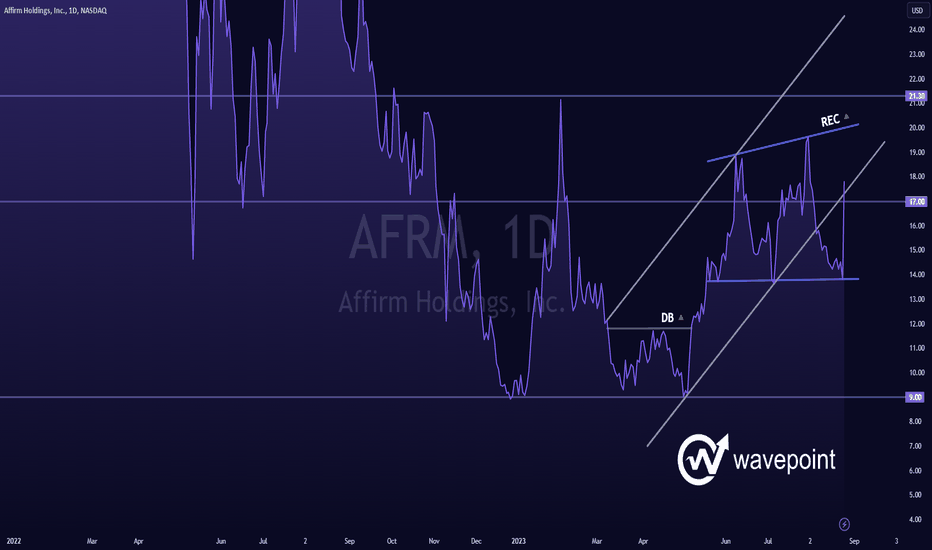
AFRM - Rising Trend Channel [MID-TERM]🔹Breakdown support of rising trend channel in the medium long term.
🔹Support at 13.81 and Resistance at 19.99 in Rectangle formation
🔹Slightly risen above the resistance level of 17.
🔹Technically POSITIVE for the medium long term.
Chart Pattern:
🔹DT - Double Top | BEARISH | 🔴
🔹DB - Double Bottom | BULLISH | 🟢
🔹HNS - Head & Shoulder | BEARISH | 🔴
🔹REC - Rectangle | 🔵
🔹iHNS - inverse head & Shoulder | BULLISH | 🟢
Verify it first and believe later.
WavePoint ❤️
TSM is bottoming here with this wedgeWith this wedge forming with TSM and this trendline as support I think this could be a monster trade. I'm targeting 135 for Wave 3, 115 for Wave 4, and then around 160 for Wave 5.
Some people think this could fill the gap but I don't think so. If you look at TSM and Tesla they look very similar and Tesla didn't fill the gap and stopped halfway just like TSM will do. If it does fill the gap then it would break to the downside of the trendline and then it wouldn't be good.
AMD - Greed Doth Bad Habits BreedI've noticed that, especially in the last week, the trading community has really transformed into almost full bore greed. People are buying highs on almost anything, especially some of the most dubious of stocks, and getting rewarded with 5-15% gains every day.
There's even a popular post on here that asks "As new highs approach, what is the bear case?"
Whenever the climate is like this, you really, really have to take a step back and cool your head.
If we were in a sustained bull market like we had in 2021, greed may ostensibly be fair enough. But when the Fed rate is at 5.5 percent and there aren't going to be cuts, with 6% enroute before year end, and TBond yields acting like they want to court with 4.5% or 5%, you're sort of in the Twilight Zone right now.
If repricing to the downside really does occur, it's going to be fast and sudden.
AMD is the company that floundered, and hard, after losing the arms race to Intel for a lot of years. Then it hired a Chinese CEO, who flew over to the Chinese Communist Party's land and did some courtship, and then all of a sudden AMD was worth a lot of money, and has been for a while.
You have to really be very careful with anything connected to the CCP and China because of the geopolitical tensions between Xi Jinping and the International Rules Based Order.
All the yammering about "Taiwan" is about the IRBO looking to plant a man from Taiwan in Xi's seat when the CCP falls in the exceptionally near term future.
Yet Xi, a Chinese nationalist, can defend China's 5,000 year old Divinely-imparted culture, and himself, by weaponizing the 24-year persecution and organ harvesting genocide against Falun Gong that was launched by the Party and former Chairman Jiang Zemin on July 20, 1999.
If any of the above really transpires, please use your head: Beijing's noon is New York's midnight. Whatever happens in China is going to happen outside of NYSE/Nasdaq hours, which means those enchanted by greed are one day going to enjoy the bitter fruit of a brutal breakaway gap that never comes back.
So, AMD earnings are tomorrow post market. This is notable, because despite all the bull fever and delirium, I note that we really might be watching the markets top right now:
SPX - The Sound of a Shattering Iceberg
And if you take a look at a number of stock market calls I link below, you'll see there's a number of warning signals that are really worth considering, but still some pretty nice long opportunities.
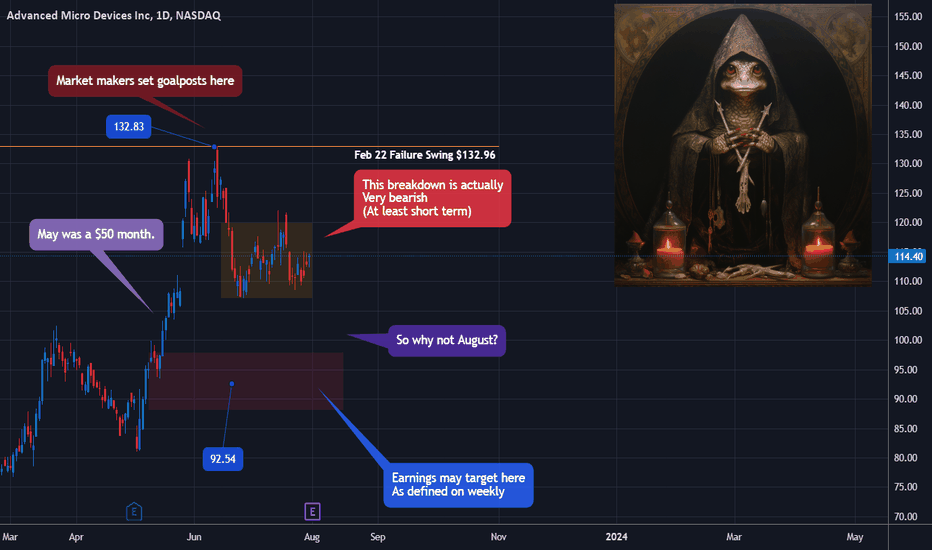
So with AMD, what I'd like to point out as we head into earnings are two things:
1. The market makers left a goalpost at $133, based on the monthly. Price action absolutely does not have to take this point out, but since it counts as "resistance" to retail traders, it stands to reason it will go at some point
2. Price action since the late-June dump is NOT bullish. It is a classic markdown-and-sell-a-lot-more pattern that traps all the people who bought over $120 and have been comfortably numb averaging down.
On weekly charts, the red box is a place that price action is likely to return to, and the catalyst for this may very well be earnings.
There's really a precedent for this, with Taiwan Semiconductor, which I think is a very high likelihood long-term long even as markets sell off, because it's not a member of the Nasdaq or the SPX:
TSM - Taiwan, Your Semiconductor Long Hedge
An important thing to note about TSM is that it's a very similar set up to AMD, but also a lot more bullish of a pattern, and yet it lost some 7% on earnings.
Earnings plays are very hard because the fundamentals don't matter. You get major gap repricing and have to pay a high premium for leverage or for puts/calls to boot.
Yet, a dump under $100 for AMD would likely be a real buying opportunity with a target over $135.
While you might find it too good to be true, May was already a $50/65% month for AMD.
Yet nobody wants to buy when there's big red. Instead, they want to buy on green and HODL, because you've been so perfectly conditioned, Pavloved, and trained by smart money.
Alternatively, if earnings were to raid $135, it may very well be the sell of the year.
Good luck. With the situation as it is, you should always ask yourself: "Are we really going to set new highs, or are we at the top of a bear market rally?"
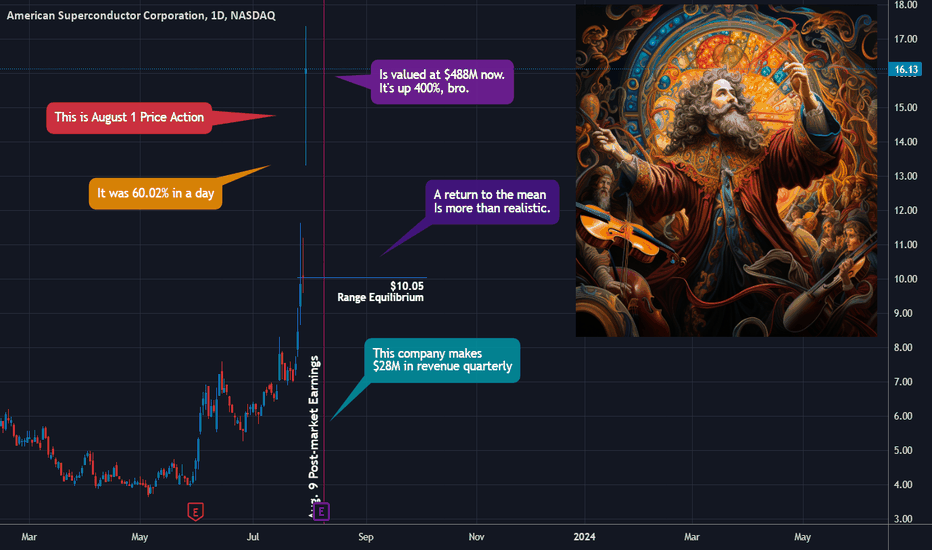
American Superconductor - Floating Crystals, Floating CandlesThe new rage on financial social media is that a new room temperature superconductor has been discovered, and appears to be replicable in labs.
This is significant because superconductors normally have to be either really hot or really cold during their operations.
So, AMSC has Superconductor in its name and is naturally pumping, and has been since May.
The biggest pump was August 1 at 60%, spurred on my a lot of social media chatter, especially in Korean and Chinese.
Greed in the markets is already at extremes, people are convinced new all time highs on indexes are as good as in the bank, and it's very dangerous.
Moreover, you're dealing with hidden geopolitical risks from a Chinese Communist Party being on the edge of collapse that's guilty of the 24-year-long persecution and organ harvesting genocide of Falun Dafa meditation's 100 million practitioners.
And people want to long the top on stuff that's already up 400%+.
The world truly is an asylum.
And look at the monthly bar this has produced with people longing a daily range between $14 and $17.
The weekly candle looks more sane, because at least we're on Tuesday, but it still shows that this swing may have already topped.
So, here's the thing about the fundamentals of this kind of trade:
1. The Superconductor discovery right now is a piece of lead apatite crystal that is capable of majority levitation and diamagnetism when placed on a magnetic plate.
2. The crystal has been made by students in a lab using a paper from Korea.
3. It looks like a little piece of graphite/charcoal. Unless you put it on a magnetic plate, it doesn't even float.
4. Let's say the crystal is truly revolutionary, how many years away from it making its way into a sellable product are you?
5. Why would you think American Superconductor Corporation is going to be the one who licenses something disruptive?
6. Wouldn't TSM, Intel, or AMD, or some Elon Musk/Peter Thiel/Sam Altman-type venture be the ones to steal it?
7. The stock has already quadrupled in price
8. At Tuesday's close, the market cap is $488 billion
9. Look at their earnings results: they bring in $25 million in revenue quarterly
10. Next ER is August 9 post-market. Can you maintain a $500 million market cap when they report $20 million in revenue and the CEO tells investors and banks on the conference call that they aren't going to be able to profit from the discovery?
In essence, you're kind of dealing with a real corporation that's being subjected to something of a Bed Bath and Beyond-style pump and dump.
And this is at a time when greed in the markets is already extreme. People are longing the top on things like Palantir and SOFI without second thought and gettin' paid daily.
Yet the United States credit rating was downgraded today after the Treasury said it wanted to issue another $1.8 trillion worth of debt, and now the Nasdaq and the SPX are gap down on Wednesday futures open.
I discuss this here:
SPX - The Sound of a Shattering Iceberg
I actually think there's a long trade on ASMC over $20 before the hypenstein is over.
But if you don't see it manifest at market open Wednesday and prices lower than $13.31 are traded as the indexes drive a lot of things down, you're probably going back to $10 first, which is just horrific for top longers.
Take a look at the five minute chart.
Tuesday market close was either a big buy or 45 minutes before market close was a big short.
You have to decide for yourself. But sell the news, man, is really a piece of wisdom.
After all, implied volatility is so high that an August 18 at the money call is $4.10, on a $16 stock.
That's a lot of premium and the options sellers just absolutely love your exit liquidity.
TSM Taiwan Semiconductor Options Ahead of EarningsAnalyzing the options chain of TSM Taiwan Semiconductor Manufacturing Company Limited prior to the earnings report this week,
I would consider purchasing the 95usd strike price Puts with
an expiration date of 2024-1-19,
for a premium of approximately $4.70.
If these options prove to be profitable prior to the earnings release, I would sell at least half of them.
Looking forward to read your opinion about it.
TSM - Rising Trend Channel [MID -TERM]🔹Breakout the ceiling of falling trend channel in the medium long term.
🔹Breakout resistance at 103 in inverse head and shoulders formation.
🔹Supports at 92 in negative reaction.
🔹Technically POSITIVE for the medium long term.
Chart Pattern;
🔹DT - Double Top | BEARISH | 🔴
🔹DB - Double Bottom | BULLISH | 🟢
🔹HNS - Head & Shoulder | BEARISH | 🔴
🔹REC - Rectangle | 🔵
🔹iHNS - inverse head & Shoulder | BULLISH | 🟢
Verify it first and believe later.
WavePoint ❤️
Short Semiconductors by Trading SOXS LongThis chart shows the long-term ratio between SOXL/SOXS. The intent is to detect reversals
between semi-conductors long and short. At the pivot high, the price of SOXL compared with
SOXS is at its highest. With a retreat from the pivot high, the price of SOXL is retreating while
SOXS is rising. Historically in 2022 as shown on the chart, pivots were with a ratio of 1,25 to
2,35 while the low pivots were with a ratio of 0.2 to 0.6.
At present SOXL has run up and over-extended as part of the AI breakout phenomenon. The
ratio of 1.8 is in the reversal zone where SOXL price is dropping while SOXS price begins
a significant rise. At present, the mass index is above 27 and awaiting a drop below 26.5.
The second indicator rate of change (ROC) detects spikes in the SOXL /SOXS ratio presumptive
for a pivot. The last time SOXS ran up over a long term ( with SOXL turning down)
was August to October when price increased from $33 to $88 representing a 266% rise.
I see this as a prior supertrend that could now be repeated again.
In conclusion, this idea leads me to take a swing long position is SOXS which I expect to
trend up over a period of a couple of months or more.
PATH - Rising Volume Lifts PricesOn the 4H chart PATH was on a trend down in April. The strength momentum ( green band) was
in a narrow range. In May as can be seen on the indicators, both volume and more especially
volatility have increased significantly. The chart pattern is now that of an upward facing
megaphone reflecting the volatility. The strength momentum band is much wider. Price
is above the POC line of the volume profile reflecting a bullish dominance. Fundamentally,
PATH is a player is the exploding AI subsector. Cathie Wood is quietly accumulating shares for
her ETFs as are many other large portfolio investors. In summary, PATH appears to be
an excellent long setup. Sitting in the shadows of NVDA, MU, TSM and others whose focus is
hardware, PATH provides software and services it. Its path to hypergrowth and so price
appreciation appears to be abundantly clear.
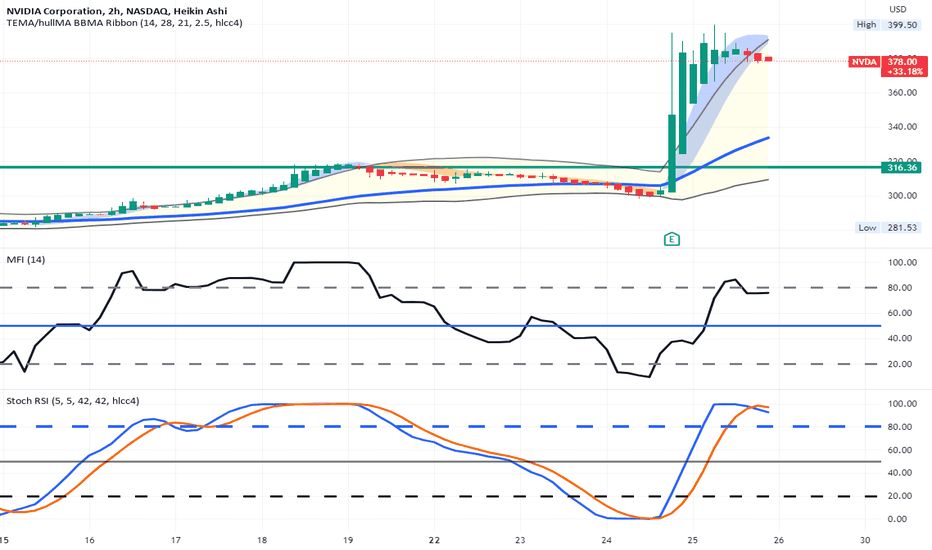
NVDA can it fall from the ceiling after EarningseOn the 2hr chart, NVDA popped from earnings over 20% putting with a PE Ratio sky high
on the promise of semiconductor heaven and AI ecstasy. Can it stay there ? Will it lead
other technology companies ( semiconductors / cloud services / AI et cetera) higher
as well ? Is it now overbought and looking at a glass ceiling? The indictors suggest a near-term
top, I think. ( Money Flow Index. Stochastic RSI ). Accordingly, I will buy put options
striking $ 400 for expiration 7/21 and be quick to take profits expecting NVDA to
equilibrate in less than a week. In th meanwhile, I will hdege by keeping my AMD
and MU call options open figuring that they will jump up as copy cats of this move.
I will cut them loose as soon as price action and a loss of volume suggest retracement as well.
I see buyers who got in late with high FOMO to be the lad sellers fueling the put options
into easy profit.
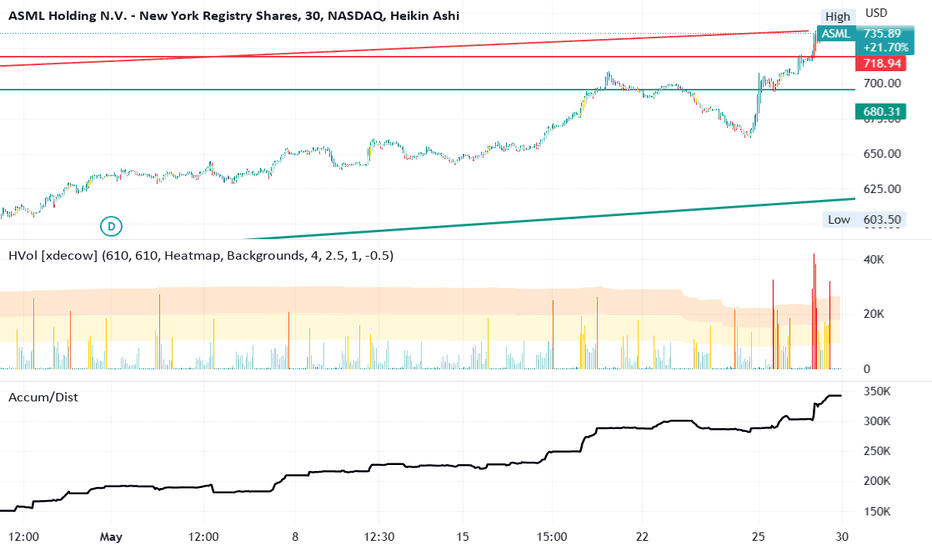
ASML makes the technology that makes semiconductorsASML is shown here on the one-hour chart as having a great quarter with consecutive favorable
earnings It has moved above the blue volume trading range on the profile. The accumulation
distribution indicator shows persistent and high accumulation. The volume heat map shows
recent heat volume spikes. Since ASML has products essential to chip- manufacturing and is the
leader in its field it is very well positioned for the AI boom that is underway according to all
the chatter. ASML is one of the IBD Top 50 tech stocks. If the chart is zoomed out, there is a
rising wedge which might be a bit of bearish bias. Overall, I see this as a long setup worth
buying.
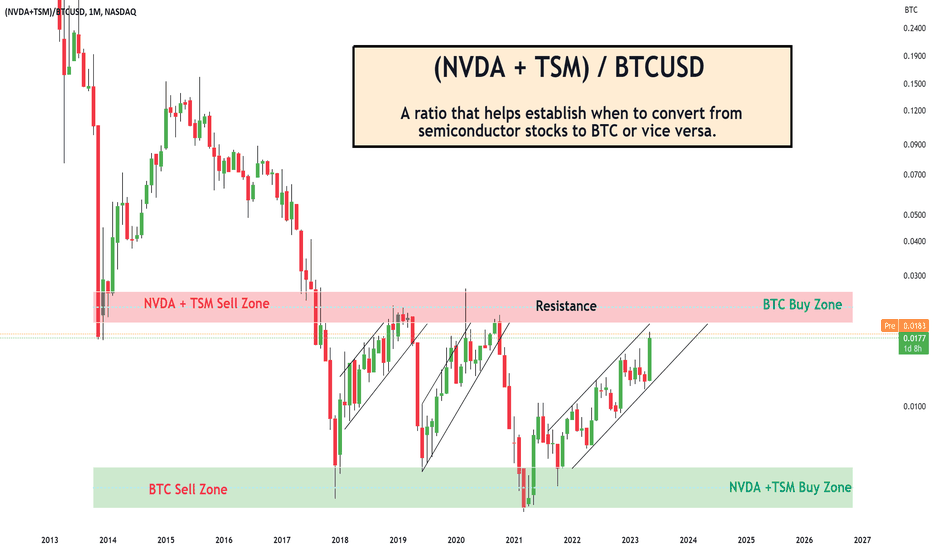
Semiconductors NVIDIA and TSMC Vs BTC Ratio Semiconductors Vs BTC Ratio
- Since Sept 2017 we have been in a range
- The 3 channels are periods Semiconductors(SCRs)
performed better than BTC.
- The red resistance has been a sell indicator for SCRs.
- Exiting the 3 channels also meant sell SCRs.
Within months we are reaching a potential exit point for SCRs with BTC potentially offering better returns once we reach resistance or leave the current channel.
Factoring in yesterdays tweet regarding TSM, the next 3 - 6 months will be pertinent for SCRs and will likely provide a final upward thrust and an exit opportunity. It is possible that we break the resistance on the chart however this has not happened since Sept 2017 and may not happen. If it does we can reenter on a retest of the resistance turned support. I would still sell having enter the resistance.
This chart gives us another metric to watch for the SCR and BTC trade simultaneously. With AI making news lately the AI driven sentiment could offer the final thrust and exit position opportunity we are looking for for NVDA & TSM. Given NVDA has has such an epic move and factoring in that TSM appears to be signaling that its now its turn to rise (yesterdays tweet), my positioning would be into TSM. Furthermore, anyone wanting to diversify an AI holding, may sell NVDA into TSM. We shall see. A fascinating sequence of events that we can observe and trade off over the next 3 - 6 months.
PUKA
Is it Taiwan Semiconductor Manufacturing Co's turn now? NVIDIA vs TSM
The Chart for NYSE:TSM is lining up almost identically to NVIDIA prior to its major move higher.
- MACD Crossing now
- OBV Breaking upwards
- RSI 56 level about to be breached
Like NASDAQ:NVDA , TSM could rise by 39% to its ATH & appears to be following the NASDAQ:NVDA set up.
NVIDIA is the 6th largest company in the world by market cap at present and Taiwan Semiconductor Manufacturing Co. is the 10th largest.
It will be interesting to see if the TSM chart will follow the pattern of NVIDIA's. This could be an opportunity for a trade. Please not that the below chart is a monthly chart and thus the trade would require waiting 3 - 6 months to play out. An ideal entry would have been $82 and at present this would place a stop at $90. With ATH at $145 this gives you a Risk Reward Ratio of 3:1 from the current value of $103. Not the greatest or worst RR but the set up just looks so similar its hard not to have a stab
TSM - Breakout Falling Trend Channel🔹TSM has broken the ceiling of the falling trend in the medium long term, which indicates a slower initial falling rate.
🔹TSM has broken an inverse head and shoulders formation.
🔹RSI above 70 shows that the stock has strong positive momentum in the short term.
🔹Overall assessed as technically positive for the medium long term.
Chart Pattern;
🔹DT - Double Top | BEARISH | 🔴
🔹DB - Double Bottom | BULLISH | 🟢
🔹HNS - Head & Shoulder | BEARISH | 🔴
🔹REC - Rectangle | 🔵
🔹iHNS - inverse head & Shoulder | BULLISH | 🟢
Verify it first and believe later.
WavePoint ❤️
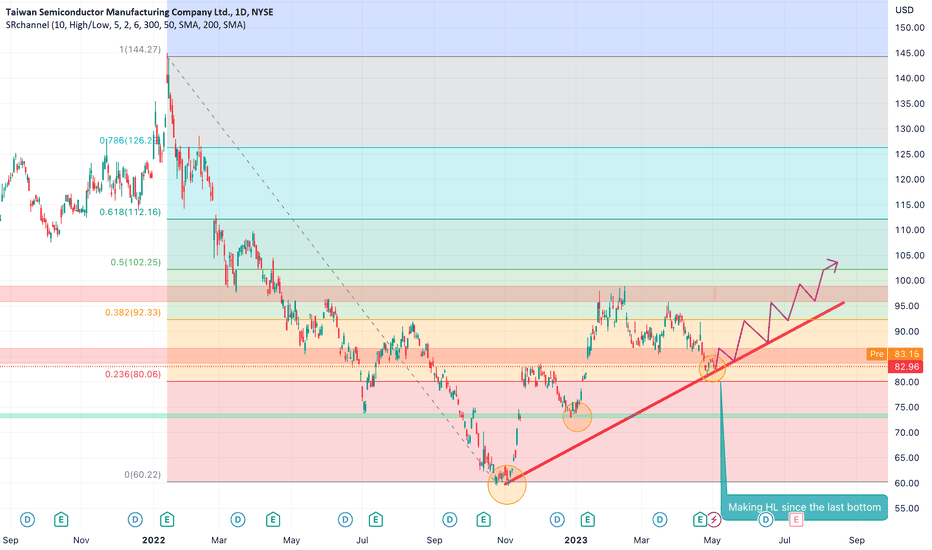
TSM on the path of Bullish Reversal* TSM has bounced back from the last bottom in Oct 22
* It has not made a series of HH and HLs
* Accorrding to the FIB Golden zone the confirmation of bullish reversal is at 102 to 104 Area
Plan A :
Entry Suggestion once the bullish reversal is confirmed
Entry @ 104
SL @ @ 92
TP 1 @ 111
TP2 @ 125
Plan B :
Entry can be made now since the current Trend line has been tested 2 times already successfully and seems it will bounce forward from here
Entry @ CMP (~84)
SL @ 78
TP 1 @ 104
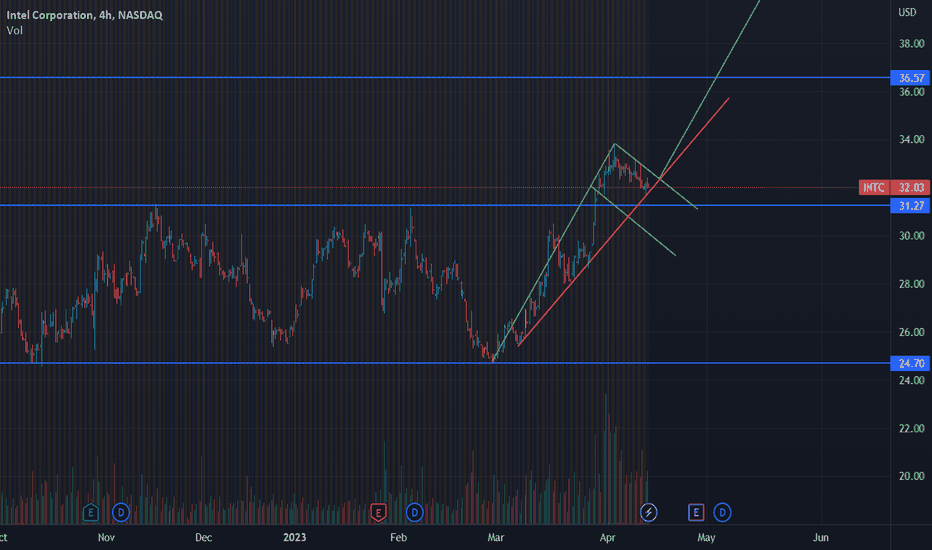
Potential Bull flag and break impending on INTCIntel is a strong blue chip tech stock that could play on my TSM bearishness. If TSM does get demolished Intel will rise. Intel has strong revenue, is in many mutual funds, and is forming a potential bull flag. If I enter this position, it would be with May 19th calls 38 -40$ strike price.
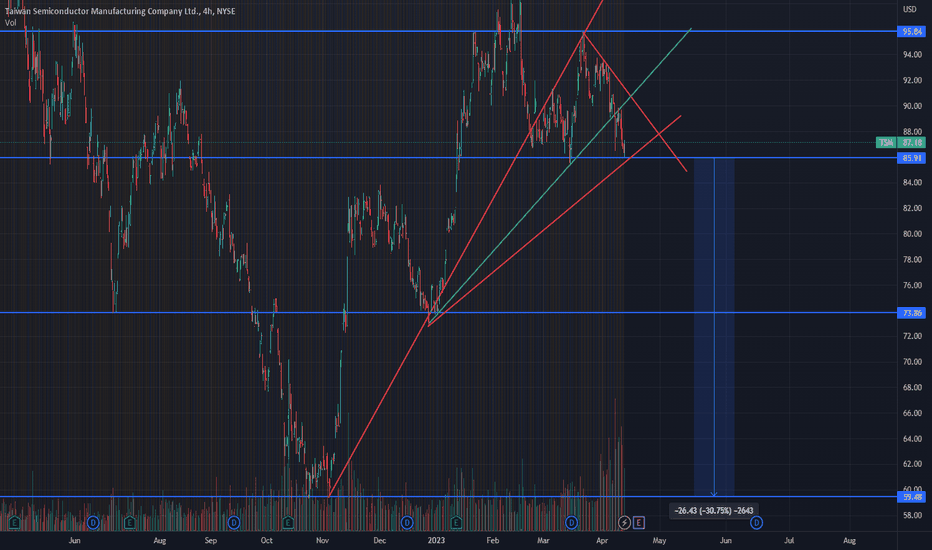
Bullish trend line broken on TSM following Buffet newsThis is a potential put setup with a strike somewhere between 55-70$ that I am currently looking into. If the stock price drops below 85$ I will likely enter some puts on TSM. Between Senator Tuberville loading up with his military affiliations and Warren Buffet selling 86% of his TSM shares recently, I think a big move is coming.
