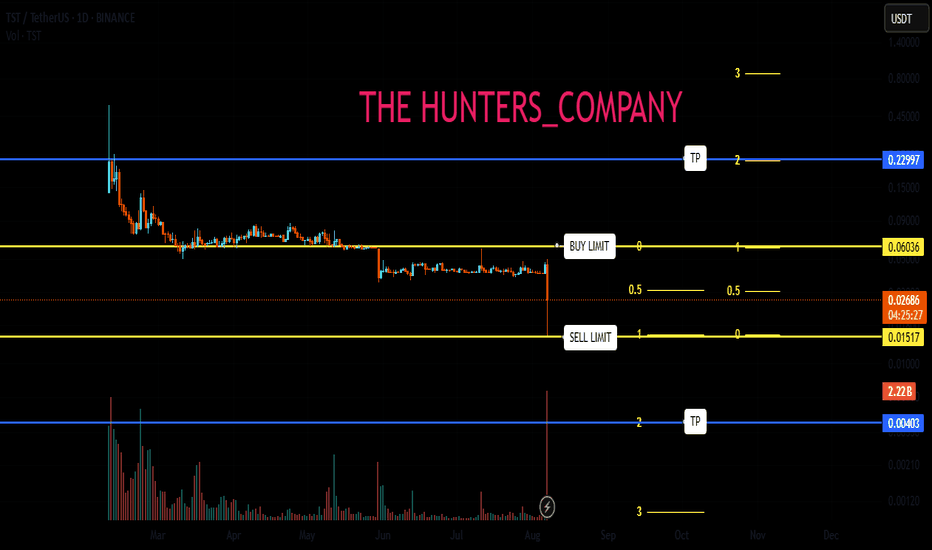
TST : Waiting for the defeat of suffering...Hello friends🙌
✅ considering the large and frequent declines of this currency, we do not take unreasonable risks and have identified the trading range that has formed and are waiting for the range to break.
✅If there is a valid resistance break, you can buy and move with it to the targets specified by Fibonacci.
✅In the event of a continuation of the decline and a valid break of the range from below, you can enter a sell trade and move with it to the targets specified by Fibonacci.
✅Be sure to observe capital management.✅
🔥Follow us for more signals🔥
*Trade safely with us*
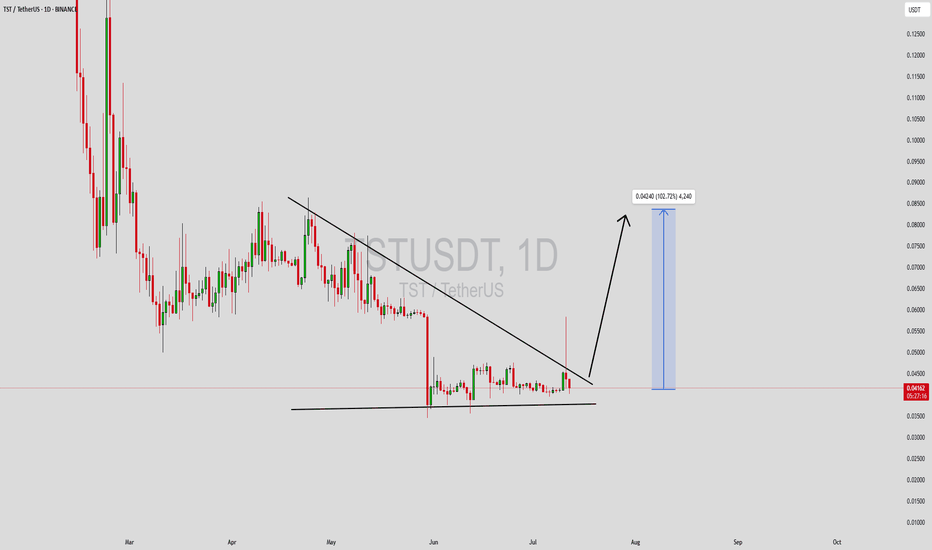
TSTUSDT
TSTUSDT Forming Falling WedgeTSTUSDT is looking increasingly attractive for traders who specialize in breakout patterns, as the pair is currently trading within a classic falling wedge pattern. This bullish reversal setup often signals the end of a downtrend and the start of a strong upward move when confirmed by a breakout above the wedge’s resistance line. The current volume is supportive, showing that buyers are gradually stepping in to accumulate positions, which aligns with the growing interest investors are showing in this project.
From a technical perspective, the falling wedge pattern is one of the most reliable bullish chart patterns in crypto trading. It suggests that downward momentum is weakening and that an explosive move to the upside could be on the horizon. TSTUSDT traders should monitor this pair closely for a decisive breakout candle on higher-than-average volume, as that could be the catalyst for the expected 90% to 100%+ gain. This type of setup can be ideal for both swing traders and position traders looking for a high-probability opportunity.
In addition to the pattern itself, TST’s project fundamentals are attracting positive sentiment in the broader crypto community. With an active development team and a roadmap that continues to deliver updates, confidence in TST’s long-term growth is increasing. As investor interest continues to build, this could provide the momentum needed to sustain the breakout and reach the projected targets.
✅ Show your support by hitting the like button and
✅ Leaving a comment below! (What is You opinion about this Coin)
Your feedback and engagement keep me inspired to share more insightful market analysis with y
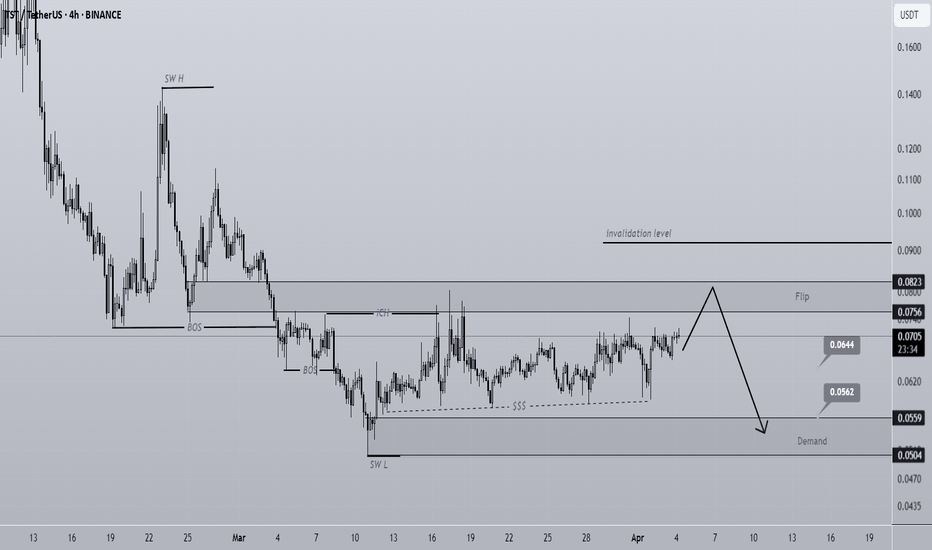
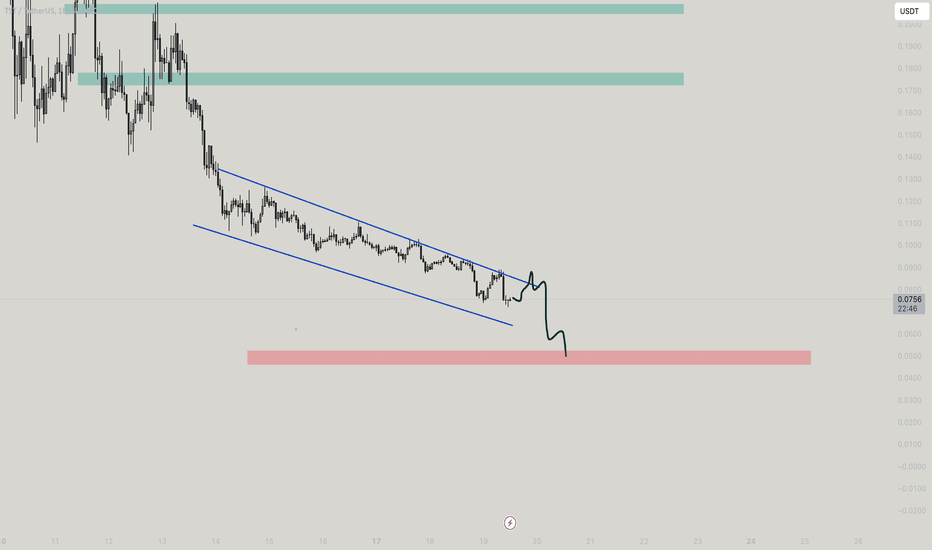
TST Sell/Short Setup (4H)TST has a bearish structure on the higher timeframes.
It is currently in a pullback phase within the substructure.
We are looking for sell/short positions around the flip zone, which acts as a Supply area.
There is a liquidity pool at the bottom of the chart, which is likely the target for a sweep.
A daily candle closing above the invalidation level will invalidate this outlook.
Do not enter the position without capital management and stop setting
Comment if you have any questions
thank you
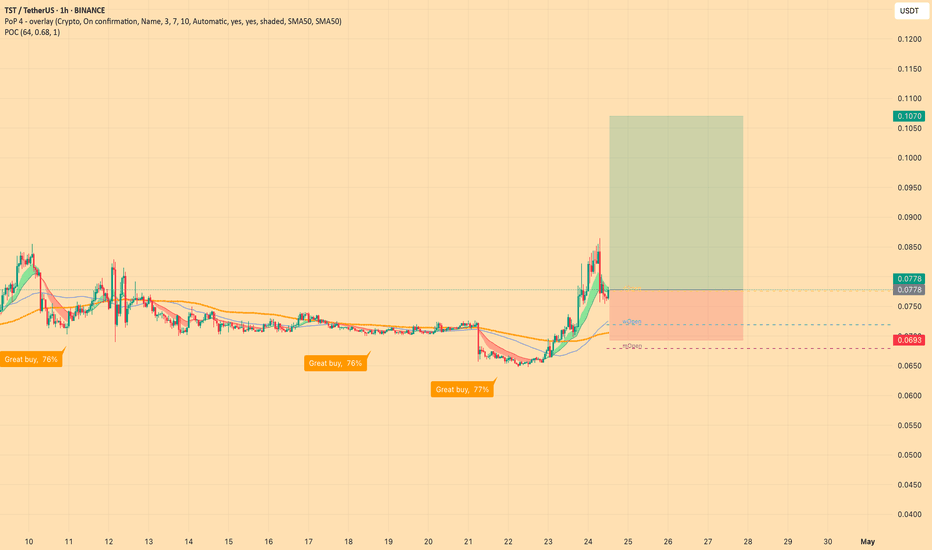
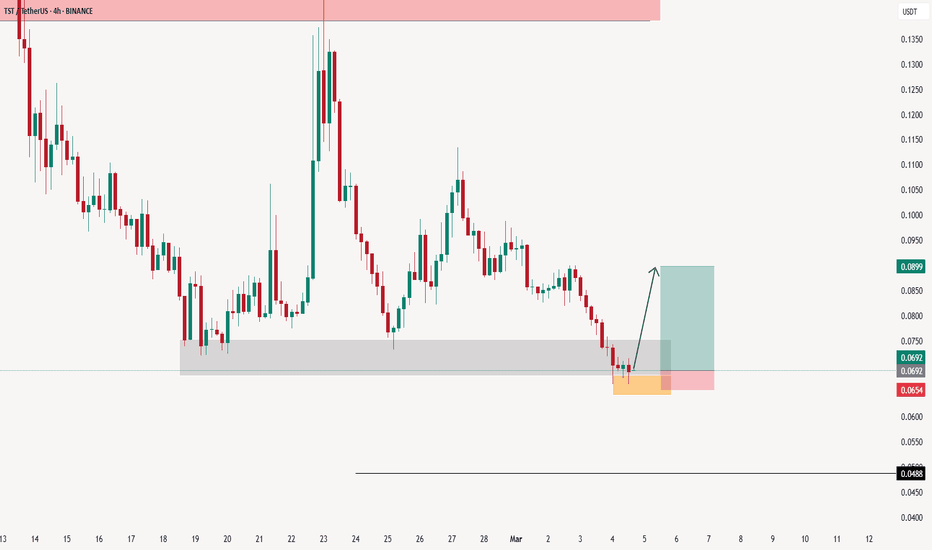
TST COIN NEXT POSSIBLE MOVES AND TRADE IDEAS !!LSE:TST Coin!!
• Technically & Fundamentally its look bullish🫡
• if market get little bit stable then pottential bounce back expected❤️
• if you want then you can build small amount spot trade on it.. Stoploss will be only 0.065$ ( if daily candle close below this level)
• For add it in swing trade.. Its also a good buying price🫡
Warning : That's just my trade idea DYOR Before taking any action🚨
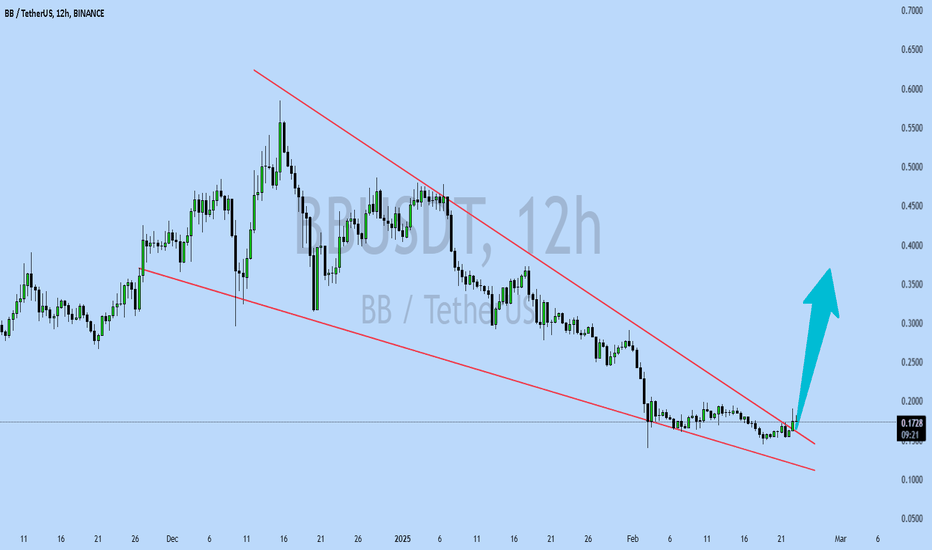
BBUSDT UPDATEBBUSDT is a cryptocurrency trading at $0.1729. Its target price is $0.3500, indicating a potential 100%+ gain. The pattern is a Bullish Falling Wedge, a reversal pattern signaling a trend change. This pattern suggests the downward trend may be ending. A breakout from the wedge could lead to a strong upward move. The Bullish Falling Wedge is a positive signal, indicating a potential price surge. Investors are optimistic about BBUSDT's future performance. The current price may be a buying opportunity. Reaching the target price would result in significant returns. BBUSDT is poised for a potential breakout and substantial gains.
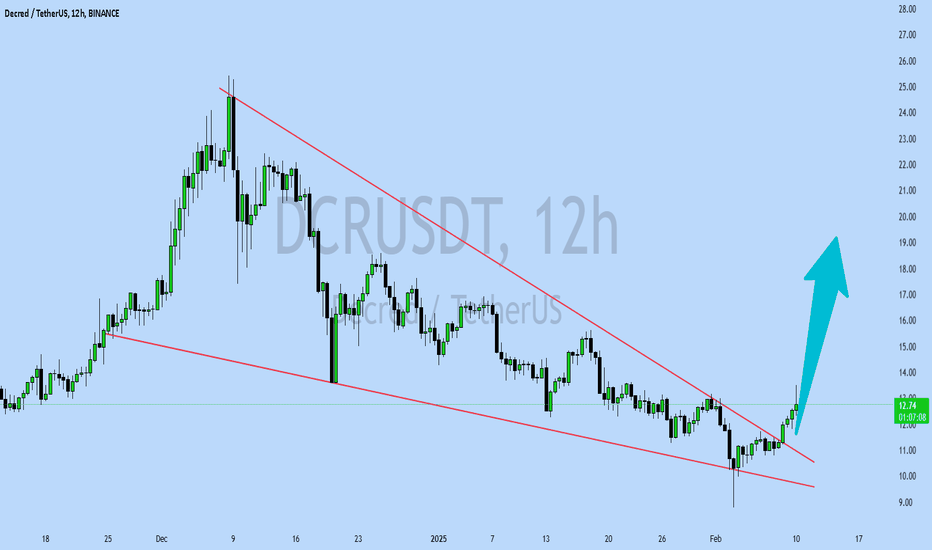
DCRUSDT UPDATEDCRUSDT is a cryptocurrency trading at $12.84. Its target price is $19.00, indicating a potential 50%+ gain. The pattern is a Bullish Falling Wedge, a reversal pattern signaling a trend change. This pattern suggests the downward trend may be ending. A breakout from the wedge could lead to a strong upward move. The Bullish Falling Wedge is a positive signal, indicating a potential price surge. Investors are optimistic about DCRUSDT's future performance. The current price may be a buying opportunity. Reaching the target price would result in significant returns. DCRUSDT is poised for a potential breakout and substantial gains.
