TURBOUSDT Forming Bullish PennantTURBOUSDT is currently exhibiting a bullish pennant pattern on the charts—a continuation setup that often leads to strong upward movement after a period of consolidation. This pattern typically forms after a sharp upward move, followed by a tightening range that resembles a pennant or small symmetrical triangle. The breakout from this structure is generally explosive, especially when backed by strong volume. TURBOUSDT has seen just that—an increase in trading volume that aligns with growing investor confidence.
The technical structure suggests that the recent consolidation phase is nearing its end, and a breakout to the upside could potentially yield a move of 80% to 90% or more. Bullish pennants are powerful indicators of renewed buying interest, and with price coiling near resistance, the odds of a breakout are increasing. Traders are watching this setup closely for confirmation, as a successful breakout could attract further momentum and trigger a new bullish trend leg.
Beyond the technicals, TURBO’s growing presence in the meme and altcoin sectors has captured investor attention. The project has been gaining traction due to its unique branding, active community engagement, and listings on major exchanges. These fundamental strengths further reinforce the bullish outlook from a technical standpoint.
If the breakout confirms with strong volume, this could be one of the top short-term opportunities in the current market. Keep a close eye on the price action in the coming sessions as the pattern nears its apex—TURBOUSDT could soon enter a high-velocity rally phase.
✅ Show your support by hitting the like button and
✅ Leaving a comment below! (What is You opinion about this Coin)
Your feedback and engagement keep me inspired to share more insightful market analysis with you!
TURBOUSDT

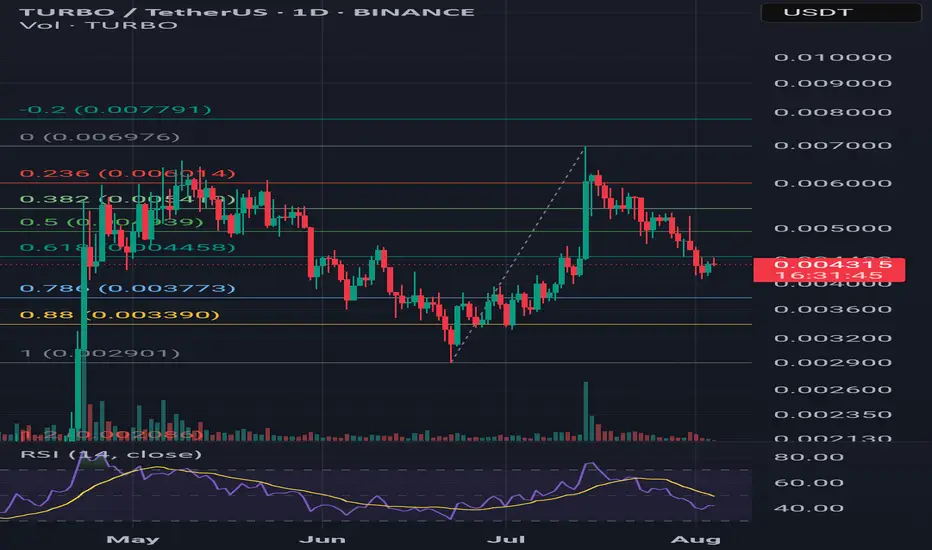
TURBO/USDT – Cup and Handle Formation (1D Chart)Overview:
TURBO/USDT is potentially forming a textbook Cup and Handle pattern on the 1-day chart. Price action suggests a rounded bottom (the “cup”) followed by a consolidation range (the “handle”), setting up for a possible breakout.
---
🔍 Pattern Structure:
- Cup Formation:
Price rallied from ~0.0029 to ~0.0060 USDT, retracing slightly from the top. This rounded rise resembles the classic cup shape.
- Handle Formation:
Recent price consolidation between 0.0042–0.0049 USDT hints at the formation of the handle. A breakout above resistance could validate the pattern.
---
📈 Key Technical Levels:
Entry Zone | 0.0047 – 0.0050 |
| Resistance (Breakout)| ~0.0060 |
| Target 1 | ~0.0064 |
| Target 2 | 0.0078 – 0.0084 |
| Stop Loss | Below 0.0042 |
🔄 Additional Indicators:
- Volume: Watch for increasing volume to confirm breakout momentum.
- RSI (14-day): Neutral zone with room for upward movement. Momentum is building.
- Fibonacci Levels: 0.618 retracement (~0.004458 USDT) has acted as a key support during handle formation.
---
💡 Idea: Monitor for a daily close above 0.0060 with volume confirmation. That could mark the beginning of a bullish continuation. Risk management is essential if price fails to hold above the handle support.
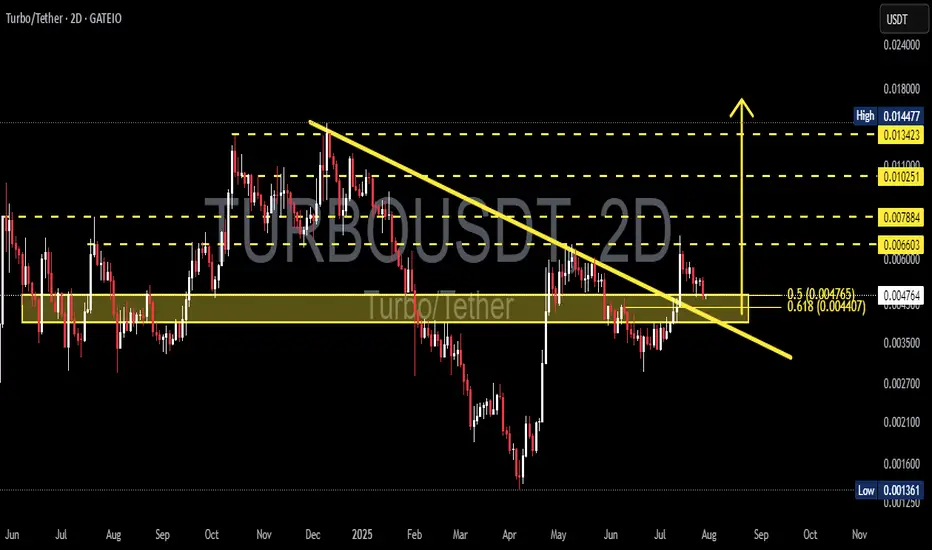
TURBO/USDT: Critical Decision Point – Breakout or Bull Trap?🧩 Overview
TURBO/USDT is currently sitting at a decisive technical juncture. After a prolonged downtrend since its late 2024 peak, the price has recently shown signs of a momentum shift by breaking out from a major descending trendline. The key question now: Is this the beginning of a bullish reversal, or just a temporary fakeout?
---
📉 Pattern Breakdown
Descending Triangle Breakout (Confirmed)
This classical bearish continuation pattern had formed since November 2024 with consistent lower highs. The recent breakout to the upside suggests a shift in market sentiment.
Historical Accumulation Zone (Demand Zone)
The yellow horizontal box (around 0.0042 – 0.0047 USDT) has acted as a strong historical accumulation and reaction area.
Golden Pocket Retest (Fibonacci 0.5 – 0.618)
The price is currently retesting the golden pocket retracement zone, which often acts as a decision zone for institutional buyers and swing traders.
---
📈 Bullish Scenario (Breakout Confirmation)
If the price holds above the golden pocket zone and prints a higher low, we could see:
🎯 Next Bullish Targets:
0.00660 USDT – Minor resistance
0.00788 USDT – Psychological level
0.01025 USDT – Mid-range resistance
0.01342 USDT – Major key level before recent highs
0.01447 USDT – Local high and full breakout target
✅ Bullish Confirmation:
A strong 2D candle close above 0.0066 with rising volume would validate the bullish breakout and signal continuation.
---
📉 Bearish Scenario (Fakeout Risk)
If price fails to hold the 0.0044 – 0.0047 USDT range and breaks back down:
🔻 Bearish Targets:
0.0035 USDT – Previous local support
0.0025 USDT – Old consolidation zone
0.00136 USDT – All-time low (last defense level)
❗️Bearish Confirmation:
A breakdown below 0.0044 USDT with bearish volume would invalidate the breakout and open the door for deeper downside.
---
🧠 Additional Insights
The initial breakout had solid volume, but current price action is testing the breakout validity.
RSI or momentum indicators (not shown here) should be monitored for divergence or confluence with this setup.
---
📌 Conclusion
> TURBO/USDT is at a make-or-break moment. While the breakout from the descending triangle is a strong bullish signal, the retest of the golden pocket zone must hold to confirm the trend reversal. Failure to do so could turn this into a bull trap with deeper downside risk.
⏳ Eyes on this level — market is choosing a direction.
#TURBO #USDT #CryptoAnalysis #BreakoutOrFakeout #TechnicalAnalysis #DescendingTriangle #FibonacciGoldenPocket #BullishScenario #BearishScenario #AltcoinWatch #CryptoTrading
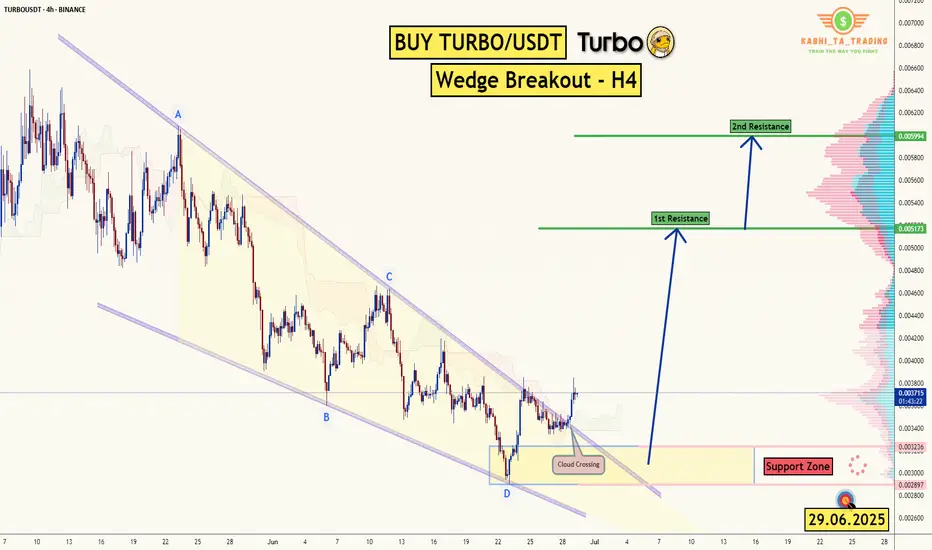
TURBO/USDT - H4 - Wedge Breakout (29.06.2025)The TURBO/USDT pair on the H4 timeframe presents a Potential Buying Opportunity due to a recent Formation of a Wedge Breakout Pattern. This suggests a shift in momentum towards the upside and a higher likelihood of further advances in the coming Days.
Possible Long Trade:
Entry: Consider Entering A Long Position around Trendline Of The Pattern.
Target Levels:
1st Resistance – 0.005173
2nd Resistance – 0.005994
🎁 Please hit the like button and
🎁 Leave a comment to support for My Post !
Your likes and comments are incredibly motivating and will encourage me to share more analysis with you.
Best Regards, KABHI_TA_TRADING
Thank you.
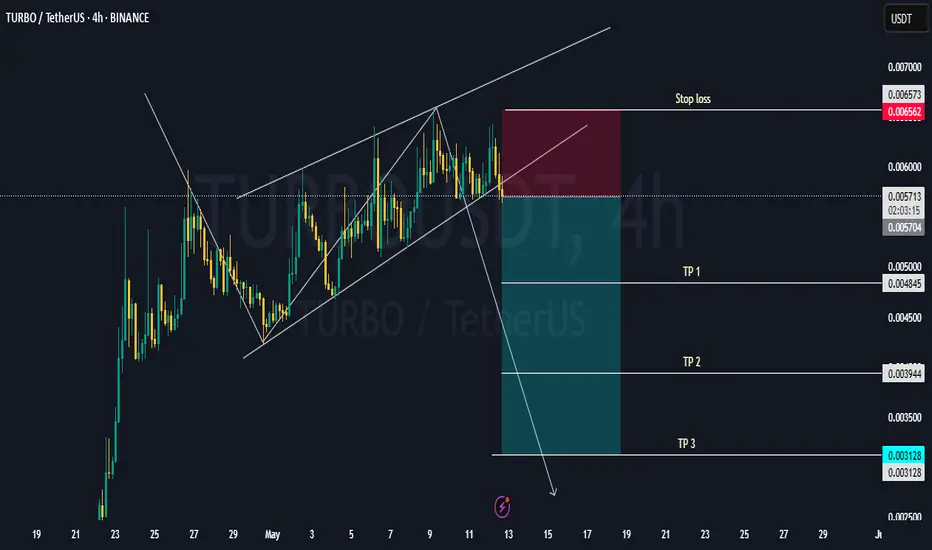
TURBO BEAR FLAG PATTERN - TIME TO SELLSeen here is MYX:TURBO breaking the support trendline and signal a downtrend. You may want to take profit here or pick a short position. For Turbo short,
Entry price: $0.005713
Stop loss: $0.006562
Take profit 1: 0.004845
Take profit 2: 0.003944
Take profit 3: $0.0031
Not a financial advice.
Please support this idea with a LIKE👍 if you find it useful🥳
Happy Trading💰🥳🤗
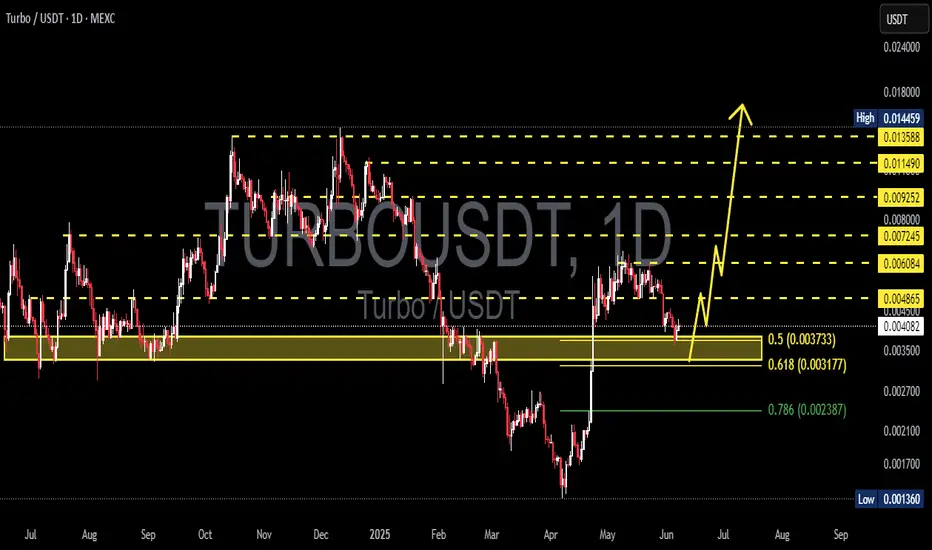
TURBOUSDT 1D AnalysisTURBO ~ 1D Analysis
#TURBO Buy gradually from here if you still have confidence in this coin with a short term target of at least 15%+ from here. Long term target $0.0145
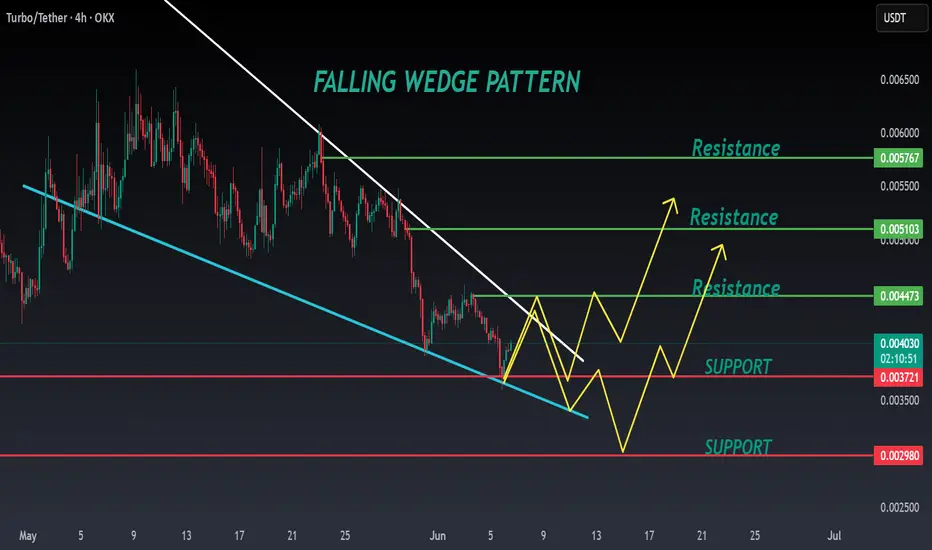
TURBO ANALYSIS📊 #TURBO Analysis
✅There is a formation of Falling Wedge Pattern on daily chart and currently pullback around its major support zone🧐
Pattern signals potential bullish movement incoming after sustain above the major support zone and breaks the pattern with good volume
👀Current Price: $0.004050
🚀 Target Price: $0.004470
⚡️What to do ?
👀Keep an eye on #TURBO price action and volume. We can trade according to the chart and make some profits⚡️⚡️
#TURBO #Cryptocurrency #TechnicalAnalysis #DYOR
Buy in fear, sell in greed.Hello dears
Due to the price growth, now in the pullback you can buy in support areas in steps and move with it to the specified targets, of course with capital management.
*Trade safely with us*
TurboTurbo is cryptocurrency with low volume be careful
Entry price
0.0036
stop loss 0.0009
take profit
0.012
0.031

#TURBO/USDT#TURBO
The price is moving within a descending channel on the 1-hour frame, adhering well to it, and is heading for a strong breakout and retest.
We are seeing a bounce from the lower boundary of the descending channel, which is support at 0.005170.
We have a downtrend on the RSI indicator that is about to be broken and retested, supporting the upward trend.
We are looking for stability above the 100 moving average.
Entry price: 0.005466
First target: 0.005592
Second target: 0.005746
Third target: 0.005962

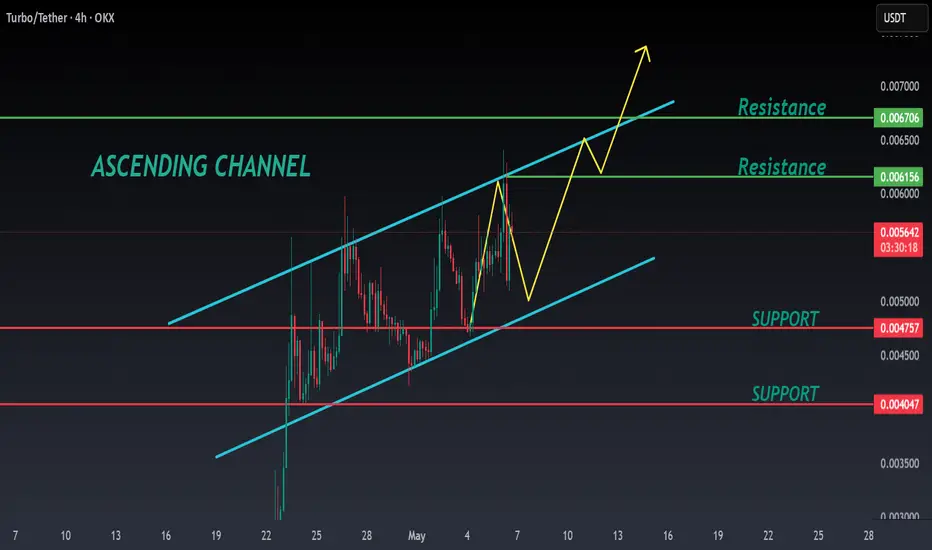
TURBO ANALYSIS🔆#TURBO Analysis : Channel Following ⛔️⛔️
As we can see that #TURBO is following ascending channel on 4h time frame. We can see a bullish formation here. And if it trade with good volume then we can see a proper bullish move in #TURBO📈📈
🔖 Current Price: $0.005610
⏳️ Target Price: $0.006160
⁉️ What to do?
- Keep your eyes on the chart, observe trading volume and stay accustom to market moves.🚀💸
#TURBO #Cryptocurrency #ChartPattern #DYOR
turboThere is a 50% selling pressure area against it that is likely to be allowed to enter the red box to stimulate buyers and this is if the green lines do not disappear
After that I think it can ......
Although there is a visible pattern for the price to increase
But I do not accept the risk of that area very much

TURBO price analysisWell, admit it, at least someone took a chance / was lucky enough to buy #TURBO at $0.0014-0.0015 with a pending limit order that they forgot about ?)
The price of OKX:TURBOUSDT rebounded well, now it would be a "blessing lucky" to buy this #memcoin at $0.0029-$0.0033
With the prospect of #Turbo continuing to grow at least to $0.010
_____________________
Did you like our analysis? Leave a comment, like, and follow to get more

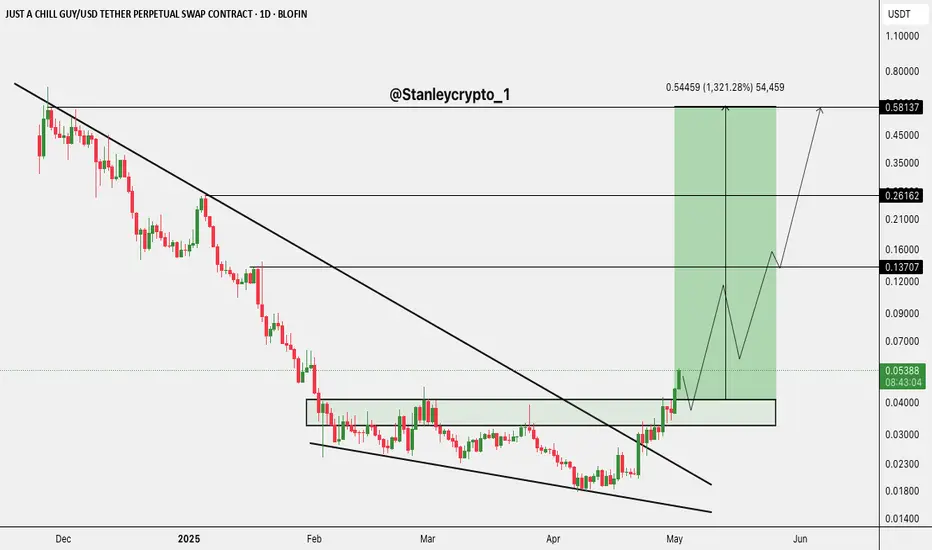
$CHILLGUY/USDT BREAKOUT!$CHILLGUY/USDT BREAKOUT!
Massive breakout from falling wedge + strong retest of the previous range resistance.
If this momentum holds, a 13x rally toward $0.58 is on the cards! 📈
Targets:
- $0.137
- $0.261
- $0.581
Ride or regret. DYOR, NFA 🚀
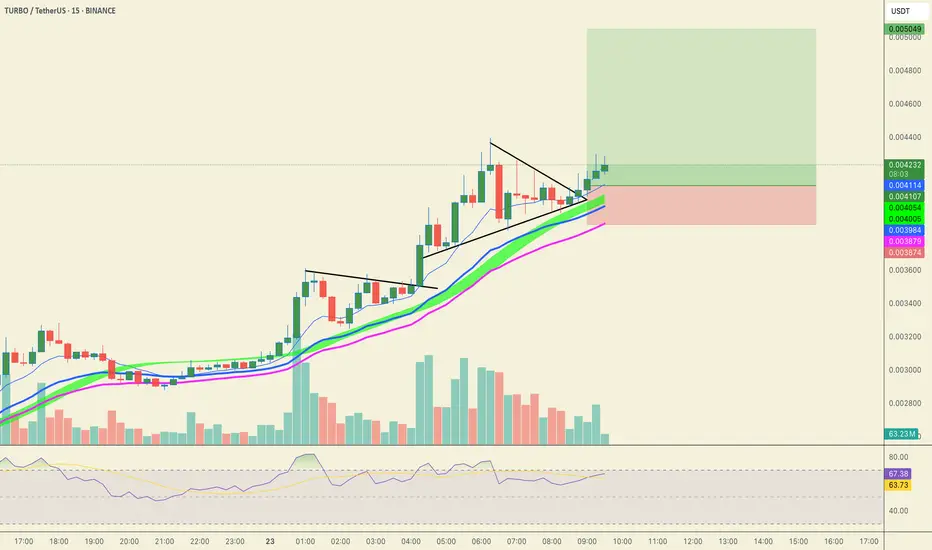
#TURBO/USDT Trade Setup, 22% Scalping Signal!TURBO is ready for another round!
Entry:- .004212 to .003955.004744
Targets:
.004434
.004833
.005010
Stop Loss:- .003874
Leverage: 3x to 5x
Just keep your SL intact.
dyor, nfa.
Please hit the like button if you like these charts.
thank you
#PEACE
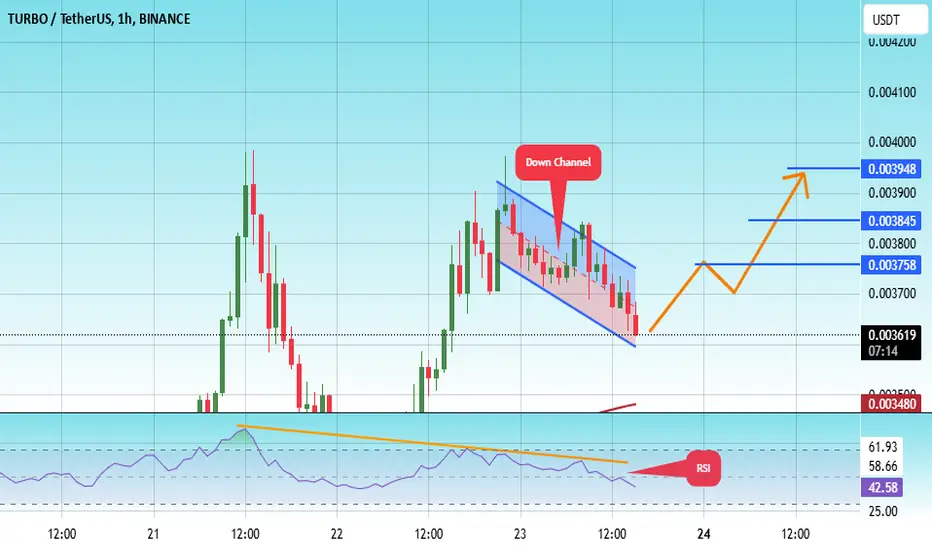
#TURBO/USDT#TURBO
The price is moving in a descending channel on the 1-hour frame and is adhering to it well and is heading to break it strongly upwards and retest it
We have a bounce from the lower limit of the descending channel, this support is at a price of 0.003600
We have a downtrend on the RSI indicator that is about to be broken and retested, which supports the rise
We have a trend to stabilize above the Moving Average 100
Entry price 0.003623
First target 0.003758
Second target 0.003845
Third target 0.003950
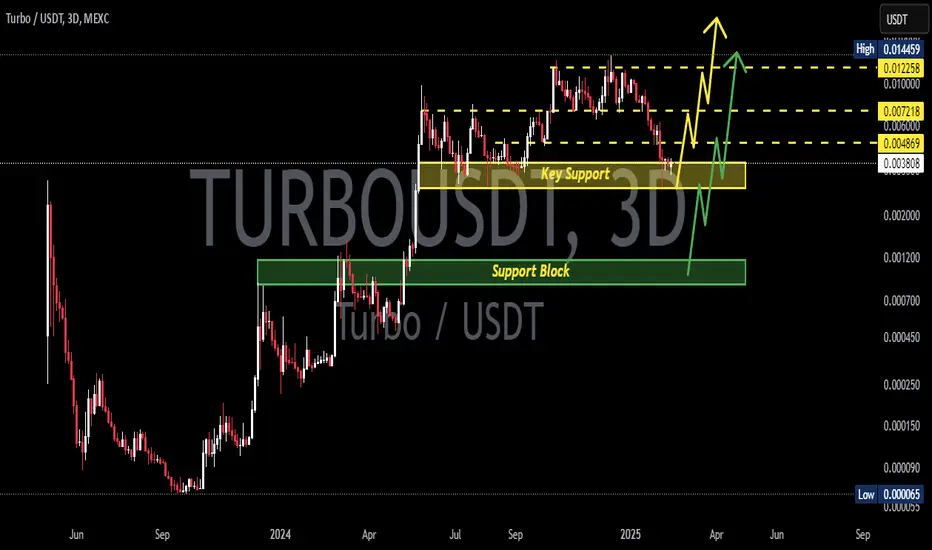
TURBOUSDT 3DTURBO ~ 3D Analysis
#TURBO Two buy zones that you might be able to consider. Buy gradually with a minimum target of 20%++.
TURBO IS STILL ON TRACK FOR TAKE OFF !!! (PACK YOUR BAGS) If you have been following my trade trends on Turbo, from the Beginning "TRIPPLE BULL FLAG ON TURBO", well since then we have had both TRUMP coin and DEEP SEEK remove Liquidity from the entire market and pushing the trend into a descending bear flag, Scary times!
But our friend TURBO refused to postpone take off for too long, having broken the bear flag is now heading back into position for TAKE OFF ! ..
TIME FRAME IS LISTED BELOW ! PACK YOUR BAGS ! NEXT STOP 1.5-2 Cents !
I am not a professional trader, I just enjoy technical analysis if you understand the charts than hopefully you can see the same pattern emerging.
TURBO to 1.4 - 2.2 cents by FEBUARY 16th 2025 <---- MY PREDICTION

TURBO BUY hello friends
With the price drop that it has experienced, this token is now in a relatively good position, which can be bought step by step and we can move with it to the specified goals with capital management.
*Trade safely with us*

TURBOUSDT: Breakout Incoming or Another Fakeout?
Hey traders! Today we’re watching BINANCE:TURBOUSDT.P The price is consolidating around 0.0084450 USDT , testing a key resistance level. We’re seeing a classic ascending triangle forming — a textbook pattern before a big move. Will we see a breakout, or is this just another fakeout?
---
🔑 Key Levels:
Support:
0.0082000 USDT — a key level where buyers could step in again.
0.0080000 USDT — the last line of defense before a potential drop.
Resistance:
0.0087261 USDT — the first barrier keeping price in check.
0.0087928 USDT — the final line before a potential surge.
---
🚩 Trading Strategy:
Entry Point:
- Long entry on a confirmed breakout above 0.0087261 USDT with volume confirmation.
Stop-Loss:
- Place a stop below 0.0082000 USDT to avoid unnecessary drawdowns.
Take-Profit Targets:
0.0087928 USDT — the first level to lock in some profits.
0.0090000 USDT — a target in case of a strong impulse.
---
📈 Technical Analysis:
An ascending triangle is forming, signaling potential accumulation.
Increasing volume near resistance indicates strong buyer interest.
If the breakout fails, we may see a retest of support before another attempt.
---
💡 Conclusion:
This setup looks promising, but confirmation is key. What do you think? Seeing order book liquidity or potential rejection signs? Let’s discuss in the comments!

TURBOUSDT 1DTURBO ~ 1D
#TURBO So far it still maintains this support block,. Buy gradually on this support block,. Minimum target 15%++
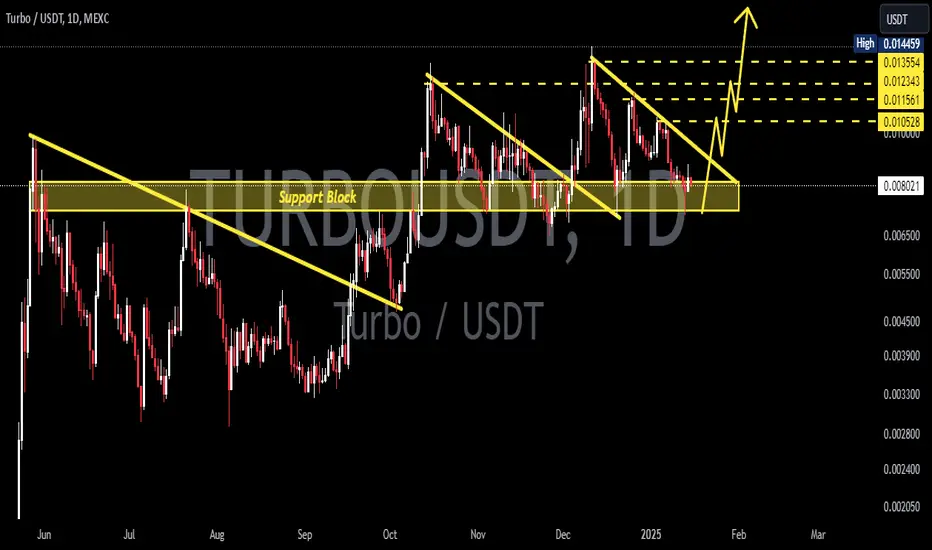
TURBOUSDT 1DTURBO ~ 1D
#TURBO If you still have Conviction on the coin,. Buy gradually on this support block,. or buy after breaking through this resistance line. Target 20%++

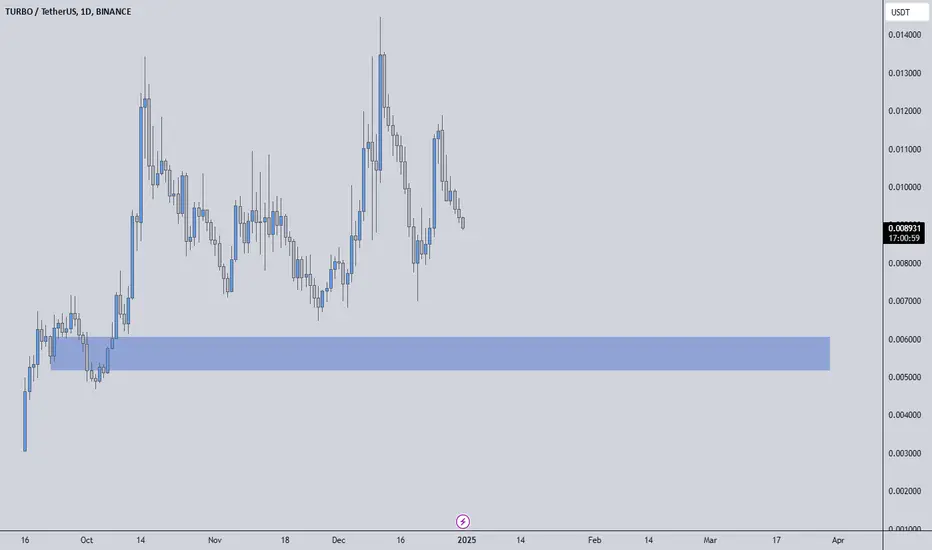
TURBOUSDT: Fresh Deman Zone ResearchTURBOUSDT: Fresh Deman Zone Research 🔍
The price has lingered too long in intermediate zones, which I don't prefer. Instead of getting lost in such areas, I choose fresh demand zones for better opportunities. The blue box marks a fresh demand region.
When trading the blue box, I rely on tools such as CDV, liquidity heatmaps, volume profiles, and volume footprints, alongside market structure breaks on lower time frames for confirmation.
📌 Stay focused, and don't let intermediate price action mislead you. Remember, fresh zones often yield cleaner reactions.
Disclaimer: Manage your risk accordingly; markets remain volatile.
If you think this analysis helps you, please don't forget to boost and comment on this. These motivate me to share more insights with you!
I keep my charts clean and simple because I believe clarity leads to better decisions.
My approach is built on years of experience and a solid track record. I don’t claim to know it all, but I’m confident in my ability to spot high-probability setups.
If you would like to learn how to use the heatmap, cumulative volume delta and volume footprint techniques that I use below to determine very accurate demand regions, you can send me a private message. I help anyone who wants it completely free of charge.
My Previous Analysis (the list is long but I think it's kinda good : )
🎯 ZENUSDT.P: Patience & Profitability | %230 Reaction from the Sniper Entry
🐶 DOGEUSDT.P: Next Move
🎨 RENDERUSDT.P: Opportunity of the Month
💎 ETHUSDT.P: Where to Retrace
🟢 BNBUSDT.P: Potential Surge
📊 BTC Dominance: Reaction Zone
🌊 WAVESUSDT.P: Demand Zone Potential
🟣 UNIUSDT.P: Long-Term Trade
🔵 XRPUSDT.P: Entry Zones
🔗 LINKUSDT.P: Follow The River
📈 BTCUSDT.P: Two Key Demand Zones
🟩 POLUSDT: Bullish Momentum
🌟 PENDLEUSDT.P: Where Opportunity Meets Precision
🔥 BTCUSDT.P: Liquidation of Highly Leveraged Longs
🌊 SOLUSDT.P: SOL's Dip - Your Opportunity
🐸 1000PEPEUSDT.P: Prime Bounce Zone Unlocked
🚀 ETHUSDT.P: Set to Explode - Don't Miss This Game Changer
🤖 IQUSDT: Smart Plan
⚡️ PONDUSDT: A Trade Not Taken Is Better Than a Losing One
💼 STMXUSDT: 2 Buying Areas
🐢 TURBOUSDT: Buy Zones and Buyer Presence
🌍 ICPUSDT.P: Massive Upside Potential | Check the Trade Update For Seeing Results
🟠 IDEXUSDT: Spot Buy Area | %26 Profit if You Trade with MSB
📌 USUALUSDT: Buyers Are Active + %70 Profit in Total
🌟 FORTHUSDT: Sniper Entry +%26 Reaction
🐳 QKCUSDT: Sniper Entry +%57 Reaction
📊 BTC.D: Retest of Key Area Highly Likely
I stopped adding to the list because it's kinda tiring to add 5-10 charts in every move but you can check my profile and see that it goes on..