Chart Patterns - How to read them like a ProChart patterns are visual formations on price charts that help traders anticipate potential market movements.
These patterns fall into three main categories: bullish , bearish , and indecisive .
---
1. Bullish Chart Patterns
Bullish patterns often signal that price is likely to move upward.
1.1 Bull Flag
* What it looks like: A sharp upward move followed by a small downward-sloping rectangle (the flag).
* Meaning: After a strong rally, the price consolidates briefly before continuing higher.
* Key insight: A breakout above the flag typically signals a continuation of the trend.
1.2 Pennant (Bullish)
* What it looks like: A strong upward move followed by a small symmetrical triangle.
* Meaning: Similar to the bull flag, but the consolidation takes a triangular form.
* Key insight: Once price breaks above the pennant, the uptrend often resumes.
1.3 Cup & Handle
* What it looks like: A “U”-shaped curve (the cup) followed by a small downward drift (the handle).
* Meaning: This pattern suggests a period of accumulation before price breaks higher.
* Key insight: A breakout above the handle signals the beginning of a new bullish leg.
1.4 Inverse Head & Shoulders
* What it looks like: Three low points, with the middle low being the deepest.
* Meaning: This reversal pattern appears after a downtrend and signals a potential change to an uptrend.
* Key insight: A breakout above the “neckline” confirms the reversal.
---
2. Indecisive Chart Patterns
These patterns show market hesitation, where neither bulls nor bears are clearly in control.
2.1 Consolidation Channel
* What it looks like: Price moves within a horizontal channel.
* Meaning: Market is moving sideways with no strong trend.
* Key insight: A breakout in either direction often leads to a significant move.
2.2 Symmetrical Triangle
* What it looks like: Two converging trend lines forming a triangle.
* Meaning: This is a neutral pattern that can break out in either direction.
* Key insight: Traders wait for a breakout before taking a position.
---
3. Bearish Chart Patterns
Bearish patterns signal a high probability of downward price movement.
3.1 Bear Flag
* What it looks like: A sharp decline followed by a small upward-sloping rectangle.
* Meaning: After a strong drop, price consolidates before continuing lower.
* Key insight: A breakout below the flag suggests a continuation of the downtrend.
3.2 Pennant (Bearish)
* What it looks like: A sharp downward move followed by a small symmetrical triangle.
* Meaning: Similar to the bear flag, but the consolidation takes a triangular form.
* Key insight: A breakout downward typically resumes the bearish trend.
3.3 Inverse Cup & Handle
* What it looks like: An upside-down cup with a small upward drift forming the handle.
* Meaning: Indicates weakness after an uptrend, often followed by a drop.
* Key insight: A break below the handle usually signals a strong bearish move.
3.4 Head & Shoulders
* What it looks like: Three peaks, with the middle one being the highest.
* Meaning: A classic reversal pattern that indicates a potential shift from an uptrend to a downtrend.
* Key insight: A break below the “neckline” confirms the bearish reversal.
---
How to Use These Patterns
* Combine pattern recognition with support/resistance, volume, and indicators for stronger confirmation.
* Always wait for breakouts and avoid acting too early.
* Manage risk with stop-loss orders.
Tutorial

HOW TO TRADE 'BIG CANDLE"This is an educational video showing a trade set up based on big candles.
This video is for information/education purpose only. you are 100% responsible for any actions you take by reading/viewing this post.
please consult your financial advisor before taking any action.
----Vinaykumar hiremath, CMT

Xmoon Indicator Tutorial – Part 2 – Pivots🔻🔻🔻+ Persian translation below 🔻🔻🔻
🔹 What Is a Pivot?
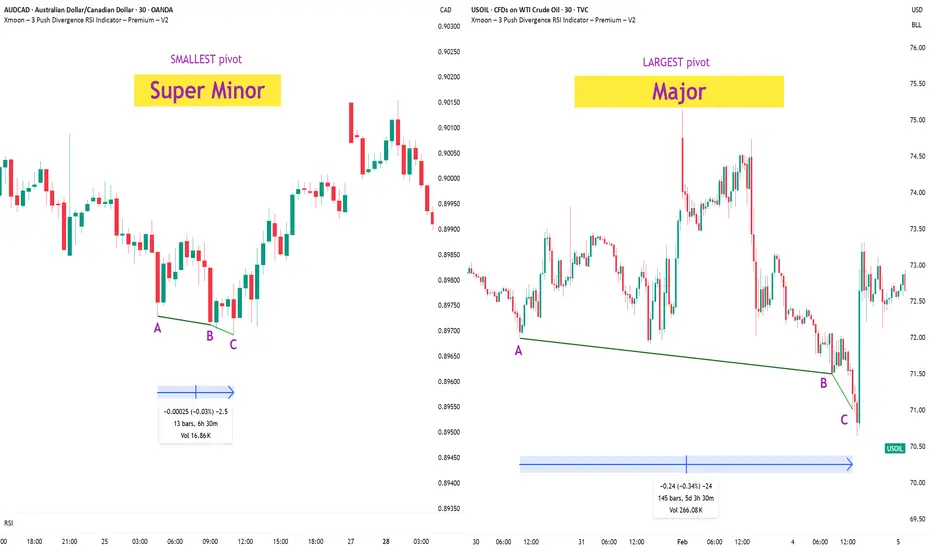
In the Xmoon strategy, every high or low that forms on the chart is considered a pivot.
The number of candles between two highs or two lows defines the size of the pivot.
The more candles there are between them, the larger and more reliable the pivot becomes.
🔸 Types of Pivots in the Xmoon Indicator Settings
In the settings panel, you can choose which types of pivots the patterns should be based on.
There are 4 pivot types :
• Super Minor → the smallest pivot
• Minor
• Mid Major
• Major → the largest pivot
⏫ As you move from Super Minor to Major, the strength of the pivot increases — but the number of signals decreases.
⚖️ Choosing the Right Pivot = Your Trading Style
• Want more signals? → Use smaller pivots like Minor or Super Minor
• Prefer higher accuracy and lower risk? → Use larger pivots like Major or Mid Major
💡 Pro Tip: On higher timeframes, pivots perform better and help reduce risk.
✍️ Summary
If you're looking for frequent signals, trade on lower timeframes, and can handle higher volatility and pressure, then smaller pivots like Super Minor and Minor are a better choice.
But if you prefer quality over quantity, work on higher timeframes, and value clarity, peace of mind, and higher success rates, then larger pivots like Mid Major and Major are the way to go.
📣 If you have any questions or need guidance, feel free to ask us. We’d be happy to help.
🔻🔻🔻 Persian Section – بخش فارسی 🔻🔻🔻
🔹 پیوت چیست؟
در استراتژی ایکسمون، هر قله یا درهای که روی چارت شکل میگیرد، یک پیوت محسوب می شود
فاصله زمانی بین دو قله یا دو دره (یعنی تعداد کندلهایی که بینشان قرار دارد) اندازهی پیوت را مشخص میکند
هرچه تعداد کندل بین دو سقف یا کف بیشتر باشد، آن پیوت بزرگتر و معتبرتر است
🔸 انواع پیوت در تنظیمات اندیکاتور ایکسمون
در بخش تنظیمات، میتوانید مشخص کنید که الگوها بر اساس چه نوع پیوتهایی شناسایی شوند
ما ۴ نوع پیوت داریم
• سوپر مینور ← کوچکترین پیوت
• مینور
• میدماژور
• ماژور ← بزرگترین پیوت
⏫ هرچه از سوپرمینور به سمت ماژور برویم، قدرت پیوت بیشتر میشود، ولی تعداد سیگنالها کمتر می شود
⚖️ انتخاب پیوت مناسب = سبک معاملاتی شما
• به دنبال سیگنال زیاد هستید ← پیوت کوچک تر = مینور و سوپرمینور
• به دنبال دقت بیشتر و ریسک کمتر هستید← پیوت بزرگتر = ماژور و میدماژور
💡 نکته حرفهای: در تایمفریمهای بالا، پیوتها عملکرد بهتری دارند و به کنترل ریسک کمک میکنند
✍️ جمعبندی
اگر دنبال سیگنالهای زیاد هستید، در تایمفریمهای کوچکتر کار میکنید و میتونید نوسانات و فشار روانی بالاتر رو تحمل کنید، پیوتهای کوچکتر مثل سوپرمینور و مینور انتخاب مناسبتری هستند
اما اگر در تایم فریم های بزرگتر کار می کنید و کیفیت سیگنال، آرامش ذهنی و احتمال موفقیت برایتان مهمتر است، پیوتهای بزرگتر مثل میدماژور و ماژور انتخاب بهتری هستند
📣 اگر سوالی دارید یا نیاز به راهنمایی دارید، خوشحال میشویم از ما بپرسید
با کمال میل در خدمتتان هستیم
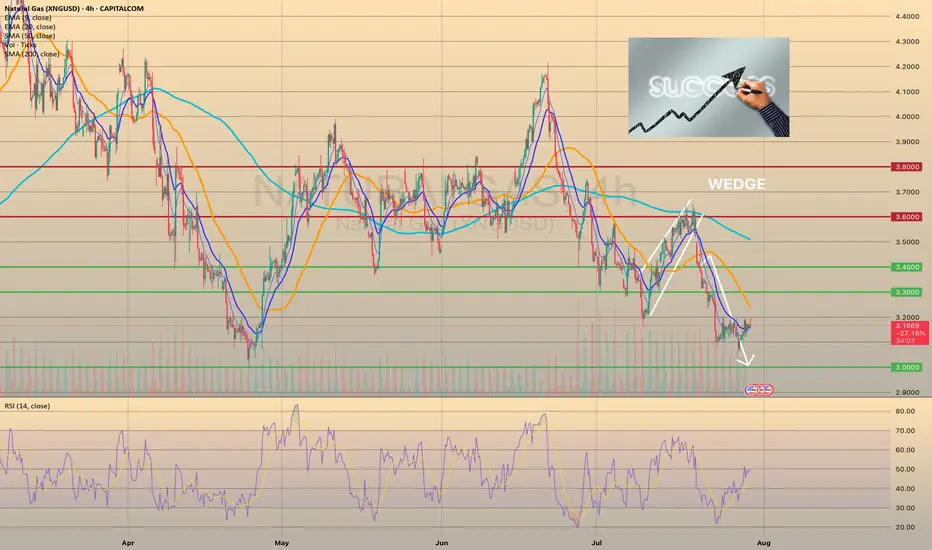
Wedge Pattern — A Key to Trend Movements📐 Wedge Pattern — A Key to Trend Movements 📈
🔍 Introduction
The Wedge is a chart pattern that represents a phase of directional consolidation following a trending move. It can act as a continuation 🔄 or a reversal 🔃 signal, depending on the context. The structure consists of two converging trendlines, both sloping in the same direction.
🧩 Pattern Description
Unlike the Flag pattern 🚩, the Wedge has no flagpole and doesn’t depend on the direction of the previous move. The direction of the wedge body determines its type:
A falling wedge ⬇️ is bullish 🟢 (buy signal)
A rising wedge ⬆️ is bearish 🔴 (sell signal)
The breakout is the key point to watch. The two trendlines slope in the same direction but at different angles, causing them to converge. This reflects a loss of momentum ⚠️ and typically indicates that buyers or sellers are preparing to take control.
This pattern can act as:
A continuation signal 🧭 — appearing at the end of a correction
A reversal signal 🔄 — forming at the end of a strong trend
📉 Volume is usually low during the wedge and rises on breakout. A low-volume breakout increases the risk of a false breakout ❗. Often, price retests the breakout level 🔁, giving traders a second chance to enter.
🎯 Entry & Stop-Loss Strategy
📥 Entry: On breakout confirmation
🛑 Stop-loss: Below the pattern’s low (bullish) or above its high (bearish), or under/above the most recent local swing point
🎯 Target: Project the height of the widest part of the wedge from the breakout point. Alternatively, use key price levels 📊 or a trailing stop 🔂 to lock in profits.
💡 My Pro Tips for Trading the Wedge
✅ Pattern Criteria
Two converging trendlines ➡️➕➡️
Clearly defined structure ✏️
Prior trending move before the wedge 🚀
Low volume within the wedge 📉, high volume on breakout 📈
Retest of breakout level = confirmation 🔁
🔥 Factors That Strengthen the Signal
Breakout on strong volume 📊💥
Appears after an extended trend 🧭📉📈
More touches = stronger pattern ✍️
Breakout occurs close to the apex 🎯
⚠️ Factors That Weaken the Signal
Low volume on breakout 😐
Poorly defined trendlines 🫥
Few touches on lines
Early breakout (too far from apex) ⏱️
No prior trend / appears in a range-bound market 📏
✅ Examples of My Successful Wedge Trades
📸
❌Examples of Failed Wedge Overview
💥
💬 Do you use the wedge pattern in your trading?
It’s a powerful pattern, especially when confirmed by volume and market structure. Share your favorite wedge setups or ask questions below 👇👇
Xmoon Indicator Tutorial – Part 1 – Strategy🔻🔻🔻+ Persian version below🔻🔻🔻
📘 Xmoon Indicator Tutorial – Part 1
🎯 3Push Divergence RSI Strategy
🔥 The core of the Xmoon indicator
is built upon one of the most powerful strategies in technical analysis:
The advanced 3Push Divergence RSI pattern
🔁 A pattern that typically appears at key market turning points.
📉 When the price moves in the same direction three consecutive times on pivot points (e.g., making lower lows or higher highs), but the RSI shows the opposite behavior, it indicates a clear divergence !
💡 This divergence can act as a strong signal for a potential trend reversal.
🎯 The Xmoon Indicator is designed to detect this critical moment.
⚙️ Xmoon Indicator Settings Panel
The Xmoon settings panel offers the following options:
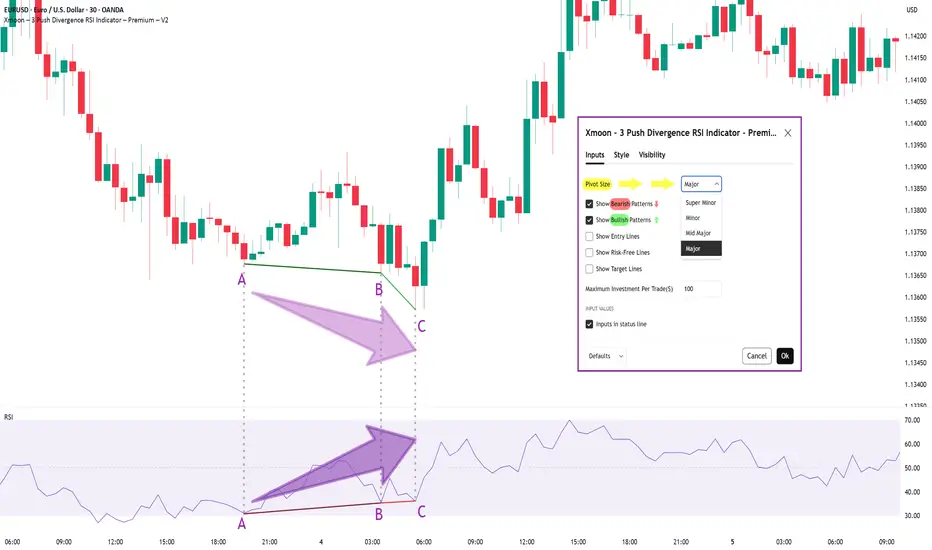
🔸 Pattern Type Selection: In the first and second lines, you can specify which type of pattern should be displayed: only bullish patterns or only bearish ones. You can also check both options.
🔸 Pivot Type Selection: From the dropdown menu, you can choose one of four pivot types:
“Super Minor”, “Minor”, “Mid-Major”, and “Major”, ordered from smallest to largest.
📌 Educational Note: The greater the distance (in candle count) between two lows or two highs, the larger the pivot is considered.
A Major Pivot is the largest among them.
✅ Larger Pivot = Higher Accuracy
❗ But naturally = Fewer Signals
📣 If you have any questions or need guidance, feel free to ask us. We’d be happy to help.
🔻🔻🔻بخش فارسی – Persian Section 🔻🔻🔻
📘 آموزش اندیکاتور ایکسمون - قسمت اول
🎯 استراتژی سهپوش واگرایی (3Push Divergence RSI)
🔥 هسته اصلی ایکسمون
بر پایه یکی از قویترین استراتژیهای تحلیل تکنیکال طراحی شده است
الگوی پیشرفته سهپوش واگرایی
🔁 الگویی که معمولاً در نقاط چرخش مهم بازار ظاهر میشود
📉 وقتی قیمت سه بار پشت سر هم روی نقاط پیوت ، در یک جهت حرکت میکند (مثلاً کفهای پایینتر یا سقفهای بالاتر میسازد) ، اما آر-اِس-آی خلاف آن را نشان میدهد، یعنی یک واگرایی آشکار رخ داده است
💡این واگرایی میتواند سیگنالی قوی برای برگشت روند باشد
🎯 اندیکاتور ایکسمون این لحظه را شناسایی میکند
⚙️ پنجره تنظیمات اندیکاتور ایکسمون
در بخش تنظیمات اندیکاتور ایکسمون، امکاناتی در اختیار شما قرار دارند
🔸 انتخاب نوع الگو: در خط اول و دوم میتوانید مشخص کنید چه نوع الگویی نمایش داده شود
فقط الگوهای صعودی یا فقط نزولی. همچنین می توانید تیک هر دو گزینه را بزنید
🔸 انتخاب نوع پیوتها: از پنجره کشویی بالا، می توانید یکی از ۴ نوع پیوت را انتخاب کنید
پیوت ها به ترتیب از کوچک به بزرگ عبارتند از: سوپر مینور ، مینور ، میدماژور و ماژور
📌 نکته آموزشی: هرچه فاصله بین دو کف یا دو سقف بیشتر باشد (یعنی تعداد کندلهای بین آنها زیادتر باشد)، آن پیوت، بزرگتر محسوب میشود
پیوت ماژور از بقیه بزرگ تر است
✅ پیوت بزرگتر = دقت بالاتر
❗ اما طبیعتاً = تعداد سیگنال کمتر
📣 اگر سوالی دارید یا نیاز به راهنمایی دارید، خوشحال میشویم از ما بپرسید
با کمال میل در خدمتتان هستیم
The Dangers of Holding Onto Losing Positions...One of the most common — and costly — mistakes in trading is holding onto a losing position for too long. Whether it's driven by hope, ego, or fear, this behavior can damage your portfolio, drain your capital, and block future opportunities. Successful trading requires discipline, objectivity, and the willingness to accept when a trade isn’t working. Understanding the risks behind this behavior is essential to protecting your capital and evolving as a trader.
-- Why Traders Hold Onto Losing Trades --
It’s not always poor strategy or lack of experience that keeps traders locked in losing positions — it’s often psychology. Several cognitive biases are at play:
1. Loss Aversion
Loss aversion refers to our instinctive desire to avoid losses, often stronger than the desire to realize gains. Traders may hold onto a losing position simply to avoid the emotional pain of admitting the loss, hoping the market will eventually turn in their favor.
2. Overconfidence
When traders are overly confident in their analysis or trading thesis, they can become blind to changing market conditions. This conviction may cause them to ignore red flags and hold on out of sheer stubbornness or pride.
3. The Sunk Cost Fallacy
This is the belief that since you’ve already invested money, time, or effort into a trade, you need to keep going to “get your investment back.” The reality? Past investments are gone — and continuing the position often compounds the loss.
These mental traps can distort decision-making and trap traders in unproductive or damaging positions. Being aware of them is the first step toward better judgment.
-- The True Cost of Holding Losing Positions --
Holding onto a bad trade costs more than just the money it loses. It impacts your entire trading strategy and limits your growth. Here’s how:
1. Opportunity Cost
Capital tied up in a losing trade is capital that can’t be used elsewhere. If you keep $8,000 in a stock that’s fallen from $10,000 — hoping it rebounds — you're missing out on placing that money in higher-performing opportunities. Inactive capital is wasted capital.
2. Deeper Compounding Losses
A 20% loss doesn’t sound catastrophic until it becomes 30%… then 40%. The deeper the loss, the harder it becomes to break even. Holding out for a recovery often makes things worse — especially in markets with high volatility or downtrends.
3. Reduced Liquidity
Successful traders rely on flexibility. When your funds are tied up in a losing position, you limit your ability to respond to new opportunities. In fast-moving markets, this can be the difference between success and stagnation.
Recognizing these costs reframes the decision from “holding on until it turns around” to “preserving capital and maximizing potential.”
Consider this simple XAUUSD (Gold) weekly chart example. If you base a trading strategy solely on the Stochastic oscillator (or any single indicator) without backtesting and ignoring the overall trend, focusing solely on overbought signals for reversals, you'll quickly see the oscillator's frequent inaccuracies. This approach will likely lead to substantial and prolonged losses while waiting for a reversal that may never occur.
-- Signs It’s Time to Exit a Losing Trade --
The hardest part of trading isn’t opening a position — it’s closing a bad one. But if you know what to look for, you’ll know when it’s time to let go:
1. Emotional Attachment
If you find yourself feeling “married” to a trade, it’s a warning sign. Traders often assign meaning or identity to a position. But trading should be based on data and strategy, not sentiment.
2. Ignoring or Adjusting Your Stop Loss
Stop Loss orders exist for a reason: to protect your capital. If you habitually move your stop further to avoid triggering it, you’re letting hope override risk management.
3. Rationalizing Losses
Statements like “It’ll bounce back” or “This company always recovers” can signal denial. Hope is not a strategy. When you catch yourself justifying a bad position without objective reasoning, it’s time to reevaluate.
Consider also reading this article:
-- How to Cut Losses and Move Forward --
Cutting a loss isn’t a failure — it’s a skill. Here are proven techniques that help you exit with discipline and confidence:
1. Use Stop Losses — and Respect Them
Set a Stop Loss at the moment you enter a trade — and stick to it. It takes the emotion out of the exit and protects your downside. Moving the stop is the fastest path to deeper losses.
2. Trade With a Plan
Every trade should be part of a bigger strategy that includes risk tolerance, entry/exit points, and profit targets. If a position hits your predetermined loss threshold, exit. Trust your system.
3. Apply Position Sizing and Diversification
Never risk more than a small percentage of your capital on a single trade. Keep your portfolio diversified across different instruments or sectors to avoid one position derailing your progress.
4. Review and Reflect
Post-trade analysis is vital. Review both wins and losses to learn what worked — and what didn’t. This practice sharpens your strategy and builds emotional resilience over time.
-- Why Cutting Losses Strengthens Your Portfolio --
There’s long-term power in letting go. Here’s what cutting losses early can do for you:
1. Preserve Capital
The faster you cut a losing trade, the more capital you retain — and the more opportunities you can pursue. Capital preservation is the foundation of longevity in trading.
2. Reduce Emotional Stress
Sitting in a losing trade weighs heavily on your mindset. The stress can cloud your judgment, increase risk-taking, or cause hesitation. Exiting early reduces this emotional drag and keeps you clear-headed.
3. Reallocate to Better Setups
Exiting losing trades frees up both capital and mental energy for higher-probability opportunities. This proactive approach builds momentum and reinforces the idea that it’s okay to be wrong — as long as you act decisively.
Consider also reading this article:
-- Final Thoughts: Discipline Over Denial --
Holding onto losing trades may feel like you're showing patience or commitment — but in reality, it's often denial wrapped in hope. Trading is about probabilities, not guarantees. The most successful traders aren’t the ones who win every trade — they’re the ones who manage losses with discipline.
Letting go of a bad trade is a show of strength, not weakness. It’s a deliberate choice to protect your capital, stay agile, and refocus on trades that serve your goals. The market doesn’t owe you a comeback — but with a clear head and disciplined approach, you can always find your next opportunity.
✅ Please share your thoughts about this article in the comments section below and HIT LIKE if you appreciate my post. Don't forget to FOLLOW ME; you will help us a lot with this small contribution.

Fibonacci Retracement: The Hidden Key to Better EntriesIf you’ve ever wondered how professional traders predict where price might pull back before continuing... the secret lies in Fibonacci Retracement.
In this post, you’ll learn:
What Fibonacci retracement is
Why it works
How to use it on your charts (step-by-step)
Pro tips to increase accuracy in the market
🧠 What Is Fibonacci Retracement?:
Fibonacci Retracement is a technical analysis tool that helps traders identify potential support or resistance zones where price is likely to pause or reverse during a pullback.
It’s based on a mathematical sequence called the Fibonacci Sequence, found everywhere in nature — from galaxies to sunflowers — and yes, even in the markets.
The Fibonacci sequence is a series of numbers where each number is the sum of the two preceding ones, starting with 0 and 1. The sequence typically begins with 0, 1, 1, 2, 3, 5, 8, 13, and so on. This pattern can be expressed as a formula: F(n) = F(n-1) + F(n-2), where F(n) is the nth Fibonacci number.
The key Fibonacci levels traders use are:
23.6%
38.2%
50%
61.8%
78.6%
These levels represent percentages of a previous price move, and they give us reference points for where price might pull back before resuming its trend and where we can anticipate price to move before showing support or resistance to the trend you are following.
💡Breakdown of Each Fib Level:
💎 0.236 (23.6%) – Shallow Pullback
What it indicates:
Weak retracement, often signals strong trend momentum.
Buyers/sellers are aggressively holding the trend.
Best action:
Aggressive entry zone for continuation traders.
Look for momentum signals (break of minor structure, bullish/bearish candles). Stay out of the market until you see more confirmation.
💎 0.382 (38.2%) – First Strong Area of Interest
What it indicates:
Healthy pullback in a trending market.
Seen as a key area for trend followers to step in.
Best action:
Look for entry confirmation: bullish/bearish engulfing, pin bars, Elliott Waves, or break/retest setups.
Ideal for setting up trend continuation trades.
Stop Loss 0.618 Level
💎 0.500 (50.0%) – Neutral Ground
What it indicates:
Often marks the midpoint of a significant price move.
Market is undecided, can go either way.
Best action:
Wait for additional confirmation before entering.
Combine with support/resistance or a confluence zone.
Useful for re-entry on strong trends with good risk/reward.
Stop Loss 1.1 Fib Levels
💎 0.618 (61.8%) – The “Golden Ratio”
What it indicates:
Deep pullback, often seen as the last line of defense before trend reversal.
High-probability area for big players to enter or add to positions.
Best action:
Look for strong reversal patterns (double bottoms/tops, engulfing candles).
Excellent area for entering swing trades with tight risk and high reward.
Use confluence (structure zones, moving averages, psychological levels, Elliott Waves).
Wait for close above or below depending on the momentum of the market.
Stop Loss 1.1 Fib Level
💎 0.786 (78.6%) – Deep Correction Zone
What it indicates:
Very deep retracement. Often a final “trap” zone before price reverses.
Risk of trend failure is higher.
Best action:
Only trade if there's strong reversal evidence.
Use smaller position size or avoid unless other confluences are aligned.
Can act as an entry for counter-trend trades in weaker markets.
Stop Loss around 1.1 and 1.2 Fib Levels
⏱️Best Timeframe to Use Fibs for Day Traders and Swing Traders:
Day trading:
Day traders, focused on capturing short-term price movements and making quick decisions within a single day, typically utilize shorter timeframes for Fibonacci retracement analysis, such as 15-minute through hourly charts.
They may also use tighter Fibonacci levels (like 23.6%, 38.2%, and 50%) to identify more frequent signals and exploit short-term fluctuations.
Combining Fibonacci levels with other indicators such as moving averages, RSI, or MACD, and focusing on shorter timeframes (e.g., 5-minute or 15-minute charts) can enhance signal confirmation for day traders.
However, relying on very short timeframes for Fibonacci can lead to less reliable retracement levels due to increased volatility and potential for false signals.
Swing trading:
Swing traders aim to capture intermediate trends, which necessitates giving trades more room to fluctuate over several days or weeks.
They typically prefer utilizing broader Fibonacci levels (like 38.2%, 50%, and 61.8%) to identify significant retracement points for entering and exiting trades.
Swing traders often focus on 4-hour and daily charts for their analysis, and may even consult weekly charts for a broader market perspective.
🎯 Why Does Fibonacci Work?:
Fibonacci levels work because of:
Mass psychology – many traders use them
Natural rhythm – markets move in waves, not straight lines
Institutional footprint – smart money often scales in around key retracement zones
It's not magic — it's structure, and it's surprisingly reliable when used correctly.
🛠 How to Draw Fibonacci Retracement (Step-by-Step):
Let’s say you want to trade XAU/USD (Gold), and price just had a strong bullish run.
✏️ Follow These Steps:
Identify the swing low (start of move)
Identify the swing high (end of move)
Use your Fibonacci tool to draw from low to high (for a bullish move)
The tool will automatically mark levels like 38.2%, 50%, 61.8%, etc.
These levels act as pullback zones, and your job is to look for entry confirmation around them.
🔁 For bearish moves, draw from high to low. (I will show a bearish example later)
Now let’s throw some examples and pictures into play to get a better understanding.
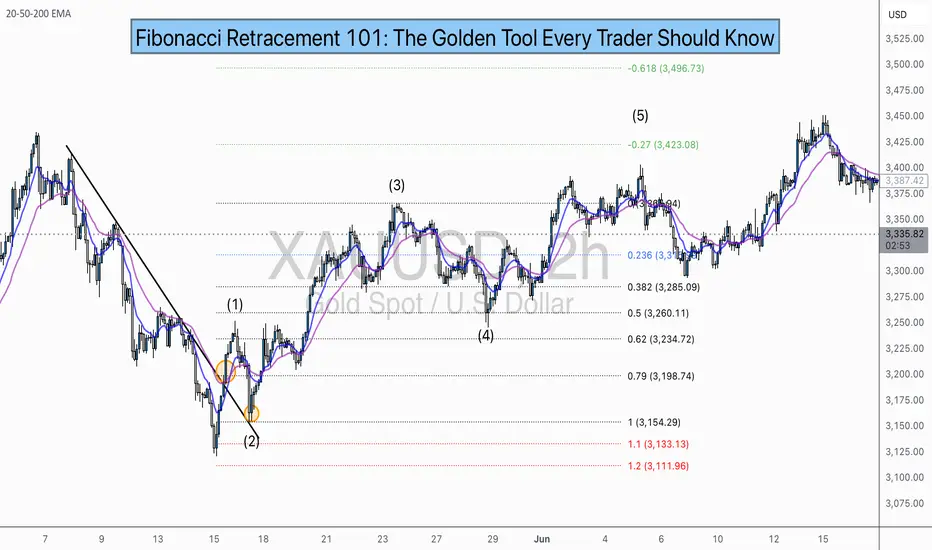
📈 XAU/USD BULLISH Example:
1.First we Identify the direction of the market:
2.Now we set our fibs by looking for confirmations to get possible entry point:
Lets zoom in a bit:
Now that we have a break of the trendline we wait for confirmation and look for confluence:
Now we set our fibs from the last low to the last high:
This will act as our entry point for the trade.
3. Now we can look for our stop loss and take profit levels:
Stop Loss:
For the stop loss I like to use the fib levels 1.1 and 1.2 when I make an entry based upon the 0.618 level. These levels to me typically indicate that the trade idea is invalid once crossed because it will usually violate the prior confirmations
Take Profit:
For the take profit I like to use the Fib levels 0.236, 0, -0.27, and -0.618. This is based upon your personal risk tolerance and overall analysis. You can use 0.236 and 0 level as areas to take partial profits.
Re-Entry Point Using Elliott Waves as Confluence Example:
This is an example of how I used Elliott Waves to enter the trade again from the prior entry point. If you don’t know what Elliott Waves are I will link my other educational post so you can read up on it and have a better understanding my explanation to follow.
After seeing all of our prior confirmations I am now confident that our trend is still strongly bullish so I will mark my Waves and look for an entry point.
As we can see price dipped into the 0.38-0.5 Fib level and rejected it nicely which is also in confluence with the Elliott Wave Theory for the creation of wave 5 which is the last impulse leg before correction.
🔻 In a downtrend:
Same steps, but reverse the direction — draw from high to low and look to short the pullback.
XAU/USD Example:
As you can see the same basic principles applied for bearish movement as well.
⚠️ Pro Tips for Accuracy:
✅ Always use Fib in confluence with:
Market structure (higher highs/lows or lower highs/lows)
Key support/resistance zones
Volume or momentum indicators
Candle Patterns
Elliott Waves, etc.
❌ Don’t trade Fib levels blindly — they are zones, not guarantees.
📊 Use higher timeframes for cleaner levels (4H, Daily)
💡 Final Thought
Fibonacci retracement doesn’t predict the future — it reveals probability zones where price is likely to react.
When combined with structure and confirmation, it becomes one of the most reliable tools for new and experienced traders alike.
🔥 Drop a comment if this helped — or if you want a Part 2 where I break down Fibonacci Extensions and how to use them for take-profit targets.
💬 Tag or share with a beginner who needs to see this!
Mastering supply and demand zones - how to use it in trading?Supply and demand zones are key concepts in technical analysis used by traders to identify potential price reversal areas on a chart. They are based on the idea that prices move due to an imbalance between buyers (demand) and sellers (supply).
-------------------------
What will be discussed?
- What are supply and demand zones?
- How to detect supply and demand zones?
- Examples from supply and demand zones?
- How to trade using supply and demand zones?
-------------------------
What are supply and demand zones?
Supply and demand zones are areas on a price chart where the forces of buying and selling are strongly concentrated, causing significant movements in price. In simple terms, a supply zone is an area where selling pressure exceeds buying pressure, often leading to a drop in price. It usually forms when price moves upward into a region where sellers begin to outnumber buyers, pushing the price back down. On the other hand, a demand zone is a region where buying pressure exceeds selling pressure, typically resulting in a rise in price. This occurs when price moves downward into a region where buyers see value and begin to outnumber sellers, causing the price to increase again.
These zones reflect areas of imbalance in the market. In a supply zone, sellers are more eager to sell than buyers are to buy, often due to overbought conditions, news, or fundamental changes. In a demand zone, buyers are more eager to buy than sellers are to sell, often because the price has become attractive or undervalued. Traders look for these zones because they provide clues about where price may reverse or stall, offering potential entries or exits for trades.
-------------------------
How to detect supply and demand zones?
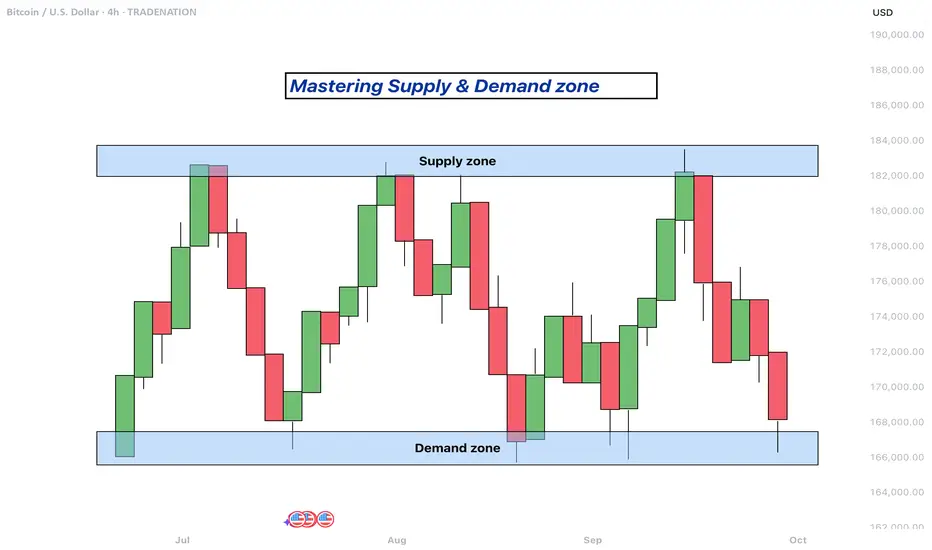
Identifying supply and demand zones involves analyzing price action on a chart, typically using candlestick patterns. A common way to detect a supply zone is to look for a sharp upward move followed by a sudden reversal or strong drop in price. The area where the price stalled before falling sharply is likely to be a supply zone. This zone includes the highest candle body or wick before the drop, and a few candles before it that mark where the selling pressure began.
To identify a demand zone, you would look for a sharp drop in price followed by a strong rally upward. The area where the price paused before rising significantly can be considered a demand zone. Like with supply zones, the demand zone includes the lowest candle before the price reversed and a few candles leading up to it.
These zones are not exact price levels but rather ranges. Price does not have to touch an exact line to react; it often moves within the general area. For more accuracy, traders often refine their zones by identifying them on higher time frames such as the 4-hour or daily chart, then adjusting them slightly on lower time frames like the 1-hour or 15-minute chart.
-------------------------
Examples from supply and demand zones:
-------------------------
How to trade using supply and demand zones?
Trading supply and demand zones involves anticipating how price is likely to behave when it returns to one of these key areas. A common method is to wait for price to enter a zone and then watch for confirmation that it is going to reverse. For example, if price rises into a supply zone, you might look for signs like a bearish candlestick pattern, a drop in volume, or a rejection wick to signal that sellers are stepping in again. This would be an opportunity to enter a short trade with the expectation that price will fall.
Conversely, if price falls into a demand zone, you would wait for bullish signals—such as a strong bullish candle, a double bottom pattern, or clear rejection of lower prices—to confirm that buyers are returning. This would be a potential setup for a long trade, expecting the price to move up from the zone.
Traders often place stop losses just beyond the zone to limit risk in case the level fails. For a supply zone, the stop loss would go just above the zone, while for a demand zone, it would go just below. Targets can be set at recent support or resistance levels, or by using risk-reward ratios like 1:2 or 1:3 depending on the trader’s strategy.
Patience and discipline are important when trading these zones. Not every zone will lead to a reversal, and false breakouts can occur. Therefore, combining supply and demand analysis with other tools such as trendlines, moving averages, or indicators can improve the chances of a successful trade.
In summary, supply and demand zones help traders understand where large buying or selling forces are likely to influence price. By learning to identify these zones and waiting for confirmation signals, traders can enter high-probability trades with clear risk and reward levels.
-------------------------
Disclosure: I am part of Trade Nation's Influencer program and receive a monthly fee for using their TradingView charts in my analysis.
Thanks for your support. If you enjoyed this analysis, make sure to follow me so you don't miss the next one. And if you found it helpful, feel free to drop a like and leave a comment, I’d love to hear your thoughts!
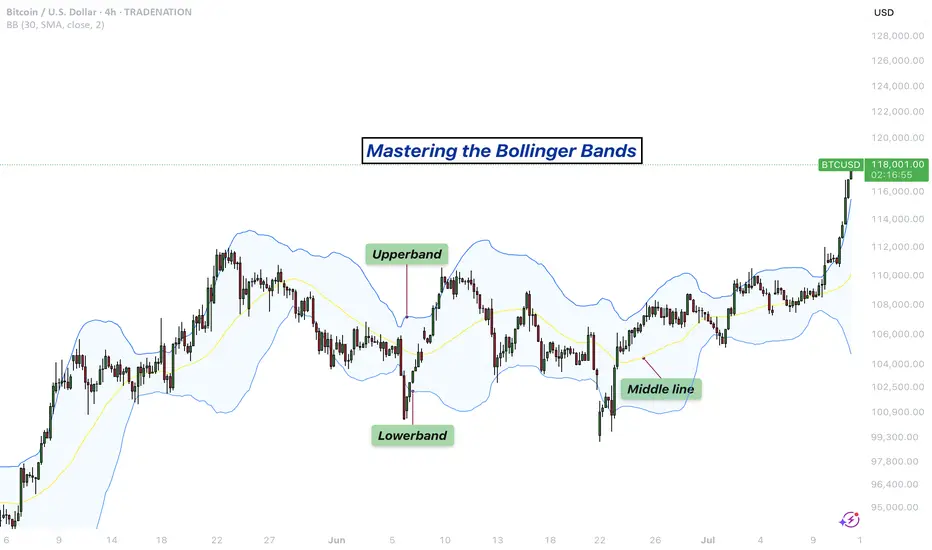
Mastering the Bollinger Bands- How to use it in trading?What is the Bollinger Bands
Bollinger Bands is a popular technical analysis tool developed by John Bollinger in the 1980s. It is designed to measure market volatility and provide signals for potential price reversals or trend continuations. The Bollinger Bands consist of three lines: a simple moving average in the middle, usually calculated over 20 periods, and two outer bands that are placed a set number of standard deviations above and below the moving average. These outer bands automatically adjust to market conditions, expanding and contracting based on price volatility. The indicator is widely used by traders to understand the relative highs and lows of a financial instrument in relation to recent price action.
What will be discussed?
- How does it work with the lower band and upper band?
- What does the narrowing mean?
- What does the widening mean?
- How to trade with the Bollingers Bands?
-------------------------
How does it work with the lower band and upper band?
The upper band and the lower band serve as dynamic levels of resistance and support. When the price of an asset touches or exceeds the upper band, it may be considered overbought, suggesting that a reversal or pullback could be near. Conversely, when the price approaches or breaks below the lower band, the asset may be viewed as oversold, indicating a potential rebound. These bands do not generate definitive buy or sell signals on their own but instead help traders assess market conditions. The interaction of price with the upper and lower bands often provides visual cues about the momentum and direction of the market, allowing for more informed decision-making.
-------------------------
What does the narrowing mean?
The narrowing of the Bollinger Bands occurs when the price becomes less volatile over time. This contraction indicates a period of consolidation or low market activity, where the price is trading in a tighter range. Narrowing bands are often interpreted as a signal that a significant price movement may be coming soon, as low volatility tends to precede high volatility. This phase is sometimes referred to as the "squeeze," and traders closely monitor it to anticipate breakout opportunities. The direction of the breakout, whether upward or downward, is not predicted by the narrowing itself but usually follows shortly after the bands have contracted.
-------------------------
What does the widening mean?
The widening of the Bollinger Bands reflects increasing market volatility. When the price starts to move rapidly either up or down, the bands spread further apart to accommodate this movement. This expansion typically confirms that a new trend is underway or that a breakout has occurred. The wider the bands become, the greater the degree of price fluctuation. During these times, traders may observe stronger momentum in the market, and the continuation of the move may be supported by the growing distance between the bands. However, extremely wide bands may also suggest that a reversal could be nearing, as the market can become overstretched in either direction.
-------------------------
How to trade with the Bollinger Bands?
Trading with Bollinger Bands involves using the bands to identify entry and exit points based on the behavior of price in relation to the upper and lower bands. One common approach is to buy when the price touches or breaks below the lower band and shows signs of bouncing back, and to sell when the price reaches or moves above the upper band and begins to retreat. Another strategy involves waiting for the bands to narrow significantly and then entering a trade in the direction of the breakout that follows. Traders often use Bollinger Bands in combination with other indicators such as RSI, MACD, or volume to confirm signals and reduce the risk of false breakouts. It is important to remember that Bollinger Bands are not predictive on their own but are most effective when used as part of a broader technical analysis framework.
-------------------------
Disclosure: I am part of Trade Nation's Influencer program and receive a monthly fee for using their TradingView charts in my analysis.
Thanks for your support.
- Make sure to follow me so you don't miss out on the next analysis!
- Drop a like and leave a comment!
Understanding Elliott Wave Theory with BTC/USDIntroduction to Elliott Wave Theory:
Elliott Wave Theory is a popular method of technical analysis that seeks to predict the future price movement of financial markets. Developed by Ralph Nelson Elliott in the 1930s, the theory is based on the idea that market movements follow a repetitive pattern, driven by investor psychology.
At the core of Elliott’s theory is the idea that markets move in a 5-wave pattern in the direction of the trend, followed by a 3-wave corrective pattern. These waves can be seen on all timeframes and help traders identify potential entry and exit points in the market.
Key Concepts of Elliott Wave Theory:
1. Impulse Waves (The Trend)
2. These are the waves that move in the direction of the overall trend. They are labeled 1, 2, 3, 4, 5 and represent the price movement in the main direction of the market.
* Wave 1: The initial move up (or down in a bearish market). I like to mark up the first wave how I do my Fibs, from the point where price showed a major impulse.
* Wave 2: A correction of Wave 1 (it doesn’t go lower than the starting point of Wave 1).
* Wave 3: The longest and most powerful wave in the trend.
* Wave 4: A smaller correction in the direction of the trend.
* Wave 5: The final push in the direction of the trend, which can be shorter and weaker than Wave 3.
3. Corrective Waves (The Pullbacks)
4. After the five-wave impulse, the market enters a corrective phase, moving against the trend. This corrective phase is generally a 3-wave pattern, labeled A, B, C:
* Wave A: The initial correction, typically smaller than Wave 3.
* Wave B: A temporary move against the correction (it often confuses traders who think the trend has resumed).
* Wave C: The final move against the trend, usually the strongest and most aggressive.
How to Implement Elliott Wave on BTC/USD:
Let’s break down how you can apply the Elliott Wave Theory to BTC/USD using a simple example.
1. Identify the Trend
2. Start by identifying the current market trend for BTC/USD. Are we in an uptrend or downtrend? This will determine whether you’re looking for a 5-wave impulse up (bullish) or down (bearish).
3. Locate the Waves
4. Look for the five-wave structure in the trend direction. Once you identify a potential impulse move, label the waves accordingly:
* Wave 1: A new uptrend starts.
* Wave 2: A small pullback (usually less than the size of Wave 1).
* Wave 3: A significant surge in price, often the most volatile.
* Wave 4: A smaller pullback or consolidation.
* Wave 5: The final push higher, which might show signs of exhaustion.
5. Corrective Phase
6. After completing the 5-wave impulse, expect a corrective 3-wave pattern (A, B, C). These corrections typically last longer than expected and can often confuse traders.
* Wave A: Price starts to reverse.
* Wave B: A retracement that may confuse traders into thinking the trend is resuming.
* Wave C: A strong pullback that brings the price even lower.
7. Use Fibonacci Levels as confluence
8. One of the most powerful tools in Elliott Wave analysis is Fibonacci retracement levels. You can use these to predict potential levels where Wave 2 and Wave 4 could end, or where Wave C might complete the correction. Common retracement levels are 38.2%-50% for Wave 4, and 50-61.8% For Waves 2 and B but keep in mind, these wave can retrace up to 100% before the wave analysis becomes invalid. But ideally these points are where you look to make an entry.
Wave 2 Example:
This one hit the golden spot (0.5-0.618) perfectly and continued to push upward.
Wave B and C Example:
This example hit closer to the 0.786 level which is also a key level for retracement.
Wave 4 Example:
This one hit the golden spot (0.382-0.5) for Wave 4 perfectly before continue the bullish momentum.
I try to use the RED levels below (1.1 and 1.2) as my invalidation (Stop Loss) levels and the GREEN levels (-0.27 and -0.618) as my Take Profit levels. Depending on your goals you can also use Fib Levels 0.236 and 0 as partial Take Profit levels.
9. Confirm with Indicators
10. To validate your Elliott Wave counts, use other indicators like the RSI (Relative Strength Index), MACD, or Moving Averages. For example, a Wave 3 might occur when the RSI is above 50, indicating strength in the trend.
In this example you can see the RSI cross the 50 threshold and the 3rd Wave form.
Continuation after the Wave is complete:
Tips for Trading with Elliott Wave Theory:
* Stay Flexible: Elliott Wave Theory is not set in stone. If the market doesn’t follow the expected pattern, adjust your wave counts accordingly.
* Don’t Rely on One Timeframe: A 5-wave structure on one timeframe may be part of a larger wave pattern on a higher timeframe. Always analyze multiple timeframes.
* Wave Personality: Waves don’t always look the same as stated earlier. Wave 2 can retrace up to 100% of Wave 1 and Wave 4 should generally not overlap Wave 1 or this may invalidate the Wave structure.
* Risk Management: Always use proper risk management techniques. No theory is perfect, so make sure you have a stop-loss in place to manage your risk.
Conclusion: Using Elliott Wave Theory on BTC/USD:
The Elliott Wave Theory can be a powerful tool for analyzing and forecasting price movements. By identifying the 5-wave impulse and 3-wave corrective patterns, you can gain insights into potential market direction. Just remember to use it alongside other tools and indicators for confirmation, and don’t forget to manage your risk.
As you apply it to BTC/USD or any other asset, remember that the market doesn’t always follow the "ideal" patterns, and flexibility is key. Practice on different timeframes, refine your skills, and use the theory as a part of your overall trading strategy.
Final Thoughts:
If you're just starting, don't get discouraged if you miss a wave or two. Trading is a journey, and with patience and practice, you'll begin to spot these patterns more naturally. Whether you’re analyzing Bitcoin's price action or any other asset, Elliott Wave Theory can give you a deeper understanding of market psychology.
Good Luck and Happy Trading!

#AN017: Dirty Levels in Forex: How Banks Think
In the world of Forex, many retail traders are accustomed to seeking surgical precision in technical levels. Clear lines, pinpoint support, geometric resistance. But the truth is that the market doesn't move in such an orderly fashion.
I'm Forex Trader Andrea Russo, and I thank my Official Broker Partner in advance for supporting us in writing this article.
Institutions—banks, macro funds, hedge funds—don't operate to confirm textbook patterns. Instead, they work to manipulate, accumulate, and distribute positions as efficiently as possible. And often, they do so precisely at the so-called "dirty levels."
But what are these dirty levels?
They are price zones, not individual lines. They are areas where many traders place stop losses, pending orders, or breakout entries, making them an ideal target for institutional players. The concept of a dirty level arises from the fact that the price fails to respect the "perfect" level, but breaks it slightly and then retraces its steps: a false breakout, a trap, a hunt for stops.
Banks are very familiar with the behavior of retail traders. They have access to much more extensive information: aggregated positioning data, open interest in options, key levels monitored by algorithms. When they see concentrations of orders around a zone, they design actual liquidity triggers. They push the price just beyond the key level to "clean" the market, generate panic or euphoria, and then initiate their actual trade.
How are these levels identified?
A trader who wants to operate like an institution must stop drawing sharp lines and start thinking in trading bands. A dirty level is, on average, a zone 10 to 15 pips wide, around a psychological level, a previous high/low, or a breakout area. But technical structure alone is not enough. It's important to observe:
Volume density (volume profile or book visibility)
Aggregate retail sentiment (to understand where stops are placed)
Key option levels (especially gamma and maximum pain)
Rising open interest (as confirmation of institutional interest)
When a price approaches a dirty level, you shouldn't enter. You should wait for manipulation. The price often briefly breaks above that range, with a spike, and only then does it retrace its steps in the opposite direction. That's when banks enter: when retail has unloaded its positions or been forced into trading too late. The truly expert trader enters after the level has been "cleaned," not before.
This type of reading leads you to trade in the opposite way to the crowd. It forces you to think ahead: where they want you to enter... and where they actually enter. And only when you begin to recognize these invisible patterns, when you understand that the market is not linear but designed to deceive you, do you truly begin to become a professional trader.
Conclusion?
Trading isn't about predicting the price, but predicting the intentions of those who actually move the market. Dirty levels are key. Those who know how to read manipulation can enter profitably, before the real acceleration. And from that moment, they'll never look back.
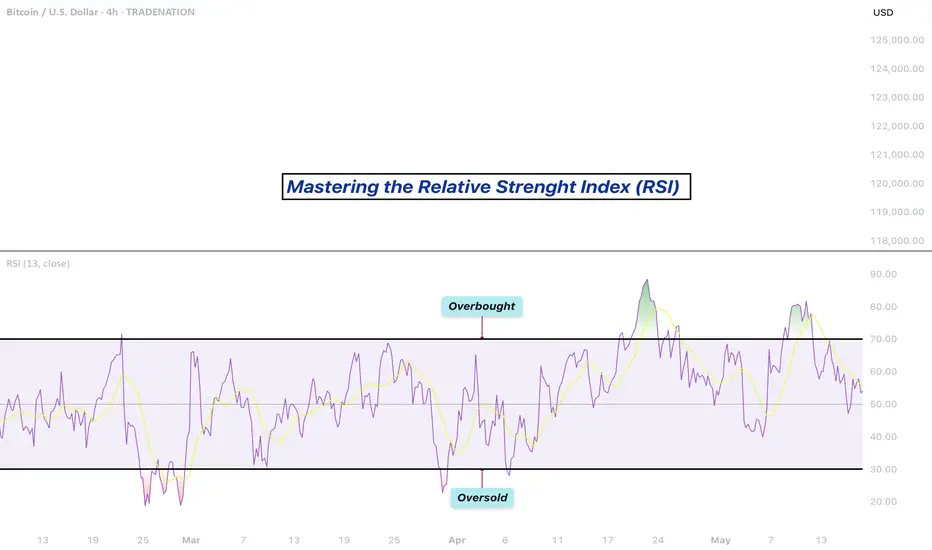
Mastering the RSI - How to use it in trading?What will be discussed?
- What is the RSI?
- RSI overbought
- RSI oversold
- RSI divergences
- How to use the RSI
- How to trade with the RSI
What is the RSI?
The Relative Strength Index (RSI) is a popular momentum oscillator used in technical analysis to measure the speed and change of price movements. Developed by J. Welles Wilder Jr., it ranges from 0 to 100 and helps traders evaluate whether a security is overbought or oversold. The RSI typically uses a 14-period timeframe and is calculated based on the average gains and losses over that period. A rising RSI suggests increasing buying momentum, while a falling RSI indicates growing selling pressure.
RSI overbought
When the RSI rises above 70, the asset is generally considered overbought. This condition indicates that the price may have risen too quickly and could be due for a correction or pullback. However, being overbought doesn't automatically mean a reversal will occur, it signals that bullish momentum is strong, and traders should be cautious of potential trend exhaustion.
RSI oversold
Conversely, an RSI reading below 30 is typically seen as a sign that the asset is oversold. This condition suggests the price may have fallen too sharply and could be primed for a rebound. Just like with the overbought condition, an oversold RSI doesn’t guarantee an immediate reversal but serves as a warning that bearish momentum may be overextended.
RSI divergences
Divergences occur when the RSI and the price of the asset move in opposite directions. A bullish divergence happens when the price makes a lower low, but the RSI forms a higher low, potentially signaling a reversal to the upside. A bearish divergence occurs when the price makes a higher high, but the RSI creates a lower high, possibly indicating a downward reversal. Divergences are often used to spot early signs of trend changes.
How to use the RSI?
To use the RSI effectively, traders typically look for overbought and oversold conditions to time entries and exits, combine it with other technical indicators for confirmation, and watch for divergences as a sign of potential reversals. RSI can also be adapted for different timeframes or strategies, depending on whether the trader is looking for short-term swings or long-term trend analysis. While it’s a powerful tool, RSI should not be used in isolation, it works best as part of a broader trading plan that considers market context and risk management.
How to trade with the RSI?
The RSI can be a powerful tool for identifying potential trade setups. When the price approaches a key support zone while the RSI remains in overbought territory, this may signal an early warning of a possible market reversal. However, rather than acting immediately, it's wise to wait for confirmation. A clear candlestick reversal pattern, such as a bullish engulfing candle or a pin bar, a provide stronger evidence that momentum is shifting. By combining RSI readings with price action and support levels, traders can improve the accuracy and timing of their entries.
Disclosure: I am part of Trade Nation's Influencer program and receive a monthly fee for using their TradingView charts in my analysis.
Thanks for your support.
- Make sure to follow me so you don't miss out on the next analysis!
- Drop a like and leave a comment!
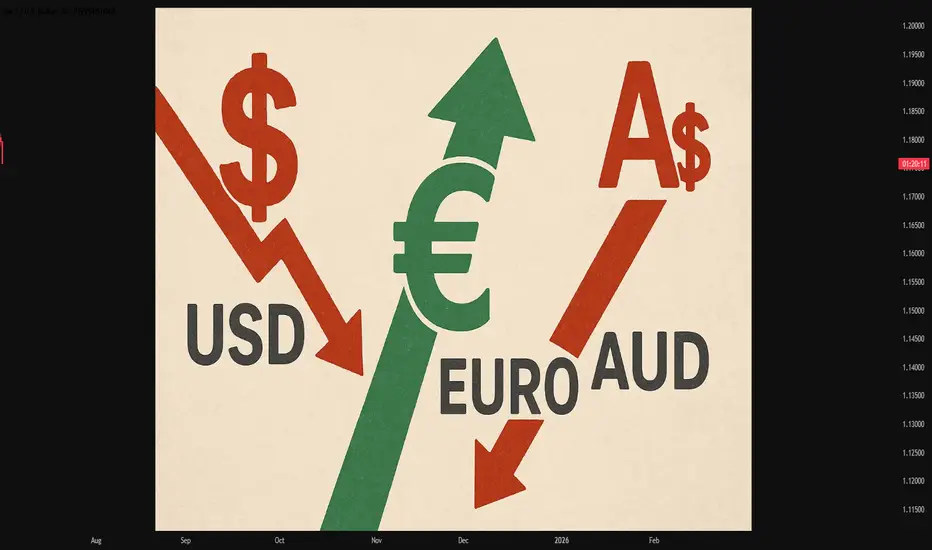
#AN013: USD and AUD under pressure, Euro advances
1. India: New strategy on FX volatility
The Indian Respondents' Bank (RBI) is allowing more volatility on the USD/INR exchange rate, prompting many companies to hedge with forward contracts. This is the highest level of coverage since 2020.
We thank in advance our Official Broker Partner PEPPERSTONE who supported us in writing this article.
FX Impact:
Potential weakening of the rupee in the short term, but increased stability in the medium-long term.
Volatility on USD/INR, EUR/INR, JPY/INR ? opportunities for carry trades and short-term shorts if the dollar strengthens.
2. Australia hit by extreme storms
Severe storms hit New South Wales, Queensland and Victoria: 100 km/h winds, torrential rains and blackouts on over 30,000 homes.
Australian economic sentiment pressured ? AUD weak.
Opportunities on AUD/USD, AUD/JPY and AUD/NZD from a short perspective.
Monitor agricultural and insurance developments ? risk of extended downside.
3. Iran: Fordow nuclear site severely damaged
US strike hits Iranian nuclear site. In response, Iran has threatened to mine the Strait of Hormuz, a critical point for global oil transport.
Geopolitical volatility expected to rise.
Increased flows to safe haven currencies: JPY, CHF and USD.
Also impacting CAD and AUD due to oil ? risk of short-term upside but corrections if stalemate persists.
4. US $3.3 trillion fiscal package under discussion
Senate considering mega stimulus plan. This fuels fears of new debt ? dollar falls to 4-year low against euro.
EUR/USD long strengthened (break above 1.17 already underway).
GBP/USD and NZD/USD potentially in push.
Risk of FED rate cut? increased volatility on dollar and bonds.
Strategic Conclusion
Recommended operations: long on EUR/USD, short on AUD/USD, long on USD/INR (only with confirmation).
Watch out for the next 48 hours: possible spike on CHF, JPY and CAD.
Institutional timing: probable fund inflows on EUR and USD in case of confirmed breakouts; stay ready but avoid front-running.
Stay updated for other news.

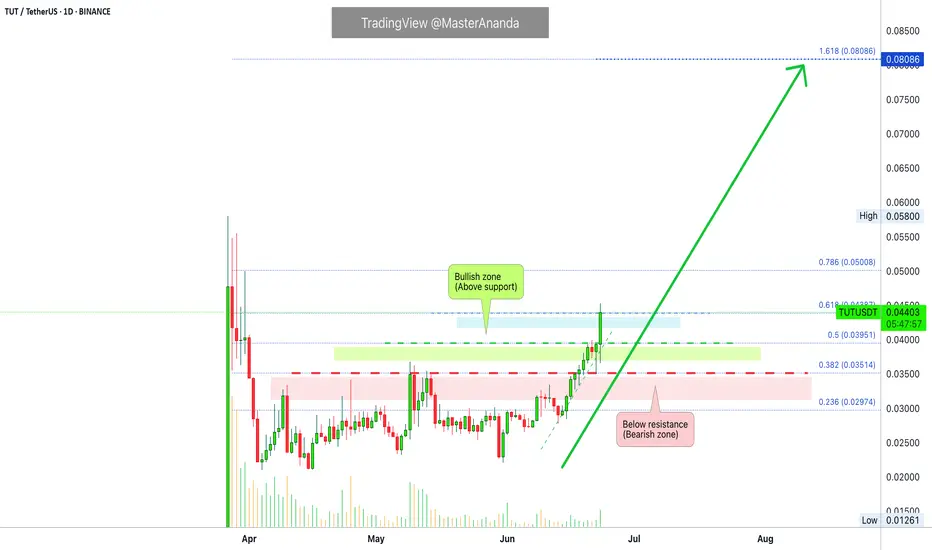
Tutorial Bullish Zone & Map (84% Easy Target Short-Term)Today TUTUSDT (Tutorial) has a combination of bullish signals.
It is moving above three strong support levels that were formally resistance. The red zone has been flipped, resistance turned support. The green and blue zones are yet a work in process. The action is happening above but the confirmation only comes ones the daily candle (session) closes above. That is, if today closes above 0.04387, this final resistance level has been flipped support.
Above 0.5 Fib. extension or 0.03951 is the bullish zone. TUTUSDT is now strongly bullish.
Today we have a full green candle and this is great, with rising volume. The highest volume since 1-June with room of course for it to go higher. We can easily see higher prices in the coming weeks and months.
Notice that this is a young chart, but if we couple marketwide action with short-term action, we can predict the next move. This is using the assumption that the market is one; what one does, the rest follows.
It is tricky but with practice you can predict how the market will move as well.
Thanks a lot for your continued support.
The next target stands at 0.08086. That's the main target short-term. An easy target I should say. Potential sits around 84% right now.
Namaste.
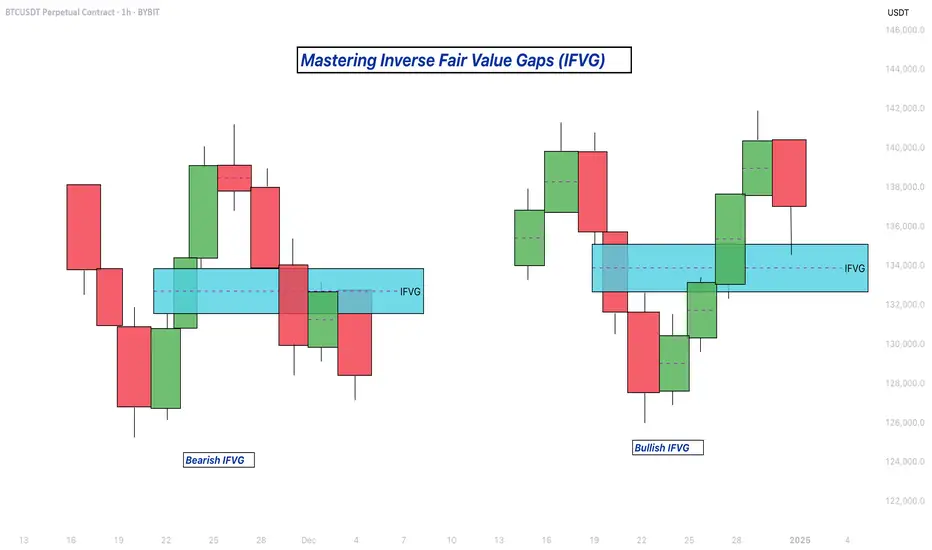
Mastering Inverse Fair Value Gaps (IFVG) - How to use them?In this guide, I’ll explain the concept of the Inverse Fair Value Gap (IFVG), how it forms, and how you can use it to identify high-probability trading opportunities. You'll learn how to spot the IFVG on a chart, understand their significance in price action, and apply a simple strategy to trade them effectively.
What will be discussed?
- What is a FVG
- What is an IFVG
- What is a bullish IFVG
- What is a bearish IFVG
- How to trade the IFVG
-------------------------------
What is a FVG?
A FVG is a technical concept used by traders to identify inefficiencies in price movement on a chart. The idea behind a fair value gap is that during periods of strong momentum, price can move so quickly that it leaves behind a "gap" where not all buy and sell orders were able to be executed efficiently. This gap creates an imbalance in the market, which price may later revisit in an attempt to rebalance supply and demand.
A fair value gap is typically observed within a sequence of three candles (or bars). The first candle marks the beginning of a strong move. The second candle shows a significant directional push, either bullish or bearish, often with a long body indicating strong momentum. The third candle continues in the direction of the move, opening and closing beyond the range of the first candle. The fair value gap itself is defined by the price range between the high of the first candle and the low of the third candle (in the case of a bullish move), or between the low of the first candle and the high of the third (in a bearish move). This range represents the area of imbalance or inefficiency.
-------------------------------
What is an IFVG?
An Inverse Fair Value Gap (IFVG) occurs when a traditional Fair Value Gap (FVG) is not respected by price, and instead of acting as a support or resistance zone, price breaks through it with strength. Normally, a Fair Value Gap represents a price imbalance left by a strong move, and when price returns to this area, it often reacts by respecting the gap, bouncing off it or reversing, because it's seen as a high-probability level where orders may rest.
However, in the case of an IFVG, price does not respect this imbalance. Instead, it slices through the FVG in the opposite direction, showing that the initial momentum behind the imbalance has weakened or reversed. This breach is a strong indication that market sentiment is shifting. What was once a zone of strength now becomes invalid, and this failed reaction signals that the opposite side of the market (buyers or sellers) has taken control.
The IFVG highlights a key transition in momentum. It tells traders that the prior bias, bullish or bearish, is breaking down, and the new dominant force is pushing price beyond levels that would typically hold. This makes the IFVG useful not only as a sign of failed structure but also as a potential confirmation of a trend reversal or strong continuation in the opposite direction. Essentially, where an FVG usually acts as a wall, an IFVG is what’s left after that wall gets knocked down.
-------------------------------
What is a bullish IFVG?
A bullish Inverse Fair Value Gap (IFVG) occurs when price breaks through a bearish Fair Value Gap (FVG) instead of respecting it. In a typical bearish FVG, the expectation is that when price retraces into the gap, it will react to the imbalance, usually by reversing lower, as the area represents previous selling pressure or inefficiency caused by aggressive sellers.
However, when price does not react bearishly and instead breaks cleanly through the bearish FVG, it signals a shift in market sentiment and momentum. This breakout through the imbalance suggests that buyers are now in control and that the bearish pressure in that zone has been absorbed or invalidated. What was once considered a resistance area is now being overpowered, often leading to continued bullish movement.
-------------------------------
What is a bearish IFVG?
A bearish Inverse Fair Value Gap (IFVG) occurs when price breaks through a bullish Fair Value Gap (FVG) instead of respecting it. In a normal bullish FVG, the expectation is that when price returns to the gap, it will act as support and prompt a move higher, as this area represents a previous imbalance created by strong buying pressure.
However, when price fails to respect the bullish FVG and instead breaks down through it, this signals a shift in momentum to the downside. The anticipated support fails to hold, suggesting that buyers are no longer in control or that their efforts have been overwhelmed by aggressive selling. This kind of move transforms the bullish FVG into a bearish signal, as it confirms weakness in what was previously considered a demand zone.
-------------------------------
How to trade the IFVG?
Trading the Inverse Fair Value Gap (IFVG) requires patience, precision, and clear confirmation of a shift in momentum. The process involves waiting for key conditions to form before entering a trade. Here's how to approach it step-by-step:
First, you need to wait for a liquidity sweep. This means price must take out a recent high or low, typically a short-term liquidity pool, trapping traders on the wrong side of the market. This sweep sets the stage for a potential reversal and indicates that the market is ready to shift direction.
After the liquidity sweep, watch for a 1-minute Fair Value Gap (FVG) to form and then get broken in the opposite direction. This break is crucial, it’s what creates the Inverse Fair Value Gap. The invalidation of this initial FVG confirms that momentum has switched and that the market is no longer respecting the previous imbalance.
Once the IFVG has formed, your entry comes on the close of the candle that breaks and closes beyond the IFVG, above it in a bullish scenario, or below it in a bearish one. This close confirms that the gap has not held and that price is likely to continue in the new direction.
Place your stop loss below the low (for a bullish setup) or above the high (for a bearish setup) of the structure that formed the IFVG. This gives you protection just beyond the level that would invalidate the setup.
-------------------------------
Thanks for your support.
- Make sure to follow me so you don't miss out on the next analysis!
- Drop a like and leave a comment!
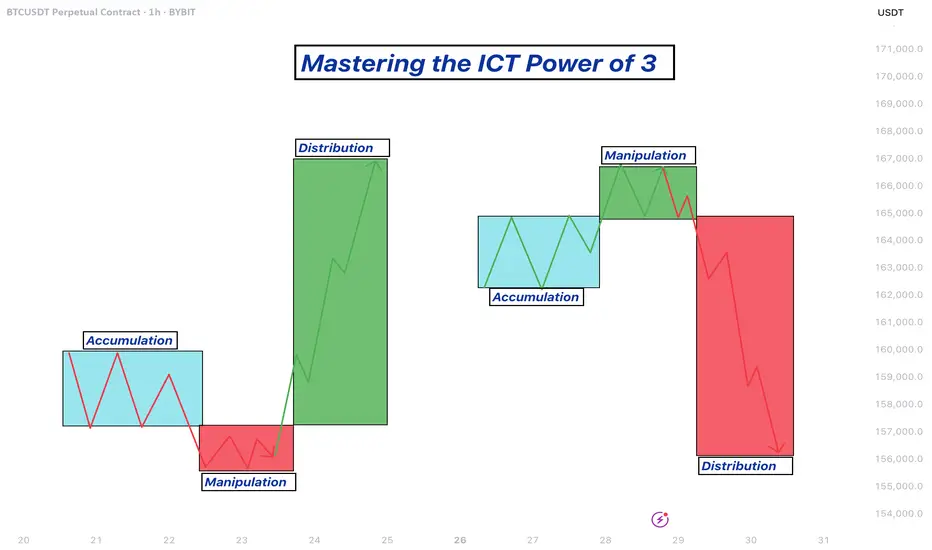
Mastering the ICT Power of 3 concept - How to use it in trading!The financial markets often appear chaotic and unpredictable, but behind the scenes, institutional players operate with clear strategies that shape price action. One such strategy is the ICT (Inner Circle Trader) "Power of 3" model, a framework used to understand and anticipate market cycles through three key phases: accumulation, manipulation, and distribution. This guide will break down each of these phases in detail, explaining how smart money operates and how retail traders can align themselves with the true direction of the market.
What will be discussed?
- The 3 phases
- Examples of the PO3
- How to trade the PO3
- Tips for trading the PO3
The 3 phases
Accumulation
The Accumulation Phase in the ICT "Power of 3" model refers to the initial stage of a market cycle where institutional or "smart money" participants quietly build their positions. During this time, price typically moves sideways within a tight range, often showing little to no clear direction. This is intentional. The market appears quiet or indecisive, which is designed to confuse retail traders and keep them out of alignment with the real intentions of the market's larger players.
In this phase, smart money is not looking to move the market dramatically. Instead, they are focused on accumulating long or short positions without drawing attention. They do this by keeping price contained within a consolidation zone. The idea is to gather enough liquidity, often from unsuspecting retail traders entering early breakout trades or trying to trade the range, before making a more aggressive move.
Manipulation
The Manipulation Phase in the ICT "Power of 3" model is the second stage that follows accumulation. This phase is where smart money deliberately moves the market in the opposite direction of their intended move to trigger retail stop losses, induce emotional decisions, and create liquidity.
After price has consolidated during accumulation, many retail traders are either already positioned or have orders waiting just outside the range, either stop losses from those trading the range or breakout orders from those anticipating a directional move. The manipulation phase exploits this positioning. Price will often break out of the accumulation range in one direction, appearing to confirm a new trend. This move is designed to look convincing, it might even come with a spike in volume or momentum to draw traders in.
However, this breakout is a false move. It doesn’t represent the true intention of smart money. Instead, it's meant to sweep liquidity, triggering stop losses above or below the range, and then reverse sharply. This stop run provides the liquidity needed for large players to finalize their positions at optimal prices. Once enough liquidity is collected, and retail traders are caught offside, the real move begins.
Distribution
The Distribution Phase in the ICT "Power of 3" model is the final stage of the cycle, following accumulation and manipulation. This is where the true intention of smart money is revealed, and the market makes a sustained, directional move, either bullish or bearish. Unlike the earlier phases, distribution is marked by clear price expansion, increased volatility, and decisive momentum.
After smart money has accumulated positions and shaken out retail traders through manipulation, they have the liquidity and positioning needed to drive the market in their desired direction. The distribution phase is where these positions are "distributed" into the broader market, meaning, institutions begin to offload their positions into the retail flow that is now chasing the move. Retail traders, seeing the strong trend, often jump in late, providing the liquidity for smart money to exit profitably.
This phase is typically what retail traders perceive as the real trend, and in a sense, it is. However, by the time the trend is obvious, smart money has already entered during accumulation and profited from the manipulation. What appears to be a breakout or trend continuation to most retail participants is actually the final leg of the smart money’s strategy. They are now unloading their positions while price continues to expand.
Examples of the Power of 3
How to trade the PO3?
Start by identifying a clear accumulation range. This typically happens during the Asian session or the early part of the London session. Price moves sideways, forming a consolidation zone. Your job here isn’t to trade, but to observe. Draw horizontal lines marking the high and low of the range. These become your key liquidity zones.
Next, anticipate the manipulation phase, which usually occurs during the London session or at the NY open. Price will often break out of the range, triggering stop losses above the high or below the low of the accumulation zone. This move is deceptive, it is not the real trend. Do not chase it. Instead, wait for signs of rejection, such as a sharp reversal after the liquidity grab, imbalance filling, or a shift in market structure on a lower timeframe (like a 1- or 5-minute chart).
Once manipulation has swept liquidity and price starts showing signs of reversing back inside the range or beyond, you now look for a confirmation of the true move, this begins the distribution phase. You enter in the direction opposite of the manipulation move, ideally once price breaks a structure level confirming that smart money has taken control.
For example, if price consolidates overnight, fakes a move to the downside (running sell stops), and then quickly reverses and breaks above a key swing high, that's your signal that the true move is likely up. Enter after the break and retest of structure, using a tight stop loss below the recent low. Your target should be based on liquidity pools, fair value gaps, or higher-timeframe imbalances.
The key to trading the Power of 3 is patience and precision. You're not trying to catch every move, but to wait for the market to complete its cycle of deception and then ride the clean expansion. Ideally, your entry comes just after manipulation, and you hold through the distribution/expansion phase, taking partials at key liquidity levels along the way.
Tips for trading the PO3
1. Learn price movements
Before you can effectively apply the ICT Power of 3 strategy, it’s crucial to have a deep understanding of how price behaves. This means being comfortable identifying market structure, recognizing trend direction, and interpreting candlestick dynamics. Since the Power of 3 is deeply rooted in how price moves in real time, a strong grasp of these basics will give you the confidence to read the market correctly as each phase develops.
2. Analyse multiple timeframes
Although the Power of 3 pattern shows up on lower timeframes, relying on just one can lead to misreads. You’ll gain a clearer picture when you align the short-term view with higher timeframe structure. For example, what appears to be accumulation on the 15-minute chart may simply be a retracement in a larger trend on the 1-hour or daily. By examining multiple timeframes together, you can better identify the true setup and avoid being tricked by noise.
3. Exercise patience
A key part of trading the Power of 3 is knowing when to act, and more importantly, when not to. It’s easy to get impatient during the accumulation or manipulation phases, but entering too early often leads to frustration or losses. True discipline comes from waiting for the expansion or distribution phase, when the market reveals its real direction. This is where the most favorable risk-to-reward setups occur.
Thanks for your support.
- Make sure to follow me so you don't miss out on the next analysis!
- Drop a like and leave a comment!
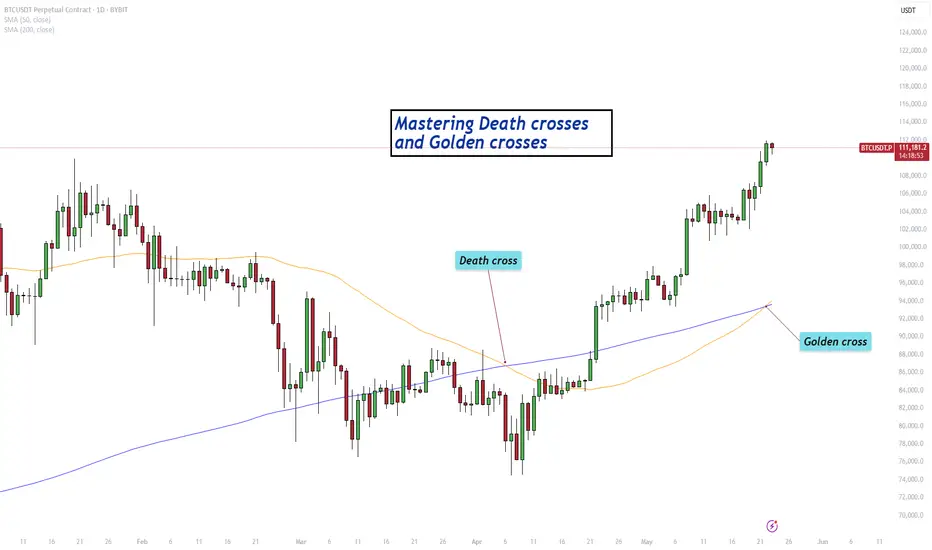
Mastering the Death cross and Golden cross - How to use it!In this guide I will discuss the Death crosses and Golden crosses. The next subjects will be described:
- What SMA to use?
- What is a Death cross?
- What is a Golden cross
- Is a Death cross always bearish and a Golden cross always bullish?
- How did the Death crosses and Golden crosses play out this cycle?
What SMA to use for Deathcross and Golden cross on the daily timeframe
In technical analysis, when identifying Golden Crosses and Death Crosses on the daily timeframe, the most commonly used moving averages are the 50-day and the 200-day simple moving averages (SMA). The 50-day moving average represents the average closing price of an asset over the past 50 trading days and reflects medium-term market trends. The 200-day moving average, on the other hand, represents the average over a longer period and is used to gauge the broader, long-term trend.
What is a Deatch cross?
A death cross is a bearish technical analysis signal that occurs when a short-term moving average crosses below a long-term moving average. Most commonly, it refers to the 50-day simple moving average crossing below the 200-day simple moving average on a daily price chart. This crossover suggests that recent price momentum is weakening relative to the longer-term trend, which can be an early indication of a potential downtrend or extended period of market weakness.
The death cross is often interpreted as a sign of increasing selling pressure and a shift in investor sentiment toward caution or pessimism. While it does not predict immediate declines, it is closely watched because it has historically preceded some significant market downturns. However, like all technical indicators, it is not infallible. Since it is based on past price data, the death cross is a lagging indicator, meaning it often appears after a downward trend has already begun.
What is a Golden cross?
A golden cross is a bullish technical analysis pattern that signals the potential beginning of a long-term uptrend. It occurs when a short-term moving average, typically the 50-day simple moving average (SMA), crosses above a long-term moving average, most commonly the 200-day SMA, on a daily price chart. This crossover suggests that recent price momentum is strengthening in relation to the longer-term trend, indicating growing investor confidence and increasing buying interest.
The golden cross is widely viewed as a positive signal by traders and investors, often marking a shift from a downtrend or consolidation phase to a more sustained upward movement. It reflects a change in market sentiment where shorter-term gains begin to outweigh longer-term losses.
Is a Death cross always bearish and a Golden cross always bullish?
The death cross is not always a purely bearish signal. While it reflects that price momentum has shifted to the downside, it's important to remember that moving averages are lagging indicators. By the time the crossover occurs, much of the downward move may already be priced in. As a result, it's common to see a relief rally shortly after the signal appears. This bounce can catch traders off guard, especially those who enter short positions expecting immediate continued weakness.
On the other hand, the golden cross often sparks a wave of bullish sentiment. Many traders see it as confirmation of a strong uptrend, leading to increased buying pressure. However, just like with the death cross, the lagging nature of the signal means that much of the initial move may have already happened. It's not unusual for the price to stall or even retrace shortly after the crossover, especially if the market has become overextended. In both cases, the market often reacts in a counterintuitive way in the short term, which is why these signals are best used alongside other tools and indicators.
How did the Death crosses and Golden crosses play out this cycle?
In this cycle, we’ve seen three death crosses and three golden crosses on the daily timeframe, with a fourth golden cross currently in the making. Interestingly, all three of the previous death crosses have not led to sustained downside as many might expect. Instead, each one has marked a local bottom, followed by strong upward movement in the weeks and months that followed. These signals, rather than being a reason for bearishness, turned out to be contrarian indicators. The most recent death cross occurred when Bitcoin was trading around 80k. From there, it managed to rebound impressively, climbing back above 111k, a clear reminder that death crosses, especially in this cycle, have not been reliable signals for further downside.
The golden crosses, on the other hand, have behaved a bit differently than usual in this cycle. The first golden cross actually marked a local top, with Bitcoin facing rejection shortly after. During the second golden cross, price action was more neutral, BTC moved sideways for a period before eventually continuing its upward trend. The third golden cross was followed by only a shallow pullback, after which Bitcoin pushed to new all-time highs.
Now, we are approaching the formation of the fourth Golden cross. Based on the pattern of past crosses and current market sentiment, a minor pullback could be on the horizon. It’s not guaranteed, but given the level of euphoria in the market right now, some cooling off would not be surprising. Even if a pullback does occur, the larger trend remains intact, and this golden cross may end up reinforcing that momentum.
Thanks for your support.
- Make sure to follow me so you don't miss out on the next analysis!
- Drop a like and leave a comment!
My First Look at the New 2025 TradingView Stock ScreenerI’ve made plenty of videos in the past covering the old TradingView Stock Screener - the one that used to sit below the chart.
In May 2025, TradingView moved the screener to the sidebar and replaced it with the standalone version previously accessed via the top menu. This video is my first walkthrough of the updated layout, and I’m talking through it as I figure out how it works and what’s changed compared to the older version.
For this example, I’m scanning for stocks that may have been oversold and are showing signs of recovery. I start with the MACD, looking for bullish crossovers where the MACD line moves above the signal line. I then add RSI and sort it from lowest to highest to highlight stocks that might have been more heavily sold off ie potential value plays. I also apply filters for price (between $10 and $100) and average daily volume (over 100,000) to avoid thinly traded penny stocks.
Hope you find it useful. This is my first look at the updated screener, so if I’ve missed anything, feel free to point it out.
zAngus

Lower Parallel Channel/Trendline tested again, 3rd time a charm?NOTE : I am not an expert trader by any means, I am open input and sharing my ideas. I am still learning this is my second time.
*************************************
DAILY
Price is consolidating or ranging
*************************************
4 HOUR
- Price seen between support and resistance
(DOWN/BEAR)
- Parrallel channel seen:
---- its height is around 5000 pips. a little more. (that i was able to measure)
---- with this being the 3rd test to its bottom line,, still hoovering in the lower channel, which could be bearish. however, it is looking like a rejection (as it is loosing momentum, and a doji is forming and likely to close as so.
---- yet, the channel is sell/short pattern. so next few candles may come with the moment and still turn, to go down
*************************************
In contrast (UP/ BULLS)
- Ukraine is about to begin to use btc as its national assest and an answer for that is pending soon. ( price will go up b/c this is good for this pair)
- two fake-outs seen at support
- the channel could continue sideways and actually go up
- or the channel will soon be invalidated, moving up, breaking thru top channel line.
*************************************
Right now, most technical indications are neutral, a this time for this pair. So lets wait and see.
*************************************
Happy trading.
Open to comments and advice.
*************************************

Mastering the MACD - How to use it in trading?The MACD, or Moving Average Convergence Divergence, is one of the most widely used technical indicators in trading. It was developed by Gerald Appel in the late 1970s and is designed to reveal changes in the strength, direction, momentum, and duration of a trend in a stock's price. At its core, the MACD is a momentum oscillator, though it is commonly plotted as a line chart rather than the traditional bounded oscillators like the RSI. Despite being unbounded, traders use the MACD primarily to identify potential buy and sell signals.
What will be discussed?
- How does the MACD work?
- How to use the MACD in trading?
- Divergences
- Conclusion
How does the MACD work?
The MACD is calculated by subtracting the 26-period Exponential Moving Average (EMA) from the 12-period EMA. The result of this calculation is the MACD line. A nine-period EMA of the MACD line, known as the signal line, is then plotted on top of the MACD line. The third component is the MACD histogram, which represents the difference between the MACD line and the signal line. The histogram gives traders a visual cue about momentum: when the histogram bars are growing in height, momentum is increasing in the direction of the MACD line; when they shrink, momentum is slowing down.
How to use the MACD in trading?
Understanding how to use the MACD in trading requires some interpretation of the relationships between these components. One of the primary signals traders look for is a crossover between the MACD line and the signal line. When the MACD line crosses above the signal line, it is considered a bullish signal, suggesting that it might be a good time to buy. Conversely, when the MACD line crosses below the signal line, it indicates a bearish signal and potentially a good time to sell. These crossovers tend to be more significant when they occur below or above the zero line, which is where the MACD and signal line are equal. A crossover below the zero line followed by a move above it could signal the beginning of an uptrend, while a crossover above the zero line followed by a move below it might signal a downtrend.
Divergences
Another important application of the MACD is identifying divergence between the MACD and the price action of the asset. Divergence occurs when the price is moving in one direction and the MACD is moving in the opposite. For instance, if the price makes a new high but the MACD forms a lower high, it can be a warning sign that the upward momentum is weakening and that a reversal could be on the horizon. Similarly, if the price hits a new low but the MACD makes a higher low, it might suggest a potential bullish reversal.
Conclusion
In summary, the MACD is a versatile and powerful indicator that helps traders analyze the momentum and direction of a market trend. Its ability to provide both trend-following and momentum signals makes it a valuable tool in a trader’s toolkit. While it is not a standalone solution, when used properly and in conjunction with other strategies, the MACD can greatly enhance the accuracy and confidence of trading decisions.
Thanks for your support.
- Make sure to follow me so you don't miss out on the next analysis!
- Drop a like and leave a comment!
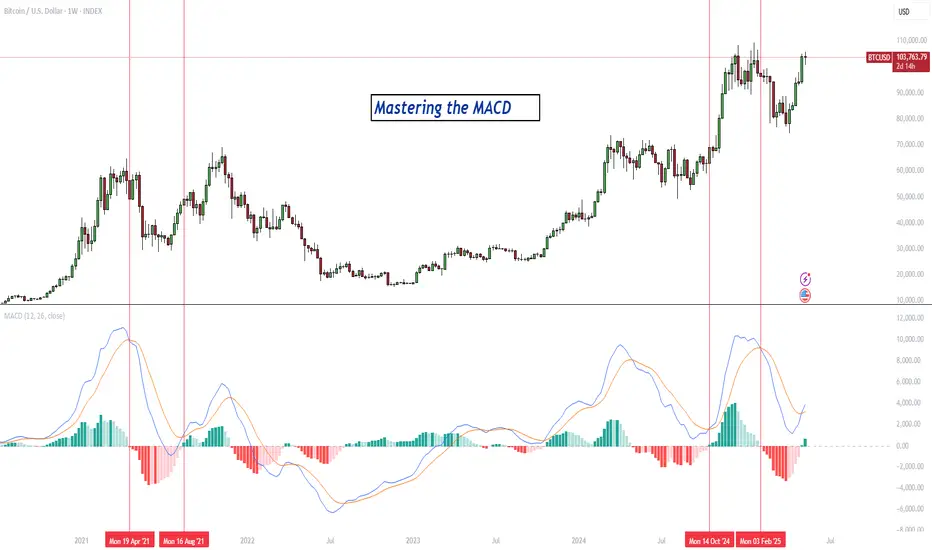
RISING WINDOW!As you can see at the big white arrow, we have an open window; A rising window. This is a very bullish indication, not to mention the bullish candlestick next to the previous candlestick, which is red. This is also very bullish. Be sure to set up your horizontal trend lines (as seen in this idea). Happy trading!
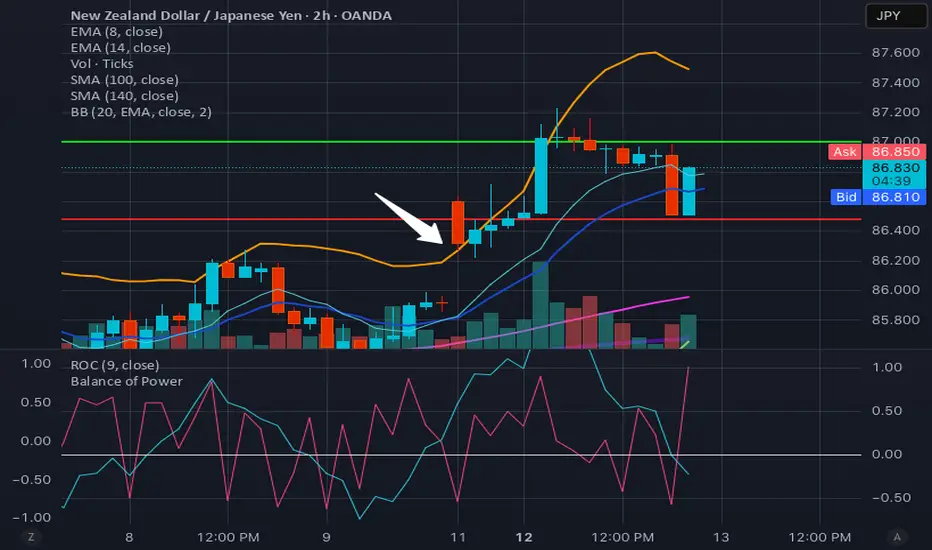
Mastering Fair Value Gaps (FVG) - How to use them in trading?In this guide, I’ll explain the concept of the Fair Value Gap (FVG), how it forms, and how you can use it to identify high-probability trading opportunities. You'll learn how to spot FVGs on a chart, understand their significance in price action, and apply a simple strategy to trade them effectively.
What will be explained:
- What is a FVG?
- How can a FVG occur?
- What is a bullish FVG?
- What is a bearish FVG?
- How to trade a FVG?
-------------------------------
What is a FVG?
A FVG is a technical concept used by traders to identify inefficiencies in price movement on a chart. The idea behind a fair value gap is that during periods of strong momentum, price can move so quickly that it leaves behind a "gap" where not all buy and sell orders were able to be executed efficiently. This gap creates an imbalance in the market, which price may later revisit in an attempt to rebalance supply and demand.
A fair value gap is typically observed within a sequence of three candles (or bars). The first candle marks the beginning of a strong move. The second candle shows a significant directional push, either bullish or bearish, often with a long body indicating strong momentum. The third candle continues in the direction of the move, opening and closing beyond the range of the first candle. The fair value gap itself is defined by the price range between the high of the first candle and the low of the third candle (in the case of a bullish move), or between the low of the first candle and the high of the third (in a bearish move). This range represents the area of imbalance or inefficiency.
-------------------------------
How can a FVG occur?
There are several factors that can trigger a fair value gap
- Economic news and announcements
- Earnings reports
- Market sentiment
- Supply and demand imbalances
-------------------------------
What is a bullish FVG?
A bullish FVG is a specific type of price imbalance that occurs during a strong upward move in the market. It represents a zone where the price moved so aggressively to the upside that it didn’t spend time trading through a particular range, essentially skipping over it.
This gap usually forms over the course of three candles. First, a bullish candle marks the beginning of upward momentum. The second candle is also bullish and typically has a large body, indicating strong buying pressure. The third candle opens higher and continues moving upward, confirming the strength of the move. The bullish fair value gap is the price range between the high of the first candle and the low of the third candle. This area is considered an imbalance zone because the market moved too quickly for all buyers and sellers to interact at those prices.
-------------------------------
What is a bearish FVG?
A bearish FVG is a price imbalance that forms during a strong downward move in the market. It occurs when price drops so rapidly that it leaves behind a section on the chart where little to no trading activity happened.
This gap is identified using a three-candle formation. The first candle typically closes bearish or neutral, marking the start of the move. The second candle is strongly bearish, with a long body indicating aggressive selling pressure. The third candle opens lower and continues the move down. The bearish fair value gap is the price range between the low of the first candle and the high of the third candle. That range is considered the imbalance zone, where price skipped over potential trade interactions.
-------------------------------
How to trade a FVG?
To trade a FVG effectively, wait for price to retrace back into the gap after it has formed. The ideal entry point is around the 50% fill of the FVG, as this often represents a balanced level where price is likely to react.
During the retracement, it’s helpful to see if the FVG zone aligns with other key technical areas such as support or resistance levels, Fibonacci retracement levels, or dynamic indicators like moving averages. These additional confluences can strengthen the validity of the zone and increase the probability of a successful trade.
Enter the trade at the 50% level of the FVG, and place your stop loss just below the most recent swing low (for a bullish setup) or swing high (for a bearish one). From there, manage the trade according to your risk-to-reward preferences—whether that’s 1:1, 1:2, or a higher ratio depending on your strategy and market conditions.
-------------------------------
Thanks for your support.
- Make sure to follow me so you don't miss out on the next analysis!
- Drop a like and leave a comment!