5-0 pattern. Bearish + 20% and bullish model + 51% Real tradingI must say almost all of this movement I took. Short + 8% (instead of 20%). At long + 55%, entry into the long was lower than shown in this example. I will attach the trading idea for which I worked below. She was published here on January 22. I used other methods of analysis and work, but I used this method that I want to talk about as evidence for my methods. The graph shows a bearish pattern , which immediately turns into a bullish 5-0 pattern, a very rare phenomenon. And that's why I decided to make this idea of training.
I want to say that the 5-0 harmonious pattern is very widely used in other markets, rarely in the cryptocurrency, due to the very low professional preparedness of the participants in this market.
Trading in this pattern can be either profitable or unprofitable, in the first place it depends not on the method itself, but on the person who uses this method. The 5-0 pattern is effective in areas of potential trend reversal. Just the pair ETH / BTC was in such a zone.
The profitability of trade largely depends not on the method of trading, but on the ability to use it.
________________________________________
A bit of history.
Harmonic patterns are the development of the idea of ordinary geometric patterns, using Fibonacci levels to more accurately determine pivot points . By the way, I almost never use the Fibonacci levels, as I see without them, what they show. For beginners in trading, it is better to use them.
By the way, who did not know initially in the father of harmonious trading Harold Gartley there were no Fibonacci levels. Only more than 80 years after the creation of the theory and the successful application of Larry Pesavento in practice, did Scott Kearney begin to pervert and sculpt exact numbers for each pattern that are far from real application on the market. It’s not customary to talk about this, but their main business is not real trading, but selling books, unlike Harold Gartley , who was a successful trader in the 20-30s during the Great Depression and became a millionaire! This is not an imaginary millionaire trader, a seller of courses and books, but a real trader who made all his fortune on real trading.
In mid-1935, Harold published his best work and the first book, which, translated into Russian, was called "Profit in the Stock Market."
The initial circulation of this book totaled only 1,000 copies. This book was very popular among traders, despite its very high cost. The book was worth 1,500 dollars, at that time it was possible to buy three new Ford cars for this amount. This is many times higher than $ 1,500 nowadays. One fact is that his books, which were being sold at the height of the Great Depression, let us understand how high authority he enjoyed among the people of the world of finance. The name of the pattern is Gartley Butterfly , which bears the name of its discoverer.
Already after the death of Harold, Billy Jones bought from Harold Gartley's wife the patent rights to the book “Profit in the Stock Market”, then continued to print it in large volumes. And a "perverse improvement" in working methods for making money on book sales started. That's why I have such a negative attitude towards such "specialists."
You have to be, not seem to be.
________________________________________________
5-0 pattern.
Pattern 5-0 is the youngest harmonious model (it is a variation of it with the Fibonacci grid thanks to traders of books on TA). The model usually represents the first pullback of a significant reversal trend. This is a relatively new model with 4 segments and specific Fibonacci measurements of each point in its structure, which excludes the possibility of a flexible interpretation.
Formation of the figure begins with a slight movement of the market, in the direction of a previously existing trend (segment AB), which was preceded by a comparable depth correction (XA). Point B, in this case, should not be higher than the level of 161.8% of point X. This is a fundamental point. If point B "goes" higher, then almost certainly the trader is dealing with short-term correction and the continuation of the existing trend.
The segment of the aircraft, in relation to the segment AB, is formed in the range between 161.8% and 224%.
The CD segment is a correction within the framework of an emerging trend. The correction depth (according to the classical pattern algorithm) should be 50% of the BC segment.
5-0 pattern template measurements:
The segment AB should be from 1,130 - 1,618. before the XA extension.
The segment BC should be a continuation of the segment AB from 1.618 to 2.240.
Point D should be formed at the level of 0.5 segment BC .
The segment AB must be equal to the segment CD, (AB = CD).
_______________________________________________
There are bullish and bearish formations of this pattern on the market. The graph shows both variants of the 5-0 pattern.
Bullish 5-0 pattern.
As you can see, the structure of the price movement at the time of the formation of the 5-0 pattern is generally very similar to the model of the Dragon figure with the development of goals. I made the ideas of training on this model of a figure and will fix it in ideas under the article.
Point 0 - the beginning of the downward movement, point X - the first correction upward, point A - the completion of the correction and the beginning of the fall down, point B - the end of the fall and the beginning of the strong upward movement, should be located at a level between 1.13-1.618 from XA, that the point C - the completion of a strong upward movement should be located between 1.618-2.24 from AB, point D is the end of the fall and the beginning of the upward movement, here we are trying to enter the market. The input should be at the level of 50% correction from the BC .
Bearish 5-0 pattern.
The structure of the bearish model of the 5-0 pattern is remotely similar to the model of an asymmetric head and shoulders or an inverted Dragon figure with a working out target.
Point O is the beginning of growth and the beginning of the formation of the model, point X is the beginning of correction down, point A is the beginning of growth and completion of correction, point B is the end of growth, should be located at the Fibonacci projection level between levels 1.13-1.618, point C is the end of a strong fall and the beginning of growth, point D - completion of growth, the place where we should open a deal for sale should be at the level of 50% correction from the BC .
Conservative traders are looking for additional confirmation before entering the trade. The 5-0 pattern can be either bullish or bearish . Goals can be set at the discretion of the trader, as the pivot point may be the beginning of a new trend. The common stop loss levels lie beyond the structure level beyond point D or the next important level for the Fibonacci sequence.
_______________________________________
Objectives for this pattern.
As it is a reversal pattern, which can act as a reversal pattern of the whole trend (the emergence of a new trend). You understand that there can be no clear goals, unlike simple figures. If you really get to the beginning of a new trend, the goals can be huge. It is important here not to exit the market prematurely. So that your profit does not turn into a loss, use the movement of stop-loss as the upward movement develops, but take into account the volatility of the instrument.
In this example, on the chart on the ETH / BTC pair, you can clearly see what the goals for this pattern can be.
The bearish model made a profit of + 20%
Channel support stopped a further drop in prices.
The bullish model made a profit of + 51%
The first goal is the resistance of the rising channel + 18%, as we see the price there was delayed for some time.
From this zone the reverse corrective movement to the support of the channel could take place. But, the price has successfully overcome this zone.
In total, the profit is + 51% of the entry point (point D).
In two models, the profit in theory was + 20 + 51% = + 70%.
But the reality is different, I have a profit of + 8% + 55% = + 60%
I rounded the interest for a better understanding, I will say one thing, there was no liquidity at the maximum to reset a significant position, and therefore the profit is much less than the theoretical one on the schedule.
______________________________________
Violations of the pattern 5-0 .
More than any other pattern, the 5-0 structure presents a unique opportunity for decision making when the area of opening positions breaks through. In all 5-0 models, the best moment to enter depends on various ratios within the structure. When trying to make a deal while forming an unsuccessful 5-0 pattern, the trader still needs to look at the prevailing trend and at models at smaller time intervals.
Of course, the 5-0 pattern is not an ultra-precise model, and it may not work out even in the most correct situations on the market. What to do if the price has broken through all levels and left the channel, in such cases, the authors of harmonious trading offer quality ideas for opening positions. The first target in this case may be the area of correction 0.886 from the entire movement. Therefore, if prices fell outside the channel and broke through the 50% area, then we should expect continued decline.
______________________________________
Advantages and disadvantages of pattern 5.0
Despite the popularity of this pattern, I would like to first consider the disadvantages of the pattern. The main of its shortcomings should be called the poor "recognition" of the figure. After all, not all formations in the real market, exactly correspond to the ideal book example. In this example, I used exactly the ideal option for the ease of presenting information, and a person who is interested in adding this pattern to his arsenal of trading can also look for more complex formations for work. I would advise beginners to look for ideal models for work, as they are more predictable.
The developers and "popularizers" of the pattern emphasize its versatility. In their opinion, the pattern works with equal efficiency on any trading instruments and at any time intervals. If in the first part this statement is undeniable, then with regard to timeframes, the use of the pattern raises many questions.
On short timeframes, this pattern is not effective due to the high content of "white noise" and which does not allow to clearly identify and build the boundaries of the pattern.
Over long periods of time, the created corridor is so wide that, in fact, it can only indicate the direction of the trend (and even then in the long term). Thus, the efficiency of using this figure very much depends on the correctly selected timeframe. The ideal timeframe for work is 4 hours-1 day.
Remember the most important thing, this 5-0 pattern is effective in areas of potential trend reversal.
_____________________________________
I wrote above that I will attach trading ideas for this pair that I worked on.
Which trading ideas made it possible to take profits in shorts + 8% and long + 55%.
1) This one worked in short when the head and shoulders formed. Published November 24th.
ETH / BTC Pivot Points . Ascending Triangle - Head and Shoulders
Result in short + 8%
2) The trading idea for which he worked in long. Published January 22.
ETH / BTC Coin operation. Reversal zones. Double bottom .
The result is now + 55%, the entrance was practically at the very minimum price when confirming support.
Perhaps we will see a reversal of the main trend by ETH18, if the price closes above the downtrend line (red line).
Also, in the idea of training on this graph, you probably all noticed which figure is being formed and how much you can earn from fulfilling its target.
Remember, trading is a game of probabilities.
Who trades from the situation created in the market - earns.
Who trades on the basis of what he wants - receives a loss.
The crowd trades out of their desires, not market probabilities. The crowd always loses.
From the pixels of thinking of individuals, a way of thinking of the crowd is created.
Thanks to the thinking and desires of the crowd, we earn.
The more stupid a society is, the higher the percentage of earnings in it is smart.
To earn, you need someone to lose money. No other way.
Under the article, I have fixed 31 learning ideas.
I didn’t even know that I already have so many of them.
Knowledge and experience are power!!!
Tutorials

Tutorial- Don't think like the herd......Ask yourself, what would the herd think like base on the information presented to you. Learn to recognize clickbaits and emotional attachments to the info...

Tradingview Drawing Tools (part 2)In this tutorial, we take a look at the Trend Line Tool and the Gann & Fibonacci Tools. Again, I discuss how to change the individual settings as well as how to save it as a template.

Tradingview Drawing Tools (part 1)In this tutorial, I show you where the different drawing tools are located, how to show/hide them, and how to delete them. I also begin showing you how to change their individuals settings so that they are only visible on specific time frames and how to change their individual styles.

Tradingview Timezones, Alerts, and Moving Multiple ChartsIn this tutorial, I show you the basics of changing your charts' order if using multiple charts at once, how to change your timezone, and how to setup alerts on your charts.

Tradingview Time, Chart Layout, and Candle typesIn this tutorial, I show you the basics of changing your chart's layout, time intervals, and candle types.

EurJpy bearish divergence, sell approaching set up .Eurjpy looks to be in an ideal sell set up looking at divergence, resistance zone plus trend line we can hope that it drops to tp 1 and 2 indicated by the green dotted line.
This also fits in nicely with our chfjpy sell that we have active. And just to touch on that be patient guys its normal for this to happen possibly a sl hunt by the bigger players, we just need to be patient. But be sure to stick to your risk management as that is the most important.
Today is my Bday so im going out, hope yall have a wonderful day.
Dev.

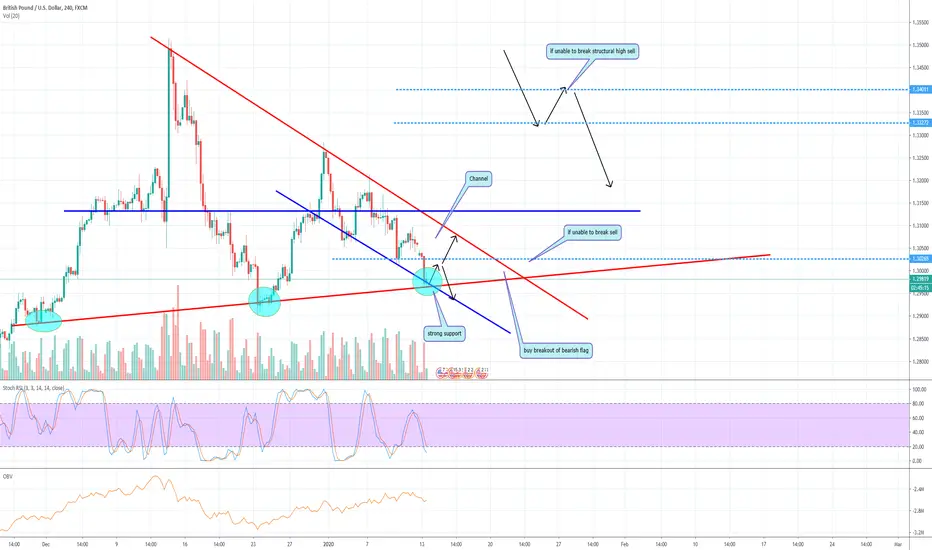
GBPUSD : my thought proccess for upcoming moves.after a successful analysis on the big drop that took place due to consolidation (phase1 for those who understand)
now we can trade phase 3 which should be a strong up but when I don't know yet.
that's why I have drawn out plans hopefully we see some positive results.
its my birthday in a few days so I wont be trading but god luck to everyone else :)
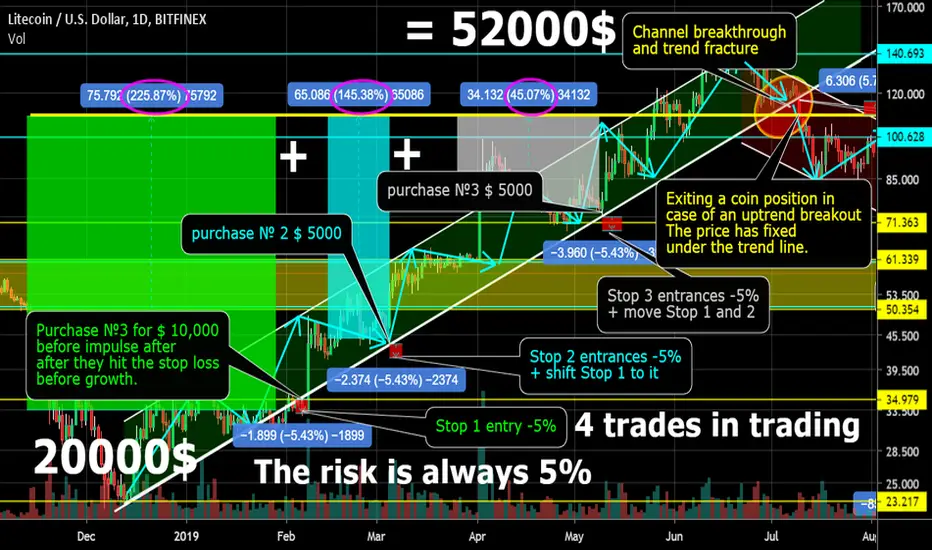
Pyramiding How to earn 52000 with a risk of 5% from 10000 1partPyramiding. How to earn $ 52,000 with a risk of 5% from 10,000 1 part. LTC/USD Jobs in Long.
Money management by pyramiding or scaling.
When building a "Pyramid" from money using the pyramid method - your foundation of the pyramid is knowledge and experience.
One of the main features of this method is minimal risks with high rates of income.
In let's look at an example on the chart. LTC is a strong uptrend. Entering a transaction is not from the bottom of the price itself, but when the trend is confirmed. Trading only according to the trend, exit of the price for trend aisles - means exit from the position. Stop loss is always 5% below the uptrend line that you are trading. As the price rises, the stop loss pulls up. This is very similar to positional trading. But unlike position trading, you buy an asset as the trend develops, thereby increasing the position.
From the example, we see that $ 20,000 is allocated for the coin. They are broken into at least 3 parts. 1 entry is the largest at the beginning of the trend-$ 10,000. The next 2 entries as the uptrend develops for $ 5,000. Risk is absolutely always observed 5% of the position. Breaking the uptrend line means a complete exit from the long market position. If you are not sure that the trend has finally reversed, you can exit part of the position.
In this example, the profit was $ 52,000 + $ 32,000 net. I also want to emphasize, we did not buy at the very lowest prices and did not sell at the very peak of the price, 2 transactions were done quite already at an expensive price. The main thing is to follow the plan, understand what you are doing and what is happening. It is necessary to kill the “herd instinct” in oneself, try to buy the cheaper, sell the more expensive, buy for good luck, work without a strategy and plan. You work like everyone else - it will be like everyone else - nothing!
________________________________________________________
Pyramid mechanics in numbers.
The amount allocated for this coin is $ 20,000. Broken into 3 parts $ 10,000, $ 5,000, $ 5,000.
Profit from purchase №1 of $ 10,000 + 225% = $ 32,500 (net $ 22,500).
Profit from purchase №2 5000 $ + 145% = $ 12,250 (net $ 7250).
Profit from purchase No. 3 of $ 5000 + 45% = $ 7250 (net $ 2250).
Total profit for all 3 purchases $ 52,000
Net profit $ 52,000-$ 20,000 = $ 32,000
The risk has always been 5%
Next, I will describe in more detail this method and all the nuances.
_______________________________________________________________
Money management by pyramiding or scaling.
The pyramiding method of money management (scaling) today is very popular among traders with experience. The essence of this method is the sequential opening of several transactions on the trend. We increase our position as profit grows, not loss.
Pyramiding method of money management is perfectly combined with a positional trading strategy. Also, this method increases the deposit well when a trader trades in upward (long work) and downward channels (short work).
Pyramid trading is a strategy that involves adding a new position to an existing profitable position. In other words, these are purchases or sales in order to add to an existing position, after the market has developed movement in a profitable direction for you. You are increasing your position. At the same time, the size of each next transaction may change taking into account the result of the previous one, that is, the position increases when you make a profit in the previous transaction to increase the deposit at a faster pace or after receiving a loss to accelerate the exit from the drawdown.
This is the main advantage of using pyramiding in trading. If you did everything right, then do not expose your trading capital to additional risk. In fact, you reduce risk as the market moves in a profitable direction for you. The main thing is to correctly determine the trend and "sit" on it. The most difficult moment is to determine the beginning of a trend.
On a bull trend it is better to always work on the bull side; on a bearish trend, on a bearish side. Always follow the trend!
However, just as pyramiding can be profitable, it can also be dangerous if used improperly. The main thing is to determine the trend correctly.
Many experienced traders consider this method the only possible way to quickly disperse the "deposit". One well-defined trend lasting only 1-2 weeks can double, triple the deposit with the right approach. Moreover, the risk is only 2% -5%.
It is very important, do not confuse averaging and pyramiding, since these two approaches are completely different. Averaging occurs when the price goes against our position. And pyramiding is the other way around when the price is in your favor.
Pyramiding allows you to achieve a super effective profit / risk ratio by transferring stop loss as the trend moves in your favor.
______________________________________________________
How to carry out a set of positions according to the trend, when to enter.
Another important issue in pyramiding is: when do you actually enter a deal, gain a position more? The answer to this question can be divided into several approaches. Each of them has its pros and cons and in different situations will give different results. Just who is comfortable and who is more used to what they trade.
Entrance to the transaction during the construction of the "pyramid":
1) On kickbacks.
2) On signs of continued movement. For example, it can be a powerful volume entry or a hammer candlestick pattern.
3) During the breakdown of important levels.
___________________________________________
How to use stop loss when building a "pyramid".
Naturally, with pyramiding, stop loss is used. It is recommended to use a separate stop for each entry (to buy the position). As the trend develops, it should be pulled up.
For example, I use 2 stop loss. Regardless of how much I had as the trend of inputs on kickbacks grew. The first is the top, which is about 30% of the entire position. As a rule, it is equivalent to the stop loss level of the last entry (buy by trend). The second is 70% of the position, this is when the trend breaks. Both stop losses are tightened as the trend grows.
It is logical to use stop loss outside of some important levels. The trader as a whole should decide on the overall risk that he is ready to bear. For example, it is 3% -5%. Therefore, it is necessary to calculate the following positions in such a way that, taking into account the profit of the previous steps, compensate for the loss of the subsequent ones and keep within 3% -5%.
You need to understand that with the correct determination of the trend, and the correct scaling of the pyramid, a loss of 3-5% is purely arbitrary, as long as you have a stop knocked out, you can already double or triple the total profit. The main thing with the price increase is not to forget to tighten the stop loss. And so put so that they are not knocked ahead of time. As a rule, I go out when stop loss is touched, just two, as the first one can knock out, and the price can go up further.
It is also worth adding that sometimes on some coins due to their volatility, their feet are knocked out by 5%, so that this does not happen, the size of the stop is not so important as the moment of entry.
________________________________________________
Profit taking.
How to take profit when managing money using the pyramid method? There are several different methods of closing positions:
1) According to the planned profit. For example, you planned to take profit + 100% from this tool. You have reached your take profit. We left the position, took profit and forgot about this tool.
2) With a slowdown in profit growth . For example, you have already doubled the profit on this trend and this is quite enough for you. The trend has moved in a lateral movement, profit is not growing, or growing slowly. It is more advisable for you to close this profitable deal and transfer the profit to the trend that is emerging, thereby building a new "pyramid" on a more rapidly growing trend.
3) At the first sign of a trend reversal. Not breaking through important resistance levels, reversal patterns, breaking the trend line.
4) By tightening stop loss. Knocked out stop loss . Depending on which stop loss ordering technique you use, either single or fractional for each entry separately. Stopped, took profits and forgot about this trading tool. They began to search for a new instrument with a good entry point at the stage of trend emergence. Started the construction of a new "pyramid".
In my opinion, a reasonable solution is to partially take profit at some maximum levels with the trend growing. I am also part of the position about 30% aggressively trading increasing the asset. An important point at local maximums I sell these 30% almost completely, I already shop a large amount of assets from the support if I trade in an uptrend. As the trend progresses, I constantly pull up the lower stop loss (main position). 70% of the position is exited when the trend unfolds completely.
_______________________________
Benefits of money management by pyramiding or scaling.
Pyramiding works well with strong steady trend movements.
The advantages of pyramiding:
1) the bistro is increasing the deposit.
2) minimal risks, and with the development of a trend, there are no risks.
3) psychologically comfortable trading due to the absence of great risks.
_____________________________________________________________
Disadvantages of money management by pyramiding or scaling.
As you already understood, pyramiding works well in the trending market. If the market turns into a flat or a trend movement is accompanied by deep pullbacks, then the pyramid can be destroyed very quickly. On few liquid, weak instruments, this method does not work! On cryptocurrencies, this method only works on TOP. Coins such as BTC, LTC, ETH.
This method does not work:
1) In lateral flat movement.
2) With a weak trend.
3) In a trend with deep pullbacks, in which there will be uncertainty about further movement and they will knock out stops.
_______________________________________________________________
To be continued...
FM price action in a boxIt seems like black magic sometimes how the squares of math lines up with future price. But, using the Gann box can help you look right instead of left. That is powerful.
Trade safe
M~

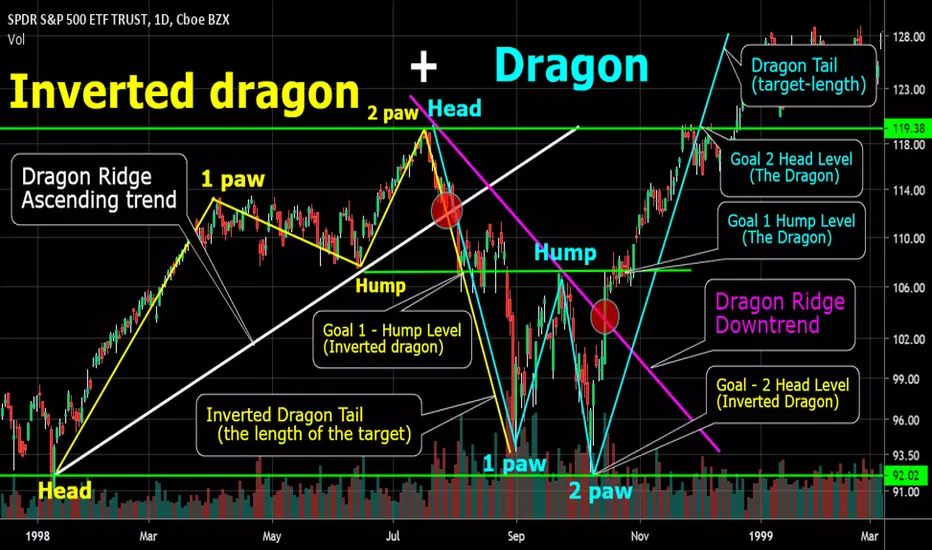
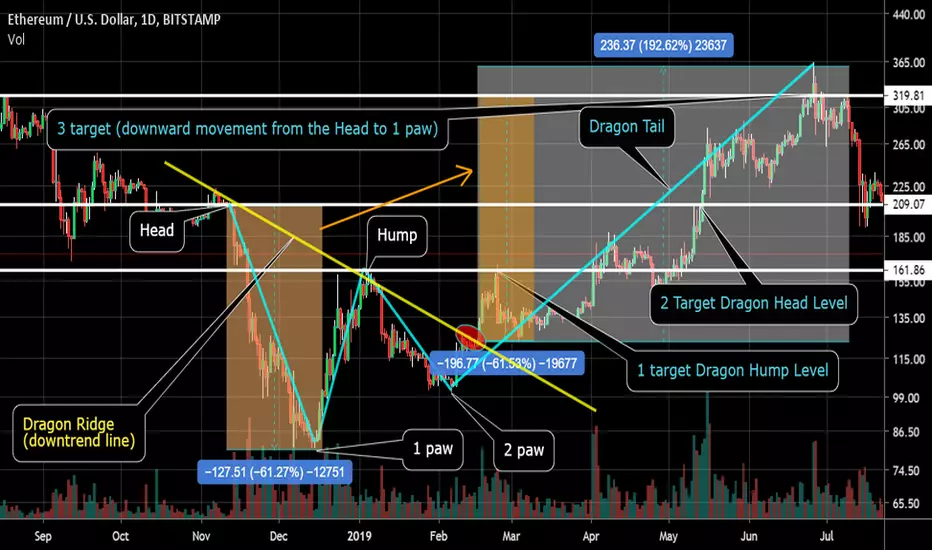
Simultaneously Figures Inverted Dragon and DragonOn the graph you can see how one figure goes into another and all goals are fully fulfilled.
The figure of the technical analysis "Inverted Dragon " all the description, lines, goals on the graph are yellow.
The figure of the technical analysis " Dragon " all the description, lines, goals on the chart are blue.
In trading such figures, the most important thing is the trend lines ("Dragon Ridge"). In this example, "Inverted Dragon" has an upward trending white color. And the figure "Dragon" has a downtrend in purple.
Also, when trading and identifying a figure, zones of a trend break are very important, in this example they are indicated by red circles.
_________________________________________________
About the figure "Dragon" I described in great detail in the article: Figure Dragon. Formation. Structure. Goals.
Read more in this tutorial.
In this article I want to describe the mirror image of the “Dragon” figure - this is “Inverted Dragon”.
The “Inverted Dragon” / “Dragon” figures got their name due to some resemblance to a fairy-tale character: he also has a head, two legs, a tail and a hump on his back.
The figure "Inverted Dragon" consists of 5 parts, formed in the following order:
1) Dragon Head - the minimum price of all parts of the figure;
2) The first paw of the Dragon is the local maximum price;
3) The Hump of the Dragon - the minimum price between its paws;
4) The second paw of the Dragon is another maximum located slightly below / above the first paw, in rare cases equal to the maximum of the first paw;
5) Dragon Tail is the target price that should bring you revenue.
_____________________________________________________
“Inverted Dragon” is a reversal pattern that indicates almost the very beginning of a trend reversal. The formation of the “Inverted Dragon” tells the trader that the mood in the market may change soon and the current trend will unfold.
The figure is a more modified version of the “Double Peak” figure, while signaling a change in the bull market to the bear market. But there is one fundamental difference from the “Double Peaks” figure.
A prerequisite for the formation of the Dragon is a trend line drawn through the head and hump of this model ("Dragon Ridge").
It is important that this trend line is clearly visible on the chart. The trend line plays an almost decisive role in the figure.
“Inverted Dragon” and “Dragon” with the correct identification and understanding of the work, you can get good profit on various time frames.
The “Inverted Dragon” shape and its mirror image “Dragon” are very similar to the “Double Peak” and “Double Bottom” figures, however, they also have significant differences, which will be described below.
_______________________________________________
Stages of the formation of the figure.
The "Inverted Dragon" is formed on an uptrend. Its formation begins with the "Head". It represents a local minimum. After the formation of the "Head", the market continues an upward movement, as a result of which two maximums "1 paw" and "2 paws" successively appear on the price chart. (Two peaks).
The local maximum from the first test of the resistance line at the upper border of the figure forms "1 Dragon's paw." After repeated testing of the same level of resistance, "2 paws of the Dragon" is formed. The difference between the maxima of the first and second "paws" can be from a few percent to 5-10%.
Between the paws of the "Dragon" should be formed a hollow (bottom, local minimum - correction from the upward movement), which is called the "Hump of the Dragon." At its core, the formation of the “Head – Lap – Hump – Lap” ligament is a “Double Peak” reversal pattern.
The close of the formation of the “Inverted Dragon” figure is indicated by the closing of the price below the “Dragon Range” - a trend line (support) drawn along its points from the “Head” and “Hump”. This will be a signal of a trend reversal. It is advisable to wait until the candle, after crossing the line, closes below the "Hump" level (the price has fixed).
__________________________________________________________
Shape shaping and volume change.
As prices move from head to forepaws, volumes rise, confirming the uptrend that existed at that time. But already with the formation of the hump of the dragon, everything changes. Volumes begin to grow in the direction of the downtrend and decrease in the direction of the upward. This indicates an imminent change in trend.
Finally, an additional confirmation signal can be an increase in the trading volume, which should increase during the price breakthrough of the uptrend of the “Inverted Dragon” figure (support). This is a breakdown of the trend line that connects the points of the “Dragon Head” and “Dragon Hump”. And then the price drop in the direction of the dragon's tail is accompanied by a rapid surge in volume, which finally confirms the trend reversal.
True price movements are always accompanied by an increase in the volume indicator. This means that if volumes grow in the direction of the dragon's tail (the direction of the future trend) and decrease in the direction of the previous trend, then the future trend is definitely gaining strength and the “Inverted Dragon” figure is true.
___________________________________________
Setting targets when working with a figure.
There are two options for entering a deal:
1) Entrance when breaking the line of the "Dragon Range" of the uptrend (line- "Head" - "Hump").
2) Entrance when breaking through the level of "Hump of the Dragon.
___________________________________________
First target.
To be at the level of the last minimum - the level of "Hump".
The second target.
To be at the very minimum value of the figure - the level of "Head".
The third target.
In rare cases, this is the entire length of growth from the “Head” to the very top “Paw” - then from the point of breakdown of the ascending trend line (“Dragon Ridge”), we establish the entire length of the previous growth — this will be the last target of the “Dragon Tail”.
In this example, the graph shows only taking 2 goals. Only in 10% of cases, 3 is the target relevant, for this you need a very strong trend movement.
_____________________________________________
There should be a strategy and plan. At the same time, your strategy and plan should be plastic from market situations.
Dragon figure. Formation. Structure. Targets.“Dragon” is a reversal pattern that indicates almost the very beginning of a trend reversal. The formation of the Dragon tells the trader that market sentiment may change soon and the current trend will unfold.
The figure is a more modified version of the "Double bottom" or "W" shape, while it signals the change of the bear market to the bull market. But there is one fundamental difference from the “Double Bottom” figure.
A prerequisite for the formation of the Dragon is a trend line drawn through the head and hump of this model ("Dragon Ridge").
It is important that this trend line is clearly visible on the chart. The trend line plays an almost decisive role in the figure.
“Dragon” and “Inverted Dragon” with the correct identification and understanding of the work, you can get good profit on various time frames.
The figure “Dragon” and its mirror image “Inverted Dragon” are very similar to the figures “Double top” and “Double bottom”, however, they also have significant differences, which will be described below.
________________________________________________
There are two types of this figure, depending on the trend:
1) “Dragon” - is formed during a downtrend and signals a trend change to an uptrend;
2) “Inverted Dragon” - is formed during an uptrend and signals a trend change to a downtrend .
___________________________________________________
The figure "Dragon" got its name due to some similarities with the fairy-tale character: he also has a head, two legs, a tail and a hump on his back.
The figure "Dragon" consists of 5 parts, formed in the following order:
1) Dragon Head - the maximum price of all parts of the figure;
2) The first paw of the Dragon - a local minimum price;
3) The Hump of the Dragon - the maximum price between its paws;
4) The second paw of the Dragon is another minimum located slightly below / above the first paw, in rare cases equal to the minimum of the first paw;
5) Dragon Tail is the target price that should bring you revenue.
____________________________________________________
Additional signals that confirm the trend reversal and enhance the development of the "Dragon" figure:
1) The ratio of the length of the "dragon's paws" - if the "second paw" is longer, then there is more confidence in the upcoming turn.
2) When the level of the "second paw" coincides with some important level of support / resistance, already tested in the past, this also enhances the development of the figure.
3) Candles are strongly pronounced (large bodies with short shadows) that have gone in the opposite direction after the formation of the "second paw", the greater the likelihood of a change in the current trend.
4) The more a trend exists, the more likely it will end. The “Dragon” pattern is often in the 5th wave of the trend and in this case the reversal signal is very reliable.
5) An additional confirmation signal can be an increase in the indicators of the trading volume, which should increase during the break through the price of the downward trend line of the “Dragon” figure (resistance). This is the line drawn from the top of the Dragon Head to the bottom of the Dragon Hump.
__________________________________________
Setting goals when working with a figure.
There are two options for entering a deal:
1) Entrance when breaking the line of the "Dragon Range" of the downtrend (line- "Head" - "Hump").
2) Entrance when breaking through the "Hump of the Dragon" level.
__________________________________________
Now you need to decide on our targets:
The first targets will be at the level of the last maximum - the level of "Hump".
The second target will be at Head level
The third target is, in rare cases - the full length of the fall from the “Head” to the lowest “Paw” - then from the breakdown point of the downward trend line (“Dragon Ridge”) we set the entire length of the last price
See the chart above. The graph shows that it was the Third Goal that worked completely on the graph.
A little about my trade-18 (The logic of price movement)I continue to talk about my trading principles.

A little about my trade-17 (Simplifying the trading model)I continue to talk about my trading principles.

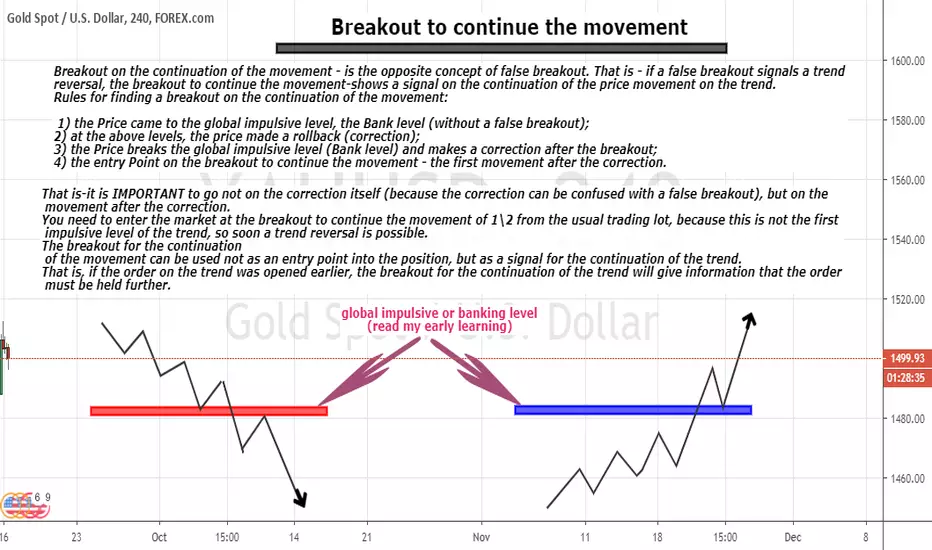
A little about my trade-16 (Breakout to continue the movement)I continue to talk about my trading principles.
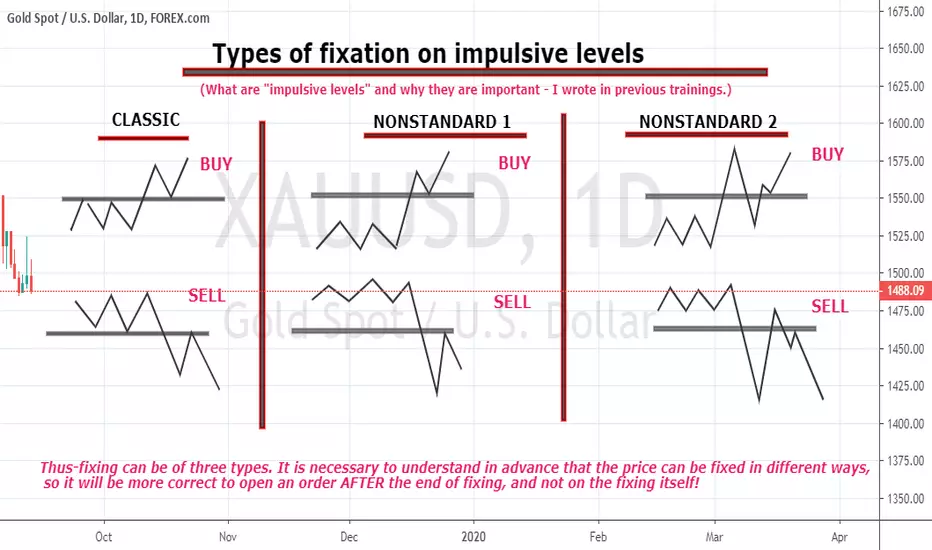
A little about my trade-15 (fixation on an impulsive level)I continue to talk about my trading principles.
A little about my trade-14 (Where to wait for the reversal!)I continue to talk about my trading principles.
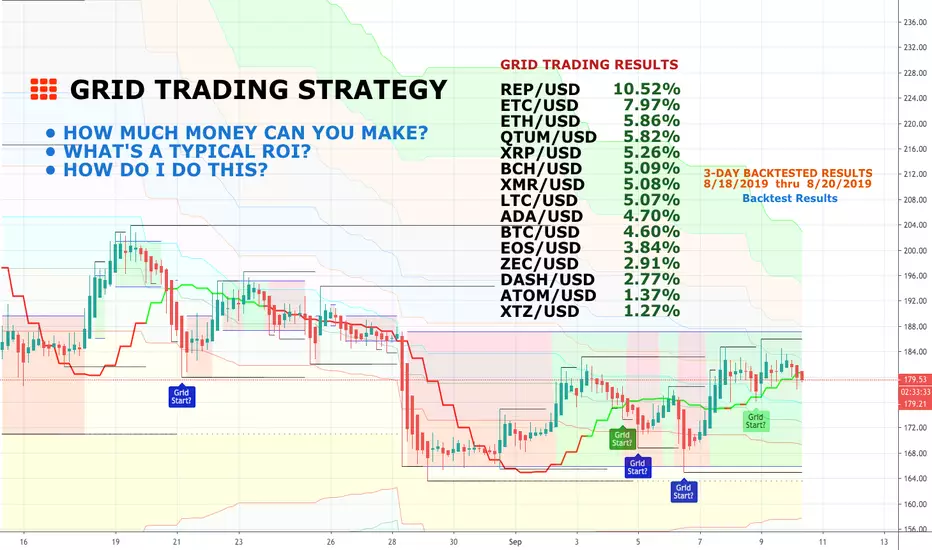
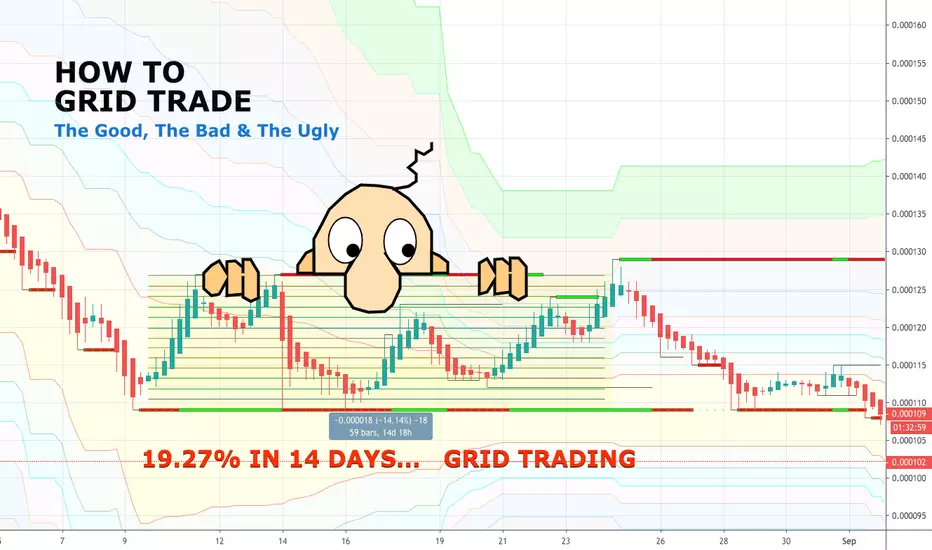
HOW TO GRID TRADE: The Good, The Bad and The Ugly (Tutorial #5)HOW TO GRID TRADE:
The Good, The Bad and The Ugly (Tutorial #5)
DID YOU KNOW?
The cryptocurrencies you’re holding right now could be generating passive income. Even if you have small holdings or limited capital THIS can become very profitable with a little known strategy called GRID TRADING.
EXAMPLE: 11-DAY GRID TRADE EARNS 19.27% PROFIT
EASY TO LEARN, LOW RISK & HIGH RETURNS? WHAT'S THE CATCH?
If you have not read my previous tutorials on grid trading , I’ll summarize the concept quickly. Grid trading is a type of trading, typically managed by a BOT which sounds a lot more complicated than it is.
In a nutshell, you select a range, you divide your range into equally spaced buy/sell grids (like trip wires, sorta) . And as price zigzags up and down, your “trip wires” trigger buys and sells - catching profits for you incrementally all along the way! If you are able to start your grid as the market ranges sideways (which is 70% of the time) or when it is in a gradual upward ranging trend (15% of the time) then you are going to make money most of the time. That leaves about 15% of the time when the market is ranging downwards (and even then, many times grid trading can still produce a profit) .
Grid trading requires far less skill and less management than most other types of trading -PLUS- it has far less risk. Not to mention, most grid traders make better returns on their money with grid trading than they do with any other trading strategy.
Can you lose money grid trading? YES, but with a little knowledge, losing money is hard!
OK IT'S EASY PEASY, BUT HOW DO I DO THIS?
You'll need a gird bot automation platform to manage this, but once you've got that... there are only a few parameters you must setup to get started with your grid bot trades. And if you start with a small investment, the learning process is rather fun. Once you get the hang of it, you can increase your investment. The sky is the limit.
1) GET YOUR GRID TRADING BOT (recommendations below)
2) PICK THE CRYPTOCURRENCY PAIR which you plan to trade.
3) SELECT YOUR RANGE. It's called your “trading channel” - and while this can vary depending on the crypto asset you select, it can also vary based on your trend bias and available capital. Just as a thumbnail guide, you might trade a top 10 cryptocurrency pair within a 4% to 8% trading channel, whereas a low cap coin pair might merit a 1% to 50%+ trading channel.
4) DETERMINE A GRID SPACING or GRID COUNT which basically divides your range into a series of buy and sell grid lines. As the price of an asset moves up or down within your range, the bot will execute trades. Each time the price moves up over a grid line the bot will execute a sell order. Each time it moves down over a grid line it executes a buy order. As long as the price stays within the upper and lower price limits that you have pre-set, you will profit from the zigzag of the market.
5) A STOP LOSS is optional and may not be needed at all, but it is a parameter you must think about and set, if you feel you need it. If you are trading a coin that you don’t mind holding, a stoploss is not needed. Advanced strategies can reduce almost all possibility of loss!
NOTE: Trying to grid trading manually is near impossible. It is highly recommended you use a trading bot to carry out your grid trading strategy.
NO BOTS ABOUT IT...
Grid trading bots automate the process and maximize your potential profits. Your bot will automatically place buy and sell orders at pre-set price points you map out upfront. As you go along, your bot will replace grid line open orders as each previous grid level (line) is executed. You simply need to set your upper and lower price limits (your range) for your trading channel, decide how many grids you want, and how much of the asset you’ll invest in. Once your parameters are entered, your bot can be started and you can sit back and watch profits add up.
For example, if you chose to trade BTC/USD, then you'll start by buying BTC and you'll simultaneously place limit sell orders along your grid. This is easy because your bot will automate the entire strategy.
You can of course get very good at this type trading and make an impressive income however, at the most basic level, all you need to know to start Grid Trading today, is what you’ve just read, perhaps a few more tips from my other grid trading tutorials and if you're smart, you'll try grid trading indicators.
Additional resources are found below.
HOW DO I LEARN MORE?
1) Review my related IDEAS and TUTORIALS (linked below)
2) Explore GRID INDICATORS (linked Below)
PLEASE HIT THE LIKE BUTTON (and follow me... just look below the chart at top... yes, up there where "Kilroy" is watching!)
As always, I appreciate your support. Please share with others.
ENJOY!
Dan Hollings
Master Crypto Grid Trader
Please Explore My Other Indicators, Scripts, Grids and Educational Ideas.
@ DanHollings on Tradingview.
A little about my trade-13(how to work with "lock" when you rol)I continue to talk about my trading principles.

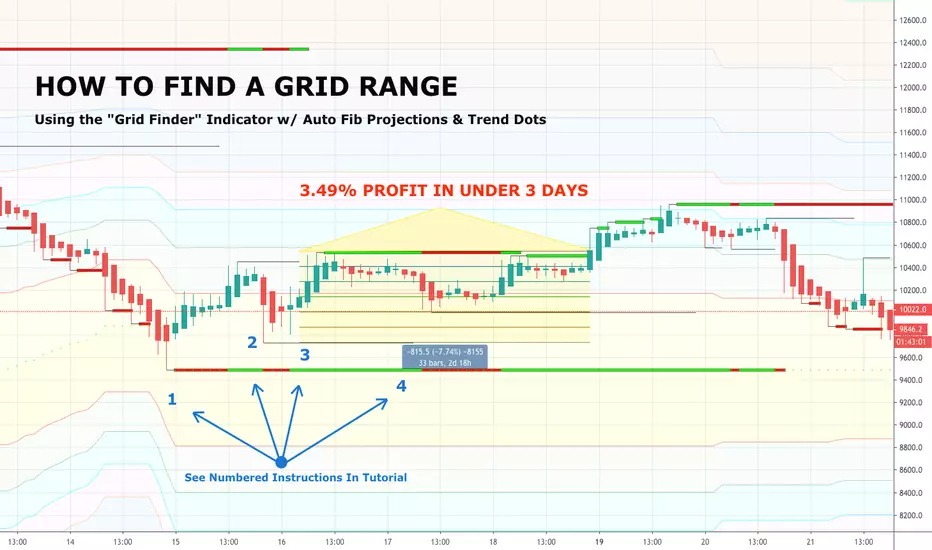
HOW-TO GRID TRADE: How-to Find A Profitable Grid (Tutorial #4)HOW-TO GRID TRADE:
How-to Find A Profitable Grid
Using The "Grid Range Finder" Indicator.
WHAT TO LOOK FOR...
The best GRIDS are placed in sideways channels, consolidation areas, ranging markets and slowly upward trend areas. In seeking a place to start your next grid, you should seek out support areas, preferably during a sideways or upwardly trending time period. It's near impossible to predict how long this type market condition might last, but the ideal grid will run for 2 days+. Some grids can run for months!
Did you miss my previous GRID TRADE tutorials? ( Start from the beginning )
ESTABLISH A RANGE
Your next task is to determine a range depth for your grid (I suggest 4% to 8% as measured on the chart - though you may find other measurements better depending on the crypto you're trading, the average market volatility and your available capital) . This is why, when using the "GRID RANGE FINDER INDICATOR" you'll appreciate the "Auto-Fibonacci Lines" added to help in projecting how high or deep your range might go. In most cases, your range should span between either support and resistance or a nearby Fibonacci line.
Once you've discovered your range "sweet spot" and a good starting point, "box out" a projected grid range that has logical support, resistance and fib parameters with a span (bottom to top) that does not spread your capital too thin nor expose you to too excessive risk.
GRID YOUR RANGE
In Tradingview, you can easy create a range box using the "Date and Price Range Drawing Tool" or the "Rectangle Drawing Tool." If you want to create actual grids in your range box, you can use the "Gann Box Drawing Tool" and play around with the settings if you are hard core. At the end of the day, this is only to give you a rough idea anyways. Your actual grid range area is automatically create in your Crypto Grid Trading Bot within minutes after setting up a few parameters (simple, simple) . So don't over do the time invested in drawing on your TV chart, keep it quick and simple. Find your range, put the parameters in your Bot and start making money!
HELPFUL TOOLS
THE GRID RANGE FINDER INDICATOR is ideal for traders pursuing this type GRID TRADING strategy. Yes, it's true that the trading process itself is typically automated, however the first and most important step for you, is to find a sideways, consolidating, ranging or slowly upward trending market. Review the other GRID TRADING tutorials I've published so that you can master this fascinating (and profitable) trading style. It's not that hard and it's well worth the effort.
THE GRID RANGE FINDER INDICATOR will assist you in scouting-out market opportunities where a grid opportunity may be waiting. This indicator provides support and resistance lines for both long and short term price action, plus uniquely incorporates red and green COLORED trend tendencies in both the support and resistance lines, as well as in "Trend Dots" at the bottom of chart.
TIPS FOR HOW TO USE THIS INDICATOR
TO HELP FIND OPTIMAL GRID TRADING OPPORTUNITIES
Use this indicator in combination with other indicators to fully maximize your results.
First zoom out and determine the overall structure and phase the market is in (long term) .
Remember, GRIDS perform best in sideways or slow upward ranging trends. Look for this.
THERE ARE NUMEROUS WAYS TO USE THIS INDICATOR
BELOW IS ONE WAY, TO GET YOU STARTED:
The STEP NUMBERS below are illustrated on the charts above.
1. Watch for a major support point.
2. Followed by a higher minor support point.
3. Start grid during GREEN trend indication (as seen on indicator trend dots or trend support line)
• If using Heikin Ashi candles (recommended) start grid on a GREEN candle
4. Map out your grid range of 4% to 8% using Support & Resistance lines and/or Auto-Fibonacci lines on chart.
This is not a "SIGNAL" type indicator, it is a valuable tool (or aid) designed to assist you in conjunction with other indicators and market knowledge. Some grid traders use ONLY this one indicator, but you should evaluate the others I've created which may help you refine your grid start parameters and opportunities. For additional help there are details below.
PLEASE HIT THE LIKE BUTTON (and follow me... lots of great stuff in the works!)
As always, I appreciate your support. Please share with others.
ENJOY!
Dan Hollings
Master Crypto Grid Trader
Please Explore My Other Indicators, Scripts, Grids and Educational Ideas.
@ DanHollings on Tradingview.
HOW-TO GRID TRADE: Show Me The Money (Tutorial #3)HOW-TO GRID TRADE:
Show Me The Money (Tutorial #3).
When I started this Grid Strategy Tutorial Series , I assumed readers would understand the profit potential straight away. I was wrong! Perhaps, because as I told my personal story and evolution into grid trading, I mentioned that I used grid trading for my "side money" (money I was not actively trading with other strategies). Yes, that's true. Initially, I just wanted an ROI on this otherwise dormant extra capital that was sitting at an exchange earning nothing.
NOTE: If chart illustration above overlaps or is unreadable, there is a screenshot below.
MY EPIPHANY
It was when my passive "Grid Trading Side Project" started earning a better ROI than my hands-on active trading that I had my epiphany! No way was I going to give up on the other styles of trading I enjoyed, but when it comes to making money consistently and with far less risk... hands-down, it was grid trading I decided to master.
A TUTORIAL SEGWAY
I decided I'd throw some backtest results out so you could get a taste of what I'm talking about. Of course, the backtests posted here are in NO WAY predictive of what the market might deliver at your doorstep tomorrow, but I think you get the point. Many hundreds of real people have also shared there active results with me, so there is ample validation about the viability of this strategy.
My personal results and those of others I coach are impressive, to say the least. However, we've lost money too, IT'S CRYPTO TRADING for crying out-loud. But like anything, you keep at it, you learn from others, you use indicators, you get better, you win some, you lose some, you master it and then... the winning results will exceed your losses. It doesn't take long at all. And YES, there's money in them there grids!
MORE RESULTS...
HOW TO I SEE MY POTENTIAL PROFIT?
Want more current results? Want to test your favorite coins? DO IT NOW... You may test any cryptocurrency at any of your favorite exchanges and get instant backtest results by visiting a grid bot or automation platform. Backtests are simple, fast and impressive.
THIS IS THE THIRD IN A SERIES OF GRID STRATEGY EDUCATIONAL TUTORIALS
I hope this tutorial series helps increase your bottomline!
HOW DO I LEARN MORE?
1) Review my related IDEAS and TUTORIALS (linked below)
2) Explore my GRID INDICATORS (linked Below)
HOW DO I AUTOMATE MY GRID STRATEGY?
Additional help and recommendations are at the bottom of this tutorial.
PLEASE HIT THE LIKE BUTTON (and follow me... lots of great stuff in the works!)
As always, I appreciate your support. Please share with others.
ENJOY!
Dan Hollings
Master Crypto Grid Trader
Please Explore My Other Indicators, Scripts, Grids and Educational Ideas.
@ DanHollings on Tradingview.