USD/CAD) Down Trand Read The captionSMC trading point update
Technical analysis of USD/CAD (U.S. Dollar / Canadian Dollar) on the 1-hour timeframe, with a focus on a potential double-top formation at strong resistance, followed by a drop toward support:
---
Analysis Overview
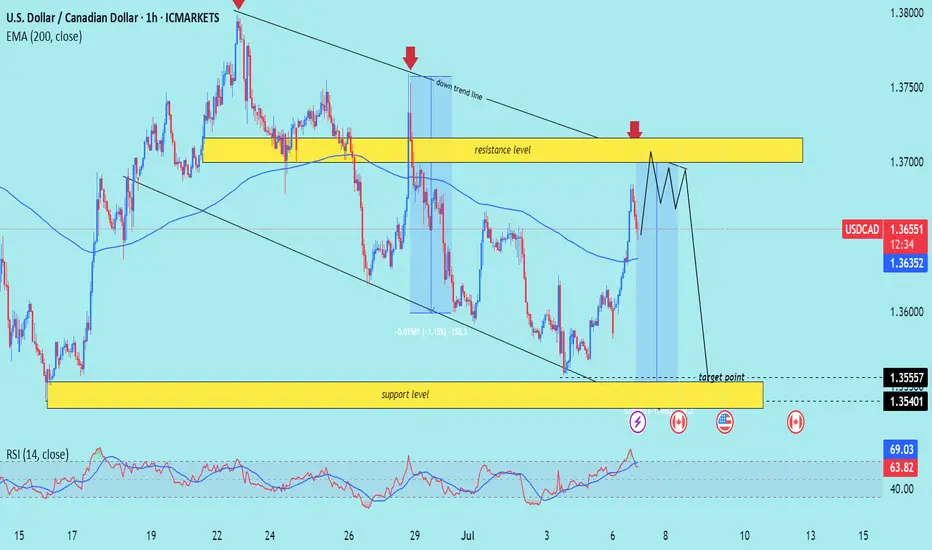
Trend Structure: Downward-sloping channel with lower highs and lower lows.
Confluence Area: The current rally is approaching both the upper channel boundary and a significant horizontal resistance zone (~1.3660–1.3700).
---
Key Technical Elements
1. Resistance & Double-Top Setup
The price nears the resistance zone (yellow) where it previously reversed (noted by red arrows).
A cap-and-float pattern (double/top-like structure) is projected: price pushes higher, hesitates, tests resistance again, then fails—a sign of weakening bullish momentum.
2. EMA 200 Interaction
The 1-hour EMA 200 (blue line at ~1.3635) sits just below current price.
A failure to sustain above this level reinforces the bearish case.
3. RSI Overextension
RSI (14) is around 64–69, indicating near-overbought conditions on this timeframe, suggesting a potential pullback.
4. Price Targets
Initial target: Lower channel boundary near 1.3556 (highlighted support).
Extended target: Beneath to 1.3540, aligning with the broader Demand zone.
---
Proposed Trade Setup
Step Action Level
Entry Short near top of resistance/channel (after double-top confirmation) 1.3680–1.3700
Stop-Loss Above recent high and channel resistance ~1.3720
Take Profit 1 Near EMA 200/lower channel bounce ~1.3556
Take Profit 2 Extended move to demand zone ~1.3540
Estimated Move ~1.15% drop from midday highs –
---
Risk & Event Factors
Scheduled Canadian or U.S. data releases (icons shown) could introduce volatility and disrupt technical patterns.
A breakout above ~1.3720 would invalidate this bearish thesis and shift bias bullish.
Mr SMC Trading point
---
Summary
Expecting a cap-and-float double-top formation at key resistance near 1.3660–1.3700, followed by a trend continuation drop toward 1.3556–1.3540. The bearish setup is supported by a down-channel structure, EMA 200 failure, and overbought RSI conditions.
Please support boost 🚀 this analysis)