UBER unusual options activity for $70 1/2022 - bullish long termUBER on 4H: Will UBER hit $70 before 2022?
RECENT NEWS
UBER tumbled last Friday after Britain’s top court said its drivers should be treated as “workers” rather than contractors.
TECHNICAL OBSERVATIONS
UBER has been trading within an upward channel. We are sitting at support, watch to see if we can move up here. One concern is if we pullback further, there is a gap below $55 which we may attempt to fill.
OPTIONS ACTIVITY
This week there were $40.50 Million worth of Uber calls bought. One that jumps out to me was a LEAP options $70 strike price expiring 1/21/22 because there were $37.3 Million worth of those purchased last Wednesday.
SUPPORT & RESISTANCE
Support: $58 | $55 | $53
Resistance: $60 | $63.40
Uberstock


UBER - Rising WedgeThis usually occurs when a security’s price has been rising over time
The trend lines drawn above and below the price chart pattern can converge to help a trader or analyst anticipate a breakout reversal. While price can be out of either trend line, wedge patterns have a tendency to break in the opposite direction from the trend lines.
Therefore, rising wedge patterns indicate the more likely potential of falling prices after a breakout of the lower trend line. Traders can make bearish trades after the breakout by selling the security short or using derivatives such as futures or options, depending on the security being charted. These trades would seek to profit on the potential that prices will fall.
You will learn the best place where we can trade this instrument at low risk.
Write in the comments all your questions and instruments analysis of which you want to see.
Friends, push the like button, write a comment, and share with your mates - that would be the best THANK YOU.
P.S. I personally will open entry if the price will show it according to my strategy.
Always make your analysis before a trade

😭 Sorry Guys... Kind Of Late On (UBER)💰 LET'S GET INTO SOME UBER ANALYSIS!💰
1️⃣ First off SMASH that LIKE BUTTON & Give us a FOLLOW for DAILY ANALYSIS! ❤❤❤
(Overall Market Sentiment) 🐻 Bearish
- Man I wish I would of had checked this one on the daily chart about a week ago. Beautiful crossover Crossover ema dots played out. No worries, let's catch the new wave!
- We are getting a red Crossover with an engulfing candle, this would good be a good short but we need to consider how close we are to support. I would rather look for the breakout on the 31.50 support to go short for most likely a 10-13% play to the next low.
- We so have one previous touch at 31.50 and rebounded but not by much! Let's see how it holds up. If it did hold and compressing with a green Crossover we will go long based off of the fact we did have that recent support.
- All 3 ema dots are firing red.
Drop your chart below in the comments section and share with us what you think will happen next! ❤❤❤
Thanks for checking out our analysis! ✌😁✌
🥇MLT | MAJOR LEAGUE TRADER

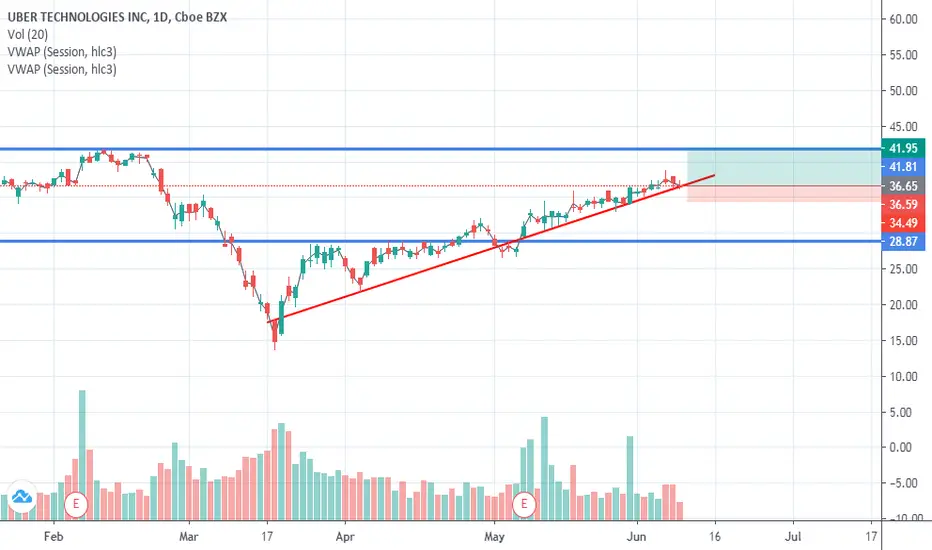
Uber Short- Long technical analysisNYSE:UBER
Pullback occurred next week gap will be filled and I marked the PT.
Stay Tuned

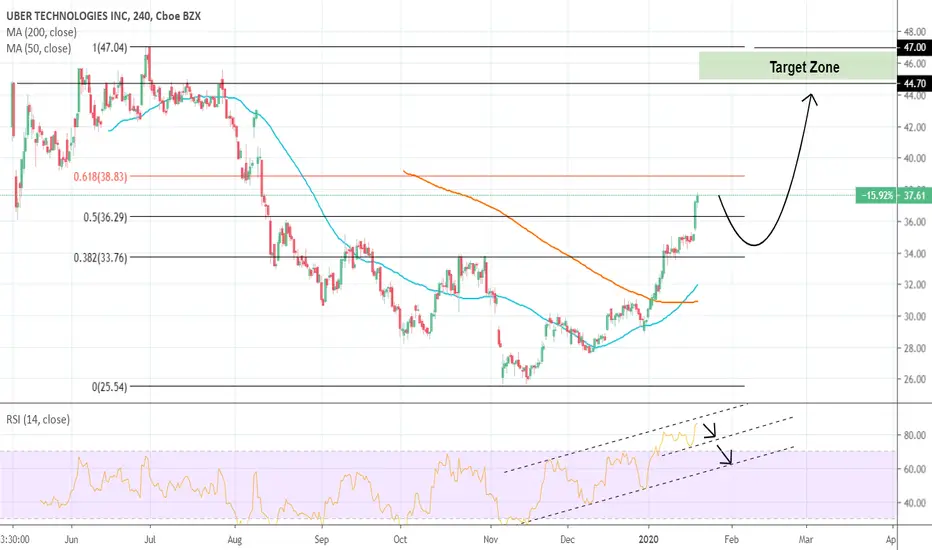
UBER: Close to the 0.618 Fibonacci. Pull back buy opportunity.UBER has recovered 50% so far of the sell-off since the July high and is now close to the 0.618 Fibonacci retracement level. With the RSI on extremely overbought levels both on 4H (RSI = 85.104) and 1D (RSI = 84.218), we expect a pull back and consolidation here within the 0.382 and 0.618 width.
The 4H RSI is on a Channel Up since the November bottom and its support levels are as seen on the chart. Use them accordingly. We expect UBER to soon recover its highs and our Target Zone is 44.70 - 47.00.
** If you like our free content follow our profile (tradingview.sweetlogin.com) to get more daily ideas. **
Comments and likes are greatly appreciated.