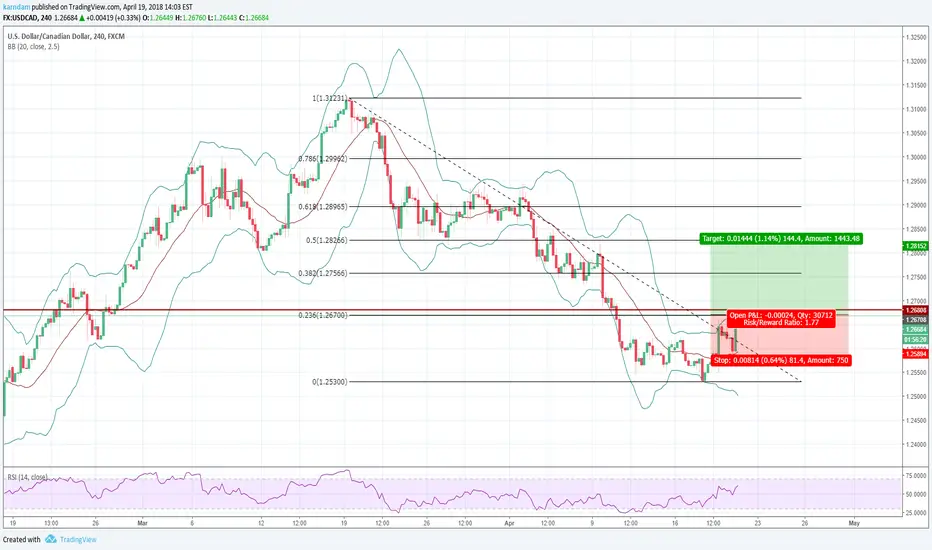
Ucad
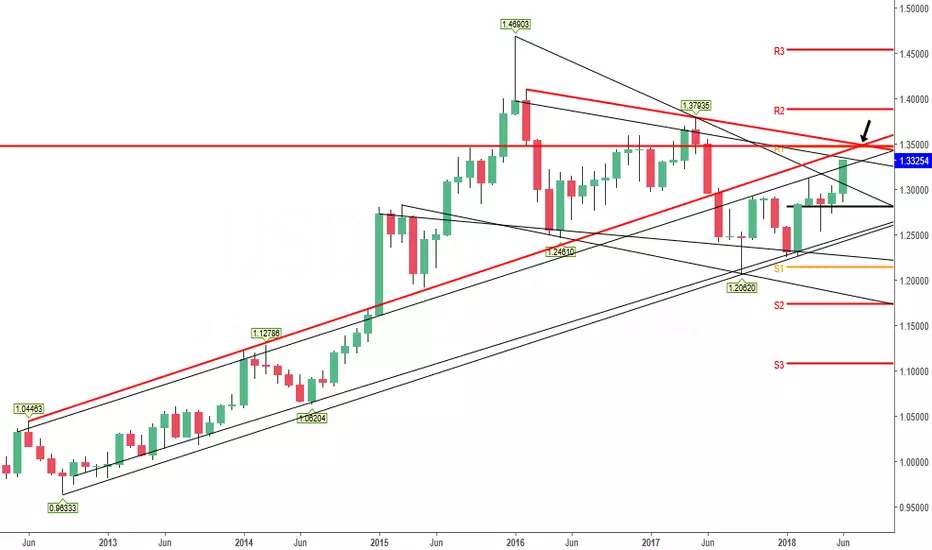
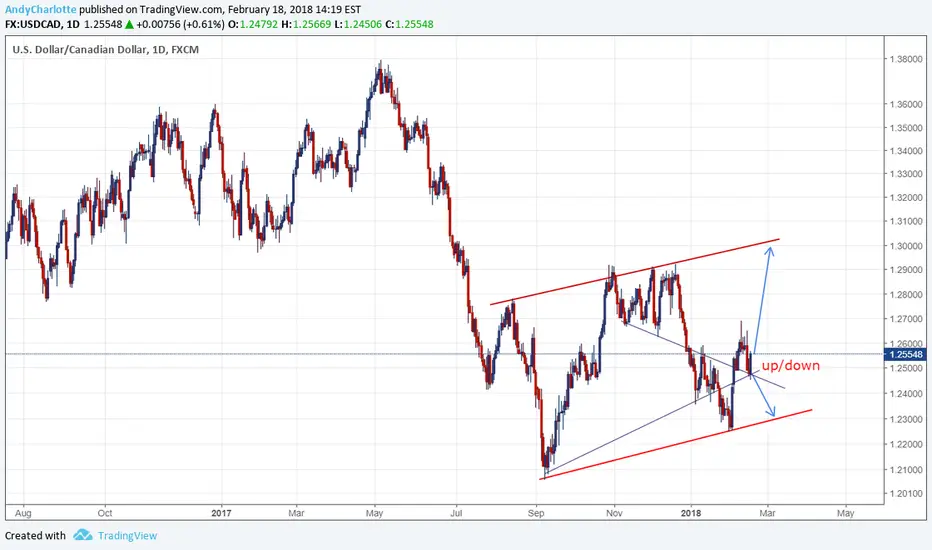
USDCAD - Not Confirmed... But a Possibilityon the 4H chart we have broken the neckline on a smaller head and shoulders pattern which here on the daily chart has been completed in the right shoulder on a structure support area. This pattern has not been confirmed yet as the neckline still has a while to go, but the 4H chart does confirm to me we will see some upside so the completion of this larger pattern has a higher probability of completing as well.
I will be monitoring this as it progresses but a move up to the 1.35 price range is what I am hoping to see.
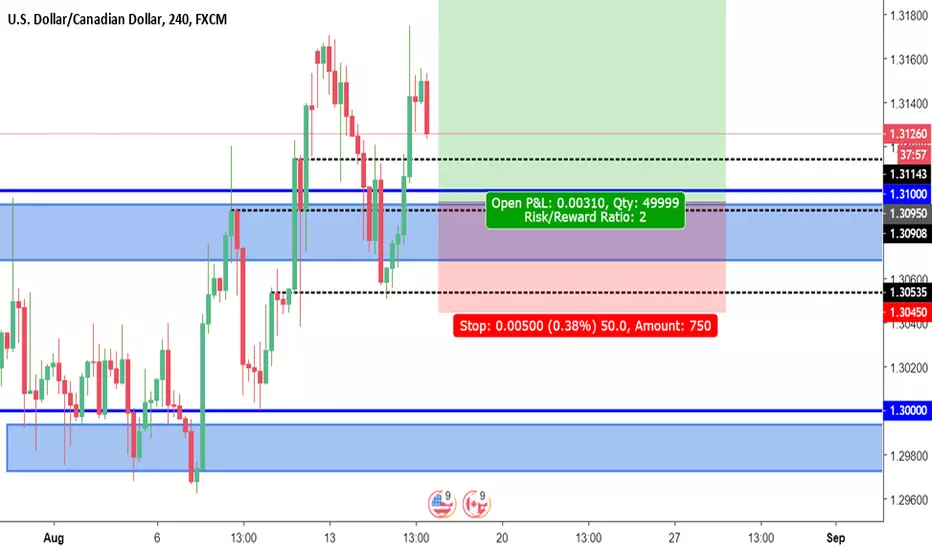
USDCAD - LONG AGAIN? [SWING TRADING STRATEGY] USDCAD
1D : Can Clearly see that Bullish engulfing happened. Then Price Break Resistance Line (Resistance Become Support) @ 1.3100
Target Buy
4H : Price is doing retracement. Wait for buy signal @ minor snr lines (black dotted horizontal line) Preferred buy level is at BRN level.
Target entry:
Buy Limit @ 1.3100
SL @ 1.3050 (50pips)
TP @ 1.3200 (100 pips)
TAYOR
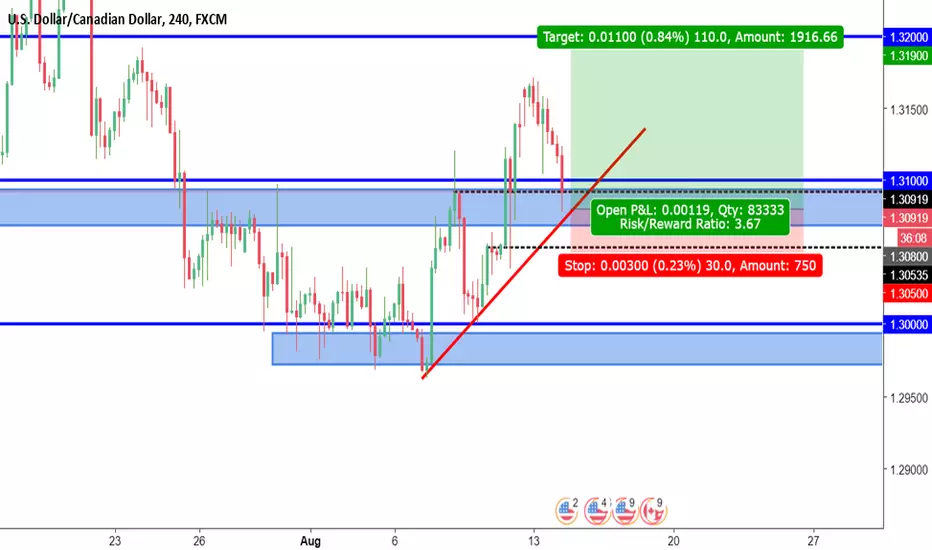
USDCAD LONG LONG LONG? [SWING TRADE STRATEGY] USDCAD
1D: The trend is currently uptrend. A simple trend continuation pattern can be seen clearly on this chart. Price is currently doing retracement. Wait for buy opportunity.
4H- Price is approaching the TL and minor support line @ 4H. Can look for buy signal from that level.
Targeted entry level:
Buy limit @ 1.3080
SL @ 1.3050
TP @ 1.3200
RRR 1: 3.67
TAYOR
USDCAD Fibonacci Support Resistance Zones: UC as of Jul 15This is my periodic update of Support Resistance zones for this pair.
USDCAD has been range bound, so there have been many fib clusters defined within.
Thus the choppy price action, because many resonances have been set within the range.
This will be a very interesting week for USD pairs in general, and UC in particular due to trade wars.
General Info
These zones are calculated using Fibonacci Ratios of past price moves.
Fib extensions and retracements are projected forward in time and price.
If price bounces or reverses, it will probably do so at one of these zones.
Some zones will match previous highs and lows, since Fibs are derived from the extremes.
Some zones will not match anything previous, but they are Fib multiples and THOSE are the important ones.
Zones that are far from current price will be either WIDE or just a LINE. Just a line indicates important Fib Ratio.
Where prices overlap on the zone lines, drag the Right (price) Axis up to magnify and reduce overlap vertically.
There are zones above and below the current price range, Drag the Chart up/down to see other zones.
Drag bottom axis to the left to magnify the candle size to view close up, or to the right to view larger time frame.
I will update as new zones are defined by upcoming Fibs.

72 - USDCAD - buy with RSI divergence and HH candle.I buy from my setup of HH candle, cross SMA20 and RSI divergence. (but aware that daily tf it's still below the SMA20)
TP around 50-61.8% fibo level.

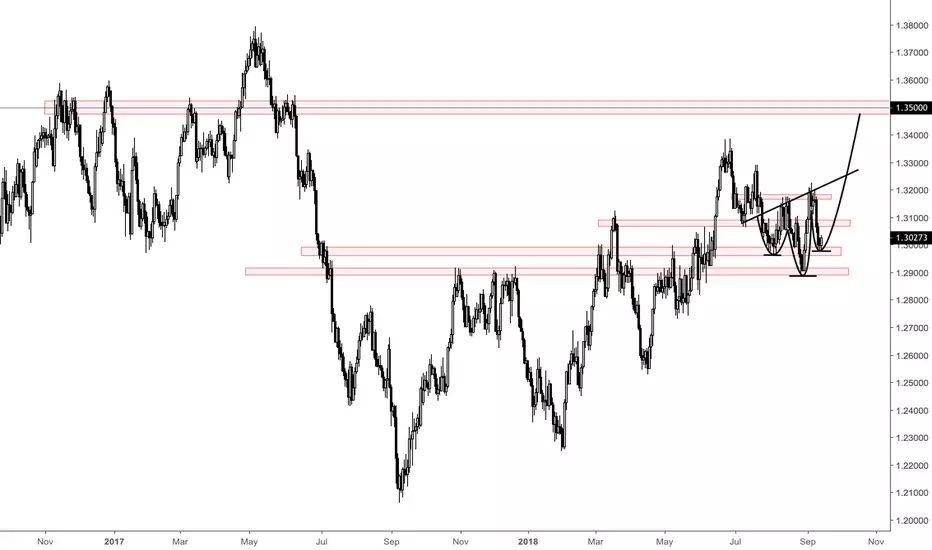
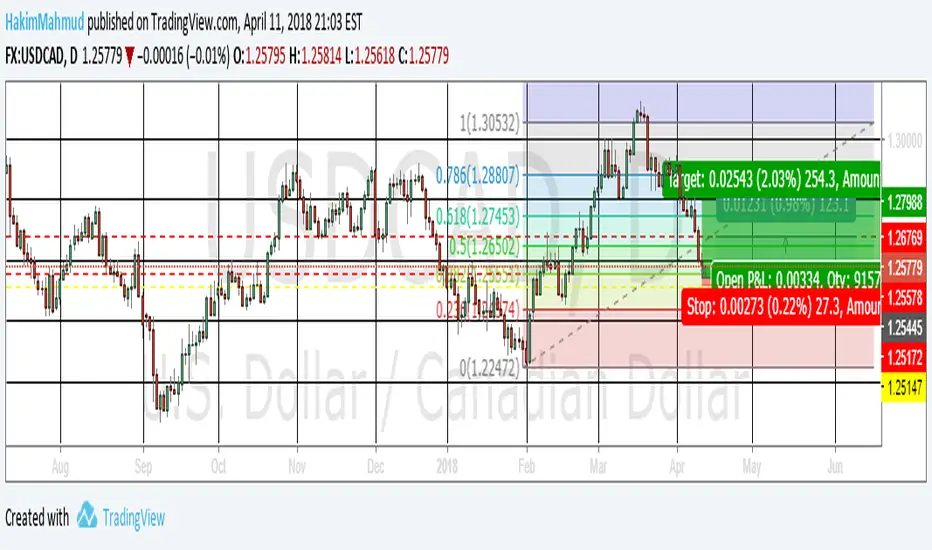
UsdCad Long-Term Viewabout another 150 - 200 pips long still, but once we hit the 1.35 price range UC will have a long ride back down to 1.28 before we see any true support. Trade at your own risk.
USDCAD Fibonacci Support Resistance Zones: UC as of Jun 17That's a LOT of lines, I know.
Kind of like ''draw a bunch of random lines and some of them will work", right?
This asset has just been so choppy, that it has left a LOT of ripples.
But it looks like it might be leaving the chop range.
So that should help me define better resonance frequencies soon.
Also, I found a way to make the zones go back to origin point.
So some the recently created zones will only go back a few hours.
The longer (time period) that a zone is, the larger time frame that Fib covered
As well, I have left a couple of the recent Fib extensions used as examples.
My complete chart has so many lines one can hardly see the price.
So for actual trading, I use this simplified chart as the guide for support/resistance.
I will update as new zones are defined by upcoming Fibs.
USDCAD Fibonacci Support Resistance Zones: UC as of Jun 10These zones are calculated using Fibonacci Ratios of past price moves.
Where prices overlap, drag the Right (price) Axis up to magnify and reduce overlap vertically.
There are zones above and below the current window, Drag the Chart up/down to see other zones.
Drag bottom axis to the left to magnify the candle size to view close up.
I will update as new zones are defined by upcoming Fibs.

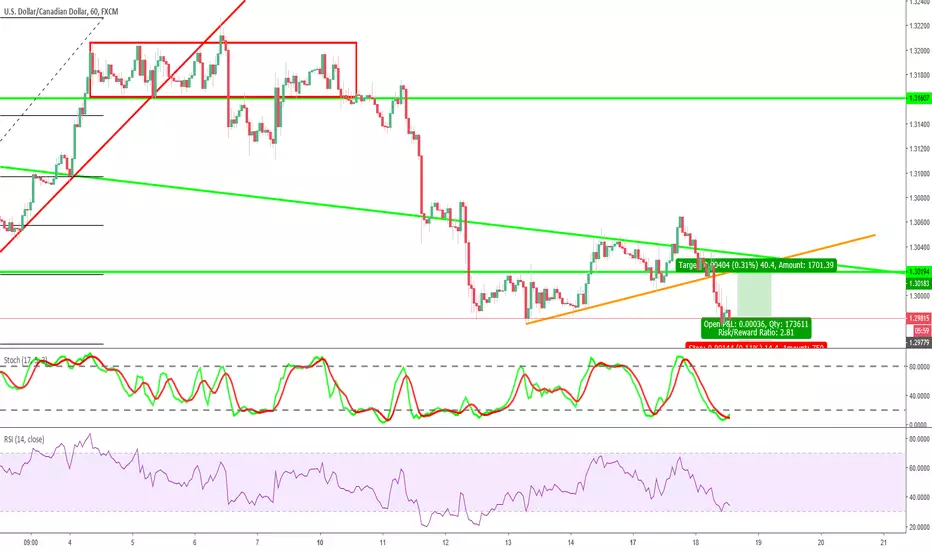
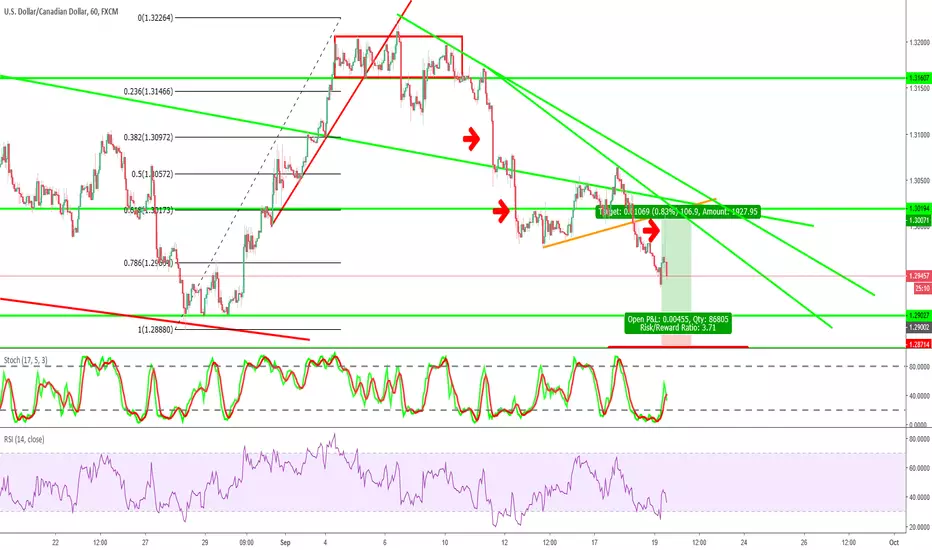
USD/CADI am in this sell from where it broke the high. I did not have time to post. The idea here is to break the low to that .618 with the potential of it going down much further longer term. It doesn't have to go to that underlined 1.618 or break the low, but pattern wise seems like it should continue down I would think to at least equal length to 1.236 extension. I marked the .786 level above (see small yellow arrow) as a possible place to get exact entry on it breaking the high of this consolidation, but it just shot down. I would look for sells or at least watch that level I mentioned should it push up again to break the consolidation high.

USDCAD SHORTThis is a trade I am in. I don't believe this will go back up above 1.30. The light blue box shows the resistance at that level. Last week was strong rejection. I could see this going up a bit more this week. But it's just slight pull-backs for further downside. I have marked my TP area with the the green line. This will take a few weeks. I will add shorts on every pull back.

50 USDCAD - The break out pattern BuyI buy due to break out.
The TP around 50% fibo retracement from top.
It's Time To Enter Long Positon For USDCAD?Hello, From my eyes i see that time for entry for LONG POSTION for USDCAD. Because really near support area and yesterday market close with DOJI. It mean, price gonna change direction for continues FOR SHORT a bit. If you guys had some idea just post it on comment section below.. We will discuss about this for long term projection.

18 - Break reisistant zone with the flag-like patternIn H1, H4 it is seems like the 1-2-3 ELW.
I buy it after it break out (but aware of blue-grey area)
Stop loss around low of h1 timeframe
.
Run in H4 timeframe.
Cheers
UCAD: Parallel channel The Canadian dollar benefitted the least from the risk rally. Although oil prices rebounded, existing home sales and manufacturing sales were weaker than expected. However these reports are not significant enough to explain the currency’s underperformance. Instead, investors are still hopeful that Canada’s economy is going strong and we’re set to learn if that’s true with retail sales and consumer prices scheduled for release.
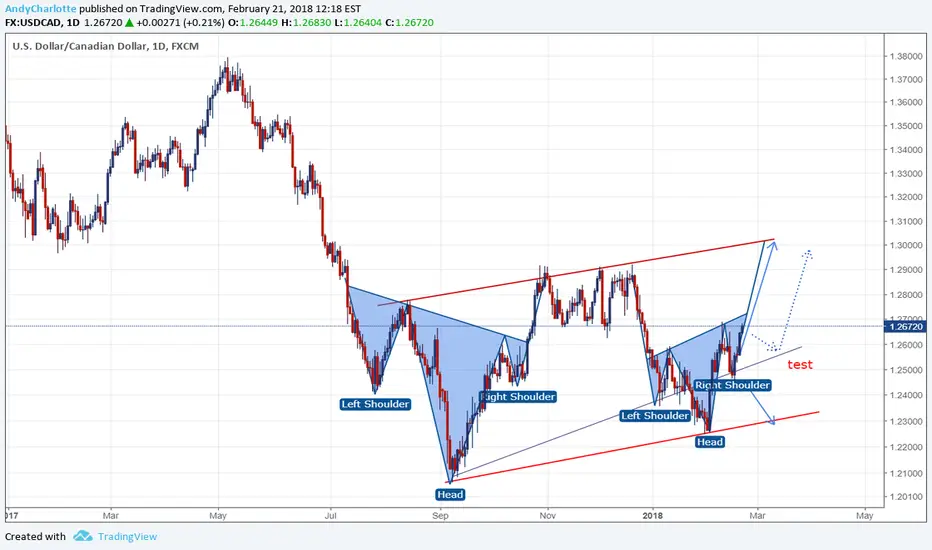
USDCAD possible 1000 pip move to the upside looking for downside to finish right shoulder of inverse head and shoulders. should see a big push next couple of week. MASSIVE rejection in monthly.
#19 : Buy with ABC patternI buy UCAD for break out after it form ABC (123) pattern
The details show in picture, and RR around 2.5
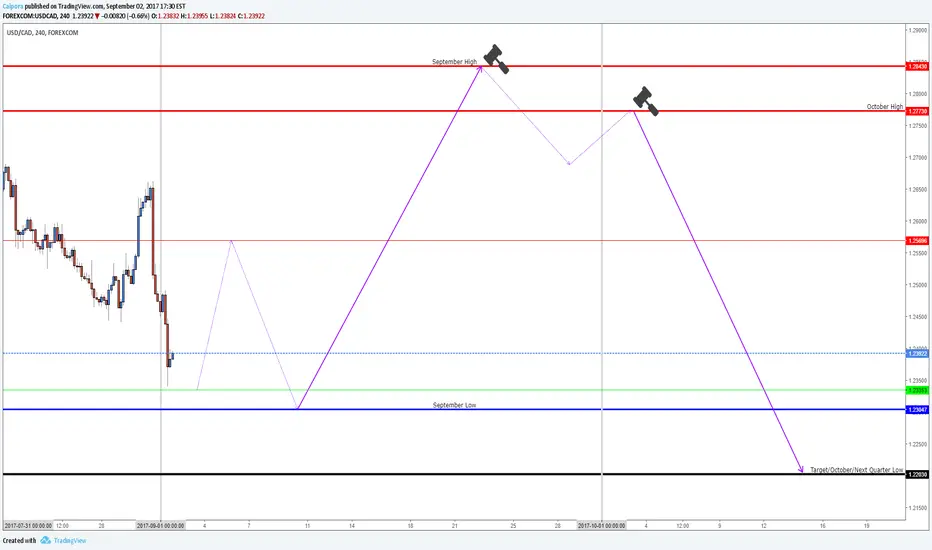
USDCAD 02SET2017 September and October forecastI believe this Month - September - for USDCAD will be BLUE and with a Low at 1.23047 and the High at 1.28430.
October High will be at 1.27730 so this month should close bellow that point in order to this idea become confirmed.
All those waves have the purpose to sync/converge to 1.22030 that I believe will be Low for next Quarter where a great Up will occur up to 1.3915.
The first jump (4th wave of this last )will occur at 1.2335 - not yet there - but will go down again to seek 1.23047 as this will be this Month Low/impulse up.
Pay attention specially on the thick lines in violet, as the dashed and thinnest lines are more flexible to occur.
This study is based on the Quarter/Monthly data by using convergence calculations on waves.
Please be aware that:
- These points could overpass a little as long as the impulse will be there, usually on a 4H or Daily UTC server - should use Forex.com data here on tradingview to sync 4H and daily charts .
- Please note that I am only predicting where things happens, not when, because that really depends on others factors such as the agreement of all major sessions - London, NY and Singapore - and also on Events, the fast/slow motion tool.
- Also those points/targets are not random or just imagination, they are in fact result of my calculations based on wave counting, measurement and convergence on very high timeframes starting from daily charts up to yearly.
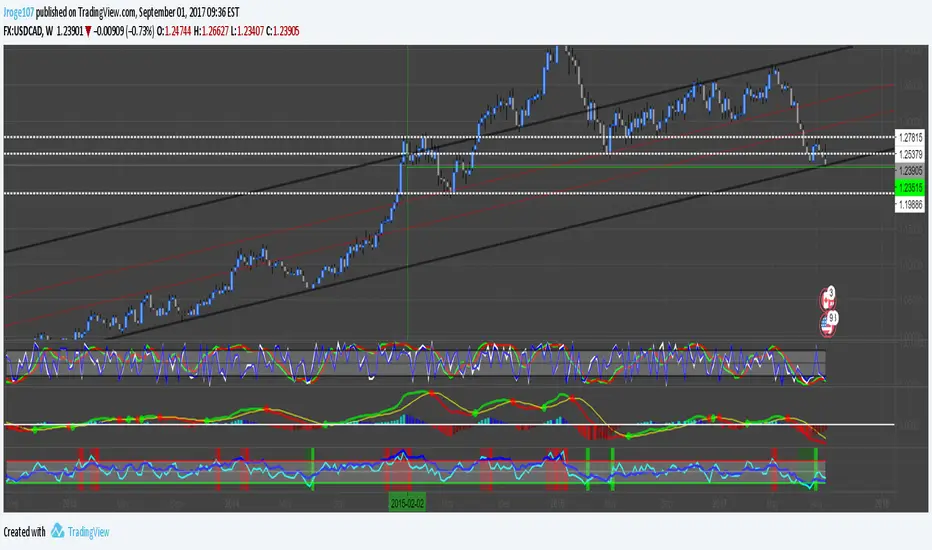
USDCAD - Potential Weekly ReversalRound two at an attempt for a USDCAD reversal. Price bounced off a ~4/5 year long trendline as well as the weekly candle looking as if it will not close below the lows of 2015 (highlighted in green) stochastics are showing a crossover and cross up, multi-TF MACD starting to curl, and multi-TF RSI already given one buy signal. USD could gain some strength after ISM numbers today, CAD PMI numbers fell short today, but Oil is likely to rise in the near future. This will will not be a fast reversal if it does happen.