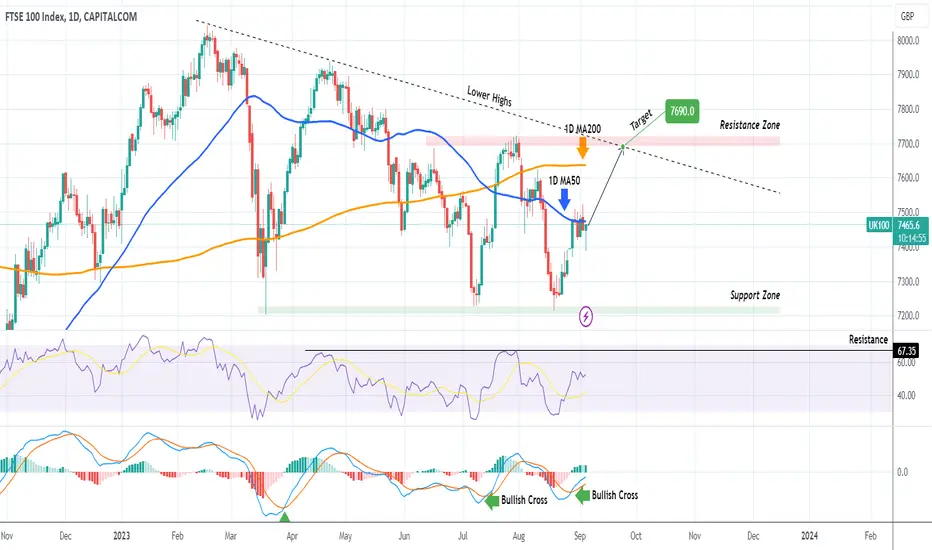
FTSE Buy signalThe FTSE 100 Index (UK100) is consolidating on the 1D MA50 (blue trend-line) for the 5th straight day. This is the first pause to the uptrend that started on the August 18 bottom, right on the 6-month Support Zone.
With the 1D RSI still not close to the overbought barrier and the 1D MACD on a Bullish Cross, this is the last bullish signal towards the Lower Highs trend-line. Our target is 7690, just below the Resistance Zone.
-------------------------------------------------------------------------------
** Please LIKE 👍, FOLLOW ✅, SHARE 🙌 and COMMENT ✍ if you enjoy this idea! Also share your ideas and charts in the comments section below! **
-------------------------------------------------------------------------------
💸💸💸💸💸💸
👇 👇 👇 👇 👇 👇
UK100 CFD
uk100 daily overview of key s/r levels buy/hold trade🔸Hello traders, today let's update the 2daily chart for UK100. We are currently testing
weak s/r level near 7300, however I expect the level to break soon and more downside.
🔸Price was rejected off the highs recently and correction in progress now expecting
more losses until we bottom out near 6900, which is a great level to buy/hold for the bulls.
expecting a re-test of mirror s/r level at 7650 points, so this makes this a decent setup
on buy side (10% upside)
🔸recommended strategy bulls: wait for correction to complete near 6900, do not buy/hold
right now, since current s/r level won't hold (weak s/r level) and more losses incoming.
get ready to buy/hold low near 6900 points targeting mirror s/r level at 7650. 10% upside,
low risk entry on buy side. good luck traders!
🎁Please hit the like button and
🎁Leave a comment to support our team!
RISK DISCLAIMER:
Trading Futures , Forex, CFDs and Stocks involves a risk of loss.
Please consider carefully if such trading is appropriate for you.
Past performance is not indicative of future results.
Always limit your leverage and use tight stop loss.

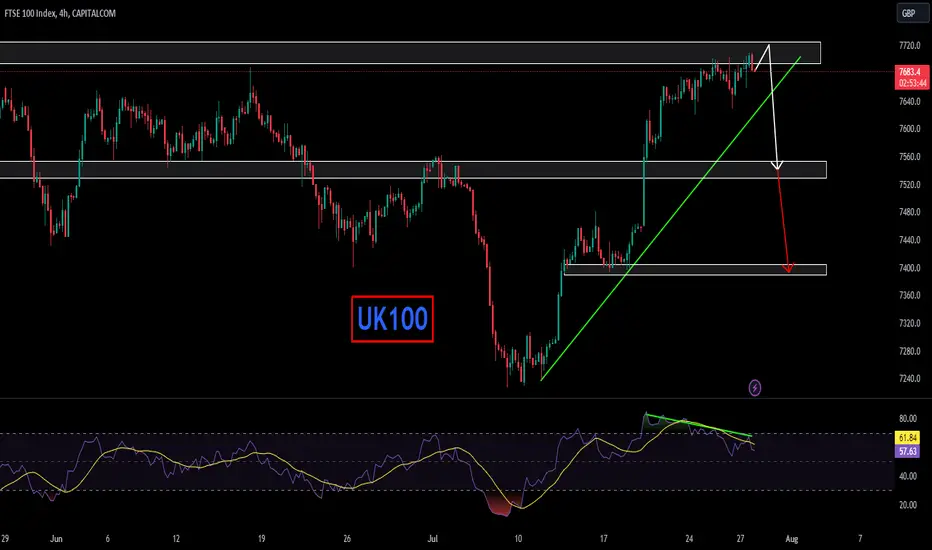
FTSE, Deviation then a drop?! UK100 / 4H
Hello traders, welcome back to another market breakdown.
FTSE is rallying back again above an old high which can be a run for stops.
I'll be looking for more confirmation with a clean invalidation if it comes back bellow the Mid.
Checkout the chart for the levels and my trigger plan for a swing trade.
Trade safely,
Trader Leo.

FTSE 100 - Market outlookThe UK stock market continues unstable dynamics against the background of an upward correction in the bond market, which even positive corporate reports cannot compensate for. Thus, the automaker Rolls-Royce Holdings plc recorded revenue growth to 6.950B pounds, exceeding the 6.059B pounds expected by analysts, and earnings per share of 0.0218 pounds compared to -0.0088 pounds earlier.
In turn, pharmaceutical giant Gedeon Richter Ltd. showed a steady increase in revenue to 203.78B forints compared to preliminary estimates of experts at 185.33B forints, while earnings per share amounted to 155.0 forints, which is also higher than the forecasted 143.0 forints.
Meanwhile, local growth is observed in the domestic UK bond market: 10-year securities are trading at a rate of 4.4305%, rising by 1.22% relative to Friday's close, and conservative 20-year ones are trading at 4.678%, adding 1.63%. The upward dynamics is also recorded for 30-year bonds, which are currently held near the key yield level of 4.621%, rising by 1.13% since the beginning of trading.
FTSE Ahead of a major bullish break-out.The FTSE 100 Index (UK100) is consolidating above the Support of the 1D MA200 (orange trend-line) with the 1D RSI at 66.250. This is the symmetrical level is was trading at during the November 04 - 09 2022 consolidation. Both near the 1.5 Fibonacci extension level.
That fractal eventually broke upwards, hit the Lower Highs trend-line (the dominant Resistance) and extended to Fib 2.0 even marginally surpassing the Resistance of the last Lower High.
We are going long on that buy signal and target the 7900 (Fib 2.0).
-------------------------------------------------------------------------------
** Please LIKE 👍, FOLLOW ✅, SHARE 🙌 and COMMENT ✍ if you enjoy this idea! Also share your ideas and charts in the comments section below! **
-------------------------------------------------------------------------------
💸💸💸💸💸💸
👇 👇 👇 👇 👇 👇

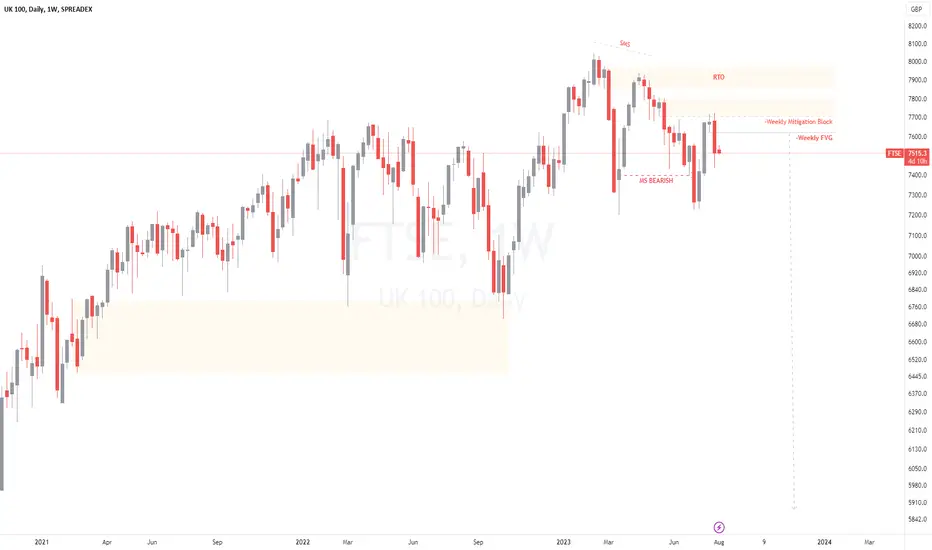
UK100UK100 is trading at strong supply zone and also created very strong bearish divergence, these confluences putting sell pressure on uk100. as the inclining trendline also waiting for 3rd pivot to trendline. Will UK100 decline to support area ?
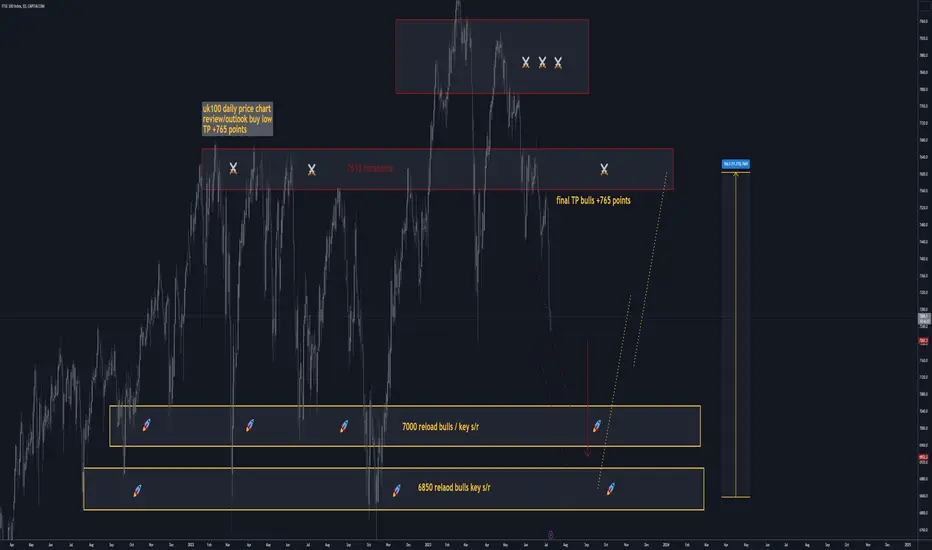
uk100 daily swing trade setup tp bulls +765 points🔸Hello traders, today let's review the daily chart for UK100. Recently solid gains and we
re-tested the ATH however correction/pullback in progress now. rejection near 7900.
🔸This is a setup based on repeat price fractal. 7615 heavy resistance overhead, right now
we are trading at 7265, pullback in progress and expecting further losses this week/next week.
key supports / reload zones for bulls below: at 6850 and 7000. expecting correction to
complete in 1-3 weeks and then we should be ready for a bounce play.
🔸recommended strategy bulls: wait for pullback/correction to complete near
reload zones and be ready to buy low. SL fixed at 6750. TP1 +400 TP2 +765 points
final TP bulls is 7600/7615. swing trade setup / patience required. good luck!
🎁Please hit the like button and
🎁Leave a comment to support our team!
RISK DISCLAIMER:
Trading Futures , Forex, CFDs and Stocks involves a risk of loss.
Please consider carefully if such trading is appropriate for you.
Past performance is not indicative of future results.
Always limit your leverage and use tight stop loss.
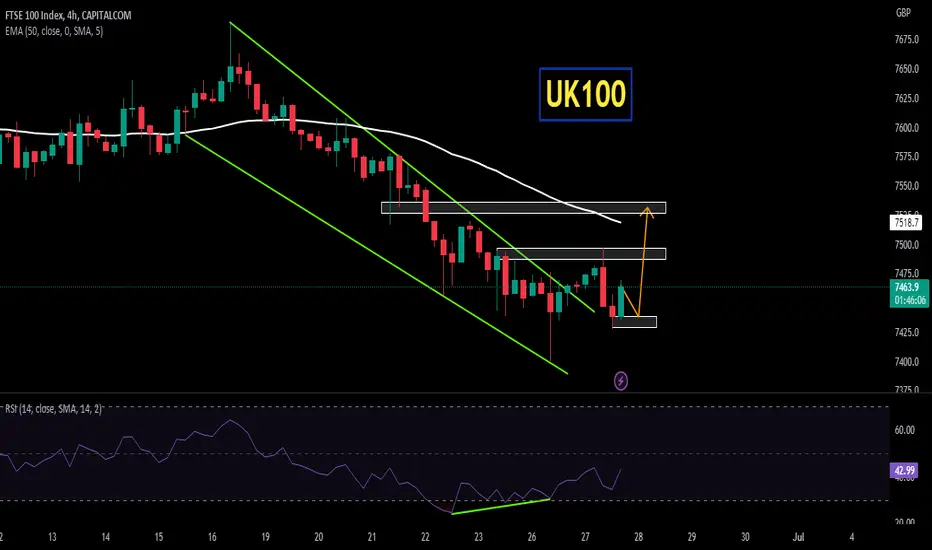
UK100 Long Trade AnalysisPlace buy stop above trendline on UK100 or wait for trnsline to break to get entry.
Manage your risk accoring to account size.

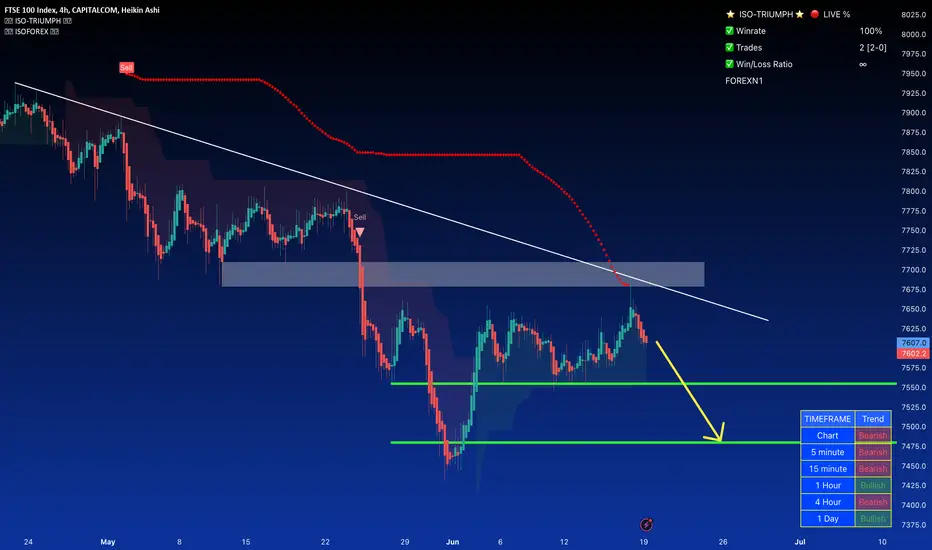
FTSE, An opportinity for a lower high setupUK100 / 4H
Hello traders, welcome back to another market breakdown.
FTSE has been reversing making new lows, the price is in pull-back mode now which is an opportinity to get on the current trend. I'll be studying a position around the sell zone showen
on the chart.
Trade safely,
Trader Leo.

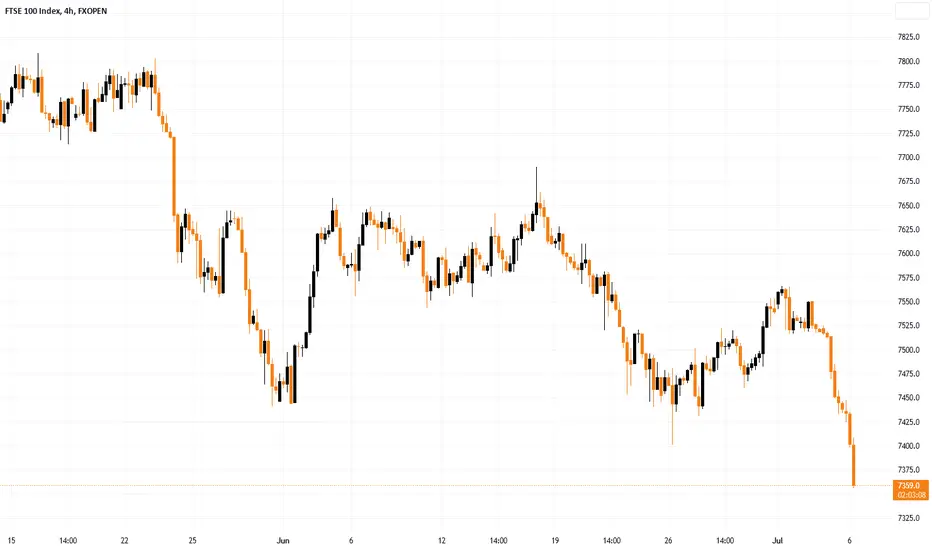
FTSE 100 Drops Below June LowEarlier we wrote about the reasons for the weak behavior of the UK stock market.
Firstly, it is the highest inflation among the G7 countries.
Yesterday JP Morgan analysts suggested that the base rate in the UK could be raised to 7% under certain scenarios. And the likelihood of a hard landing for the British economy next year is rising due to the impact of rising borrowing costs on business confidence and rising unemployment.
Secondly, this is a decline in commodity prices, which is important for the FTSE 100 index, where the share of oil and mining companies is relatively large. Commodity prices reflect expectations of a global economic growth outlook that has been overshadowed by news from China. There, according to the latest data, activity in the services sector in June grew at the slowest pace in 5 months.
At the same time, the FTSE 100 chart gives hope to the bulls, as the price of the index is at the level of the lower line of the descending channel (shown in red), which, it is possible, will show support properties for the FTSE 100, which may lead to a slowdown in the fall or even a short-term rebound.
This article represents the opinion of the Companies operating under the FXOpen brand only. It is not to be construed as an offer, solicitation, or recommendation with respect to products and services provided by the Companies operating under the FXOpen brand, nor is it to be considered financial advice.
UK 100 FORECAST Hi there,
Looking at UK100 index which is approaching a MAJOR support level OB.
Uk100 has currently wicked some liquidity below the Lows of 1 june and forming some bullish hammer candles. But we want to see some big hammer candle or bullish engulfing candle to enter for longs as well as change of character on the trend.
4hr time frame = bearish
1hr time frame = bearish = shorting between from 7530 or 7500 range to major support
15mins time frame = bearish = shorting from 7500 to 7450
daily frame = 100pts from major support.
RSI showing small convergence.

UK100UK100 was trading in bearish parallel channel and finally breakout of channel with strong bullish impulse and also produced bullish on 4H TF. Will these confluences help the instrument for its bullish trajectory?
UK100 to find sellers at psychological level?UK100 - 24h expiry
The current move lower is expected to continue.
Short term RSI has turned negative.
Rallies continue to attract sellers.
Risk/Reward would be poor to call a sell from current levels.
A move through 7425 will confirm the bearish momentum.
We look to Sell at 7500 (stop at 7525)
Our profit targets will be 7425 and 7400
Resistance: 7475 / 7500 / 7525
Support: 7450 / 7425 / 7400
Risk Disclaimer
The trade ideas beyond this page are for informational purposes only and do not constitute investment advice or a solicitation to trade. This information is provided by Signal Centre, a third-party unaffiliated with OANDA, and is intended for general circulation only. OANDA does not guarantee the accuracy of this information and assumes no responsibilities for the information provided by the third party. The information does not take into account the specific investment objectives, financial situation, or particular needs of any particular person. You should take into account your specific investment objectives, financial situation, and particular needs before making a commitment to trade, including seeking advice from an independent financial adviser regarding the suitability of the investment, under a separate engagement, as you deem fit.
You accept that you assume all risks in independently viewing the contents and selecting a chosen strategy.
Where the research is distributed in Singapore to a person who is not an Accredited Investor, Expert Investor or an Institutional Investor, Oanda Asia Pacific Pte Ltd (“OAP“) accepts legal responsibility for the contents of the report to such persons only to the extent required by law. Singapore customers should contact OAP at 6579 8289 for matters arising from, or in connection with, the information/research distributed.

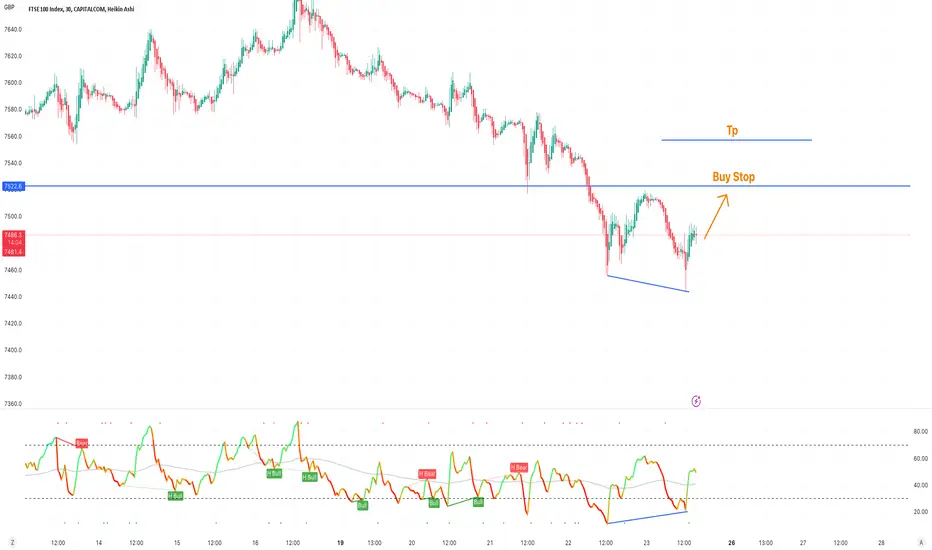
UK100 Bullish DivergenceBullish Divergence formed on UK100 30mins, place your buy stop or wait for LH to break.
Manage your Risk Accordingly!
FTSE, Breaking lower? UK100 / 1D
hello traders, welcome back to another market breakdown.
FTSE has been reversing down from the All time high, the price probably has finished the pull-back phase, I'll be looking to feed the next leg lower on any spike up.
Trade safely,
Trader Leo

UK100UK100 is trading in long term bearish trend. Currently the price is retracing a bit but just about to face a long term declining trendline from Fib golden ratio. Will these confluences push the price to lower side again?

FTSE Opens with Bearish Bias: Potential for New Bearish ImpulseToday, the FTSE kicked off the market with a bearish bias, as indicated by its opening. After retracing and testing the previous resistance area near 7680, the value of the FTSE appears to have encountered resistance from a dynamic trendline within a broader bearish downtrend. This suggests the possibility of a new bearish impulse taking hold today. It will be interesting to observe how this index performs in the coming days as market conditions unfold.
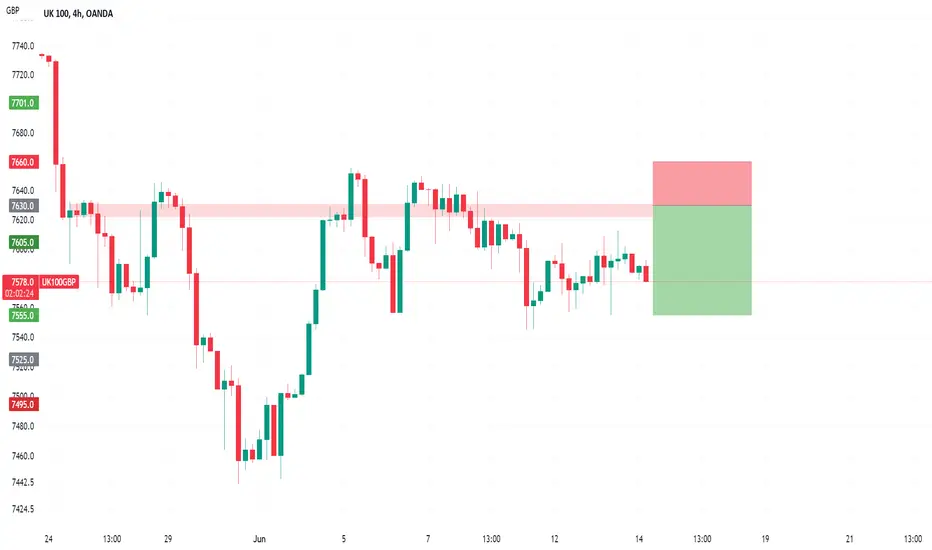
UK100 to stall at previous resistance?UK100 - 24h expiry
Previous support located at 7550.
Previous resistance located at 7600.
Trend line resistance is located at 7630.
A higher correction is expected.
Risk/Reward would be poor to call a sell from current levels.
We look to Sell at 7630 (stop at 7660)
Our profit targets will be 7530 and 7525
Resistance: 7600 / 7630 / 7650
Support: 7550 / 7530 / 7500
Risk Disclaimer
The trade ideas beyond this page are for informational purposes only and do not constitute investment advice or a solicitation to trade. This information is provided by Signal Centre, a third-party unaffiliated with OANDA, and is intended for general circulation only. OANDA does not guarantee the accuracy of this information and assumes no responsibilities for the information provided by the third party. The information does not take into account the specific investment objectives, financial situation, or particular needs of any particular person. You should take into account your specific investment objectives, financial situation, and particular needs before making a commitment to trade, including seeking advice from an independent financial adviser regarding the suitability of the investment, under a separate engagement, as you deem fit.
You accept that you assume all risks in independently viewing the contents and selecting a chosen strategy.
Where the research is distributed in Singapore to a person who is not an Accredited Investor, Expert Investor or an Institutional Investor, Oanda Asia Pacific Pte Ltd (“OAP“) accepts legal responsibility for the contents of the report to such persons only to the extent required by law. Singapore customers should contact OAP at 6579 8289 for matters arising from, or in connection with, the information/research distributed.
FTSE100 9/JUN/2023UK100 (FTSE 100) index has shown a significant price movement. The price initially formed a resistance level, which has been successfully broken out. This breakout indicates a potential shift in market sentiment. The previous resistance level has now become a support level. This means that traders and investors are now viewing this level as a price floor, where buying pressure may emerge.
The price is approaching this support area. Based on historical price behavior, it is likely that the price will rebound or bounce off this support level. This means that buyers could step in and push the price higher from this point. Considering these factors, it is advisable to monitor the price action closely in the support area. Traders may consider potential buying opportunities as the price approaches this level, keeping in mind that a rebound or bounce could occur.
Note: This analysis is based solely on technical factors and does not take into account fundamental or macroeconomic aspects that may influence the UK100 index. Technical analysis is not foolproof and market conditions can change rapidly.

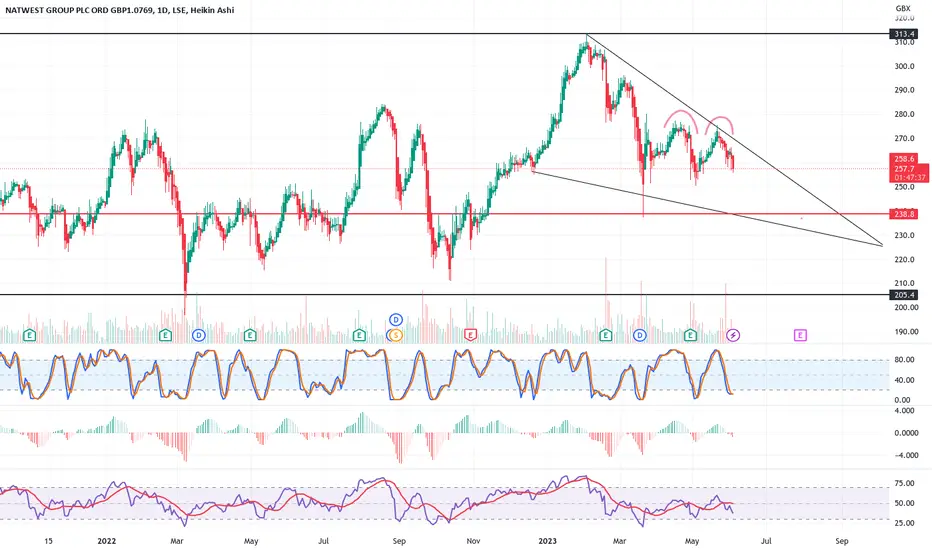
$nwg natwest #nwg 1d candle time framedecent long term hold, that pays dividends. long term bullish for natwest, in a fallen wedge, that break to the upside 68% of the time, i could see a small pull back to 240, worse case would be a pullback to 206 happening before a major rally,
nfa dyor
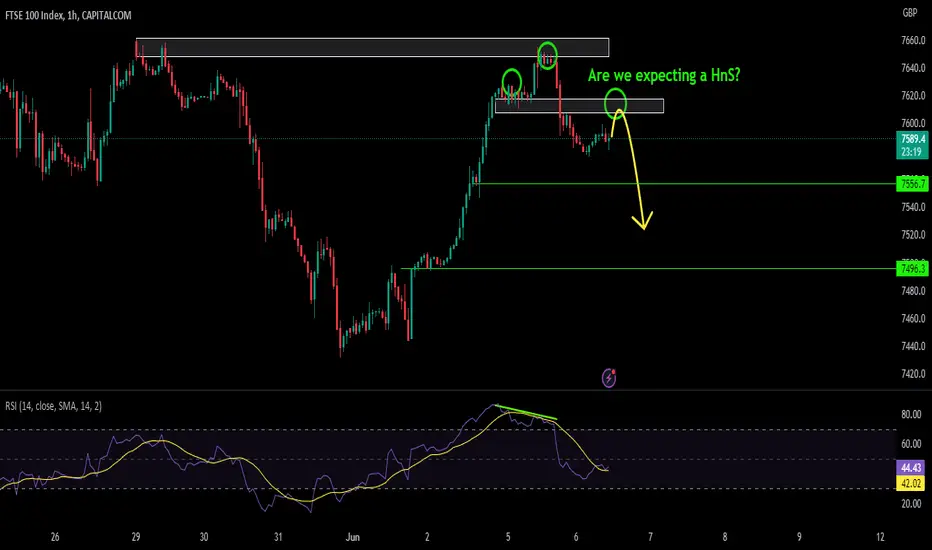
UK100 UK100 recently make a nice bullish impulse and seems like fail to maintain it. Currently the instrument is looking for Right shoulder. If it successfully form HnS then we are looking for 7550 followed by 7500 to downside.
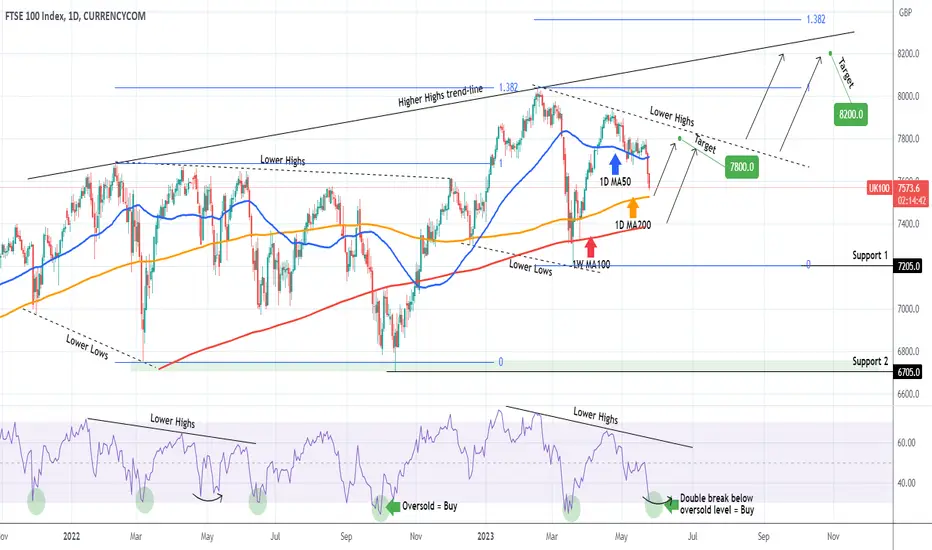
FTSE100 Double Buy short-term and long-term break-out.The FTSE 100 Index (UK100) has broken below its 1D MA50 (blue trend-line) and is approaching the 1D MA200 (orange trend-line), which is the first short-term Support. The medium-term is the 1W MA100 (red trend-line) and those two are our buy entries for a 7800 Target. This is just under the Lower Highs trend-line from the All Time High (February 16 2023).
The 1D RSI is close to the 30.00 oversold barrier and past price action in March 2023 and October 2022 shows that the 2nd break below it, is a Buy Signal. The pattern overall with the Lower Lows in Support and inner Lower Highs, resembles that of December 2021 - May 2022 (so far).
As a result, we are only willing to take a long-term buy, if a 1D candle closes above the inner Lower Highs trend-line. In this case we will target 8200. The potential extension towards the end of the year can even be as high as the 1.382 Fibonacci extension (8350) which was where the February 16 2023 High was priced.
-------------------------------------------------------------------------------
** Please LIKE 👍, FOLLOW ✅, SHARE 🙌 and COMMENT ✍ if you enjoy this idea! Also share your ideas and charts in the comments section below! **
-------------------------------------------------------------------------------
💸💸💸💸💸💸
👇 👇 👇 👇 👇 👇
FTSE Drops Rapidly to April Lows TodayThe FTSE 100 index is rapidly declining on Wednesday morning amid news of another spike in inflation. The Core CPI (excluding energy, food and tobacco prices) reached 6.8%, the highest in over 30 years. Market participants are now almost certain that the Bank of England will raise interest rates at its next meeting.
The UK100 chart (a tool that reflects the dynamics of the FTSE 100 index) shows a consistent series of bull failures around psychologically significant levels:
1→ UK100 price failed to settle above 8,000 in February;
2→ UK100 price did not fix above 7,900 in April;
3 → level 7,800 used to be support but is now resisting.
The action of the UK100 price today suggests that the level of 7,700 may now also provide resistance in an attempt to increase. If the downtrend strengthens, the FTSE may continue to decline within the channel (shown in blue), reaching its median line (or even the lower border — which would mean a 2023 low).
This article represents the opinion of the Companies operating under the FXOpen brand only. It is not to be construed as an offer, solicitation, or recommendation with respect to products and services provided by the Companies operating under the FXOpen brand, nor is it to be considered financial advice.
