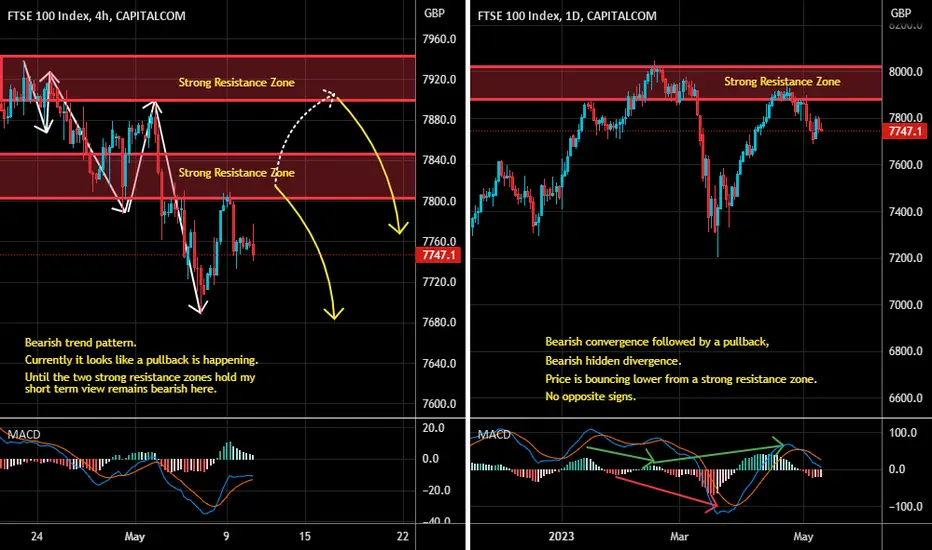
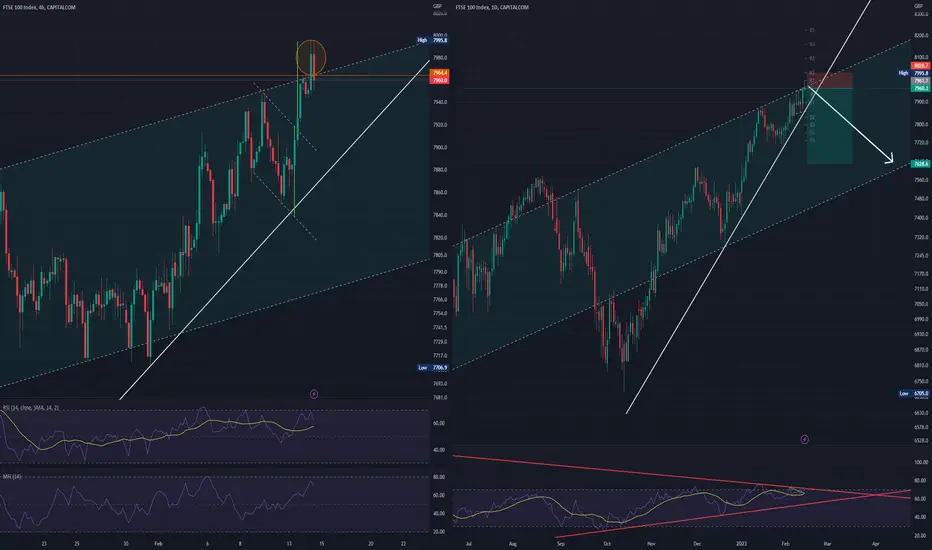
UK100 Short Term Sell IdeaD1 - Bearish convergence followed by a pullback,
Bearish hidden divergence.
Price is bouncing lower from a strong resistance zone.
No opposite signs.
H4 - Bearish trend pattern.
Currently it looks like a pullback is happening.
Until the two strong resistance zones hold my short term view remains bearish here.
UK100 CFD
FTSE: About to give a strong longterm buy signalFTSE100 has been trading inside a Channel Up since the October 13th 2022 bottom, currently pulling back after a rejection on the internal LH trendline. This has turned the 1D timeframe neutral (RSI = 48.285, MACD = 4.950, ADX = 49.378) and with the price on the 1D MA50, those are the conditions for a buy.
The Buy signal trigger however would be the index crossing over the LH trendline, as it did on a similar pattern on November 10th 2022. We will buy either on that trigger or on the 1D MA200. In both cases TP = 8,250.
## If you like our free content follow our profile to get more daily ideas. ##
## Comments and likes are greatly appreciated. ##

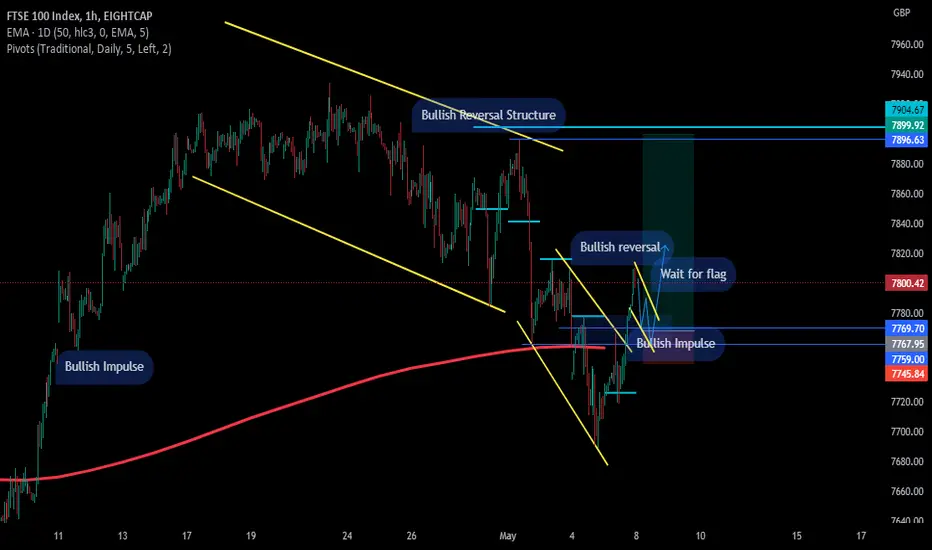
UK100 LongHello Everyone!
I will be looking for Uk100 Long for the following reasons:
1. the trend is bullish
2. the bullish correction has finished, hence the strong bullish run.
3. will wait for a sort of bullish flag to form to complete the right shoulder of the inverse head and shoulder, before an entry.
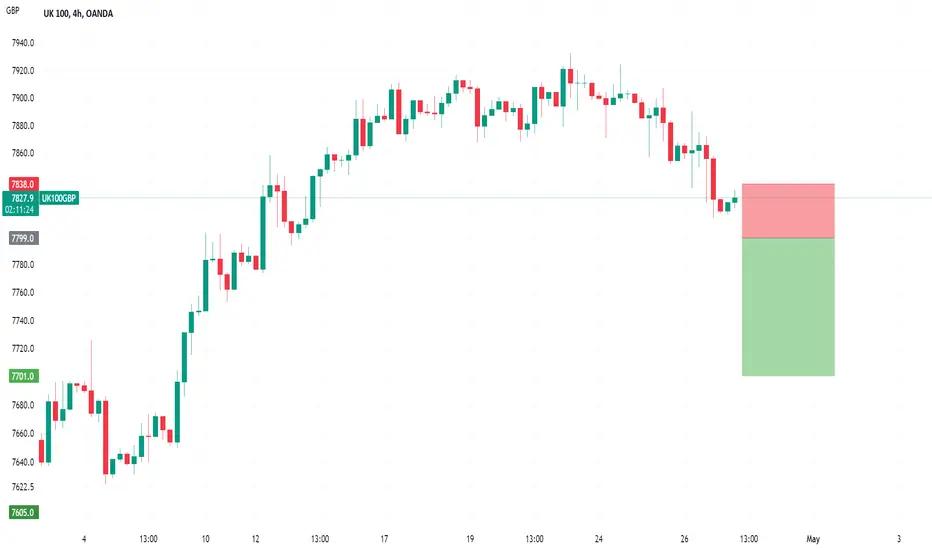
UK100 to start a selloff?UK100 - 24h expiry -
We are trading at overbought extremes.
Short term MACD has turned negative.
A break of 7800 is needed to confirm follow through negative momentum.
Short term bias has turned negative.
We look for losses to be extended today.
We look to Sell a break of 7799 (stop at 7838)
Our profit targets will be 7701 and 7681
Resistance: 7835 / 7860 / 7880
Support: 7809 / 7780 / 7750
Risk Disclaimer
The trade ideas beyond this page are for informational purposes only and do not constitute investment advice or a solicitation to trade. This information is provided by Signal Centre, a third-party unaffiliated with OANDA, and is intended for general circulation only. OANDA does not guarantee the accuracy of this information and assumes no responsibilities for the information provided by the third party. The information does not take into account the specific investment objectives, financial situation, or particular needs of any particular person. You should take into account your specific investment objectives, financial situation, and particular needs before making a commitment to trade, including seeking advice from an independent financial adviser regarding the suitability of the investment, under a separate engagement, as you deem fit.
You accept that you assume all risks in independently viewing the contents and selecting a chosen strategy.
Where the research is distributed in Singapore to a person who is not an Accredited Investor, Expert Investor or an Institutional Investor, Oanda Asia Pacific Pte Ltd (“OAP“) accepts legal responsibility for the contents of the report to such persons only to the extent required by law. Singapore customers should contact OAP at 6579 8289 for matters arising from, or in connection with, the information/research distributed.
Short FTSEMy simple short idea, divergance on few time frames. We are overbought, no reason for more upside for me.
Take care
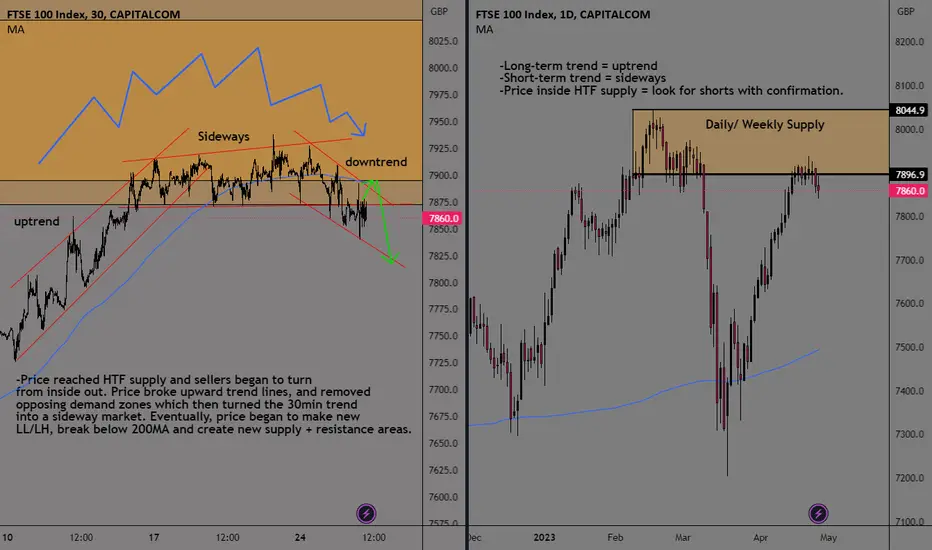
UK100 Supply And demand Short AnalysisSee chart for top-down analysis on price turning from inside out with confirmation. Trending into sideways into downtrend and looking to join the trend to the downside with SL above all structure supply.
UK100 FTSE Technical Analysis and Trade IdeaIn this video we focus on the FTSE UK100, however, the US100, US30, UK100, and DE30 are analysed to find a common theme between these four instruments. The stock markets have traded into key support levels and have been rangebound for some time. We are now seeing some bearish momentum evident in the charts. The trend, price action, price gaps, market structure, and a potential trade opportunity are covered. It is important to note that this is not financial advice and is meant for educational purposes only.

Stock Markets Trend Analysis - US30, US100, US500, UK100, GE40By analysing the stock markets at different timeframes, ranging from the three-monthly chart down to a four-hour chart, I have noticed that they have reached a significant resistance level on several higher timeframes. Furthermore, on the lower timeframe, the trend seems to display indications of weakening, and the charts seem to be range-bound. Could this signify that a stock market selloff is looming? If it is, this will undoubtedly affect the currency markets. In the video we look at the following charts on multiple time frames: US30, US100, US500, UK100, GE40, VIX. I would like to clarify that this video is simply an observation and a sharing of my thoughts, and should not be interpreted as financial advice.

FTSE to breakdown from a wedge?UK100 - 24h expiry -
Previous support located at 7740.
Previous resistance located at 7800.
We are trading close to the end of an ascending Ending Wedge Formation.
We expect a reversal in this move.
A move through 7740 will confirm the bearish momentum.
We look to Sell a break of 7740 (stop at 7820)
Our profit targets will be 7560 and 7550
Resistance: 7800 / 7820 / 7850
Support: 7740 / 7700 / 7550
Risk Disclaimer
The trade ideas beyond this page are for informational purposes only and do not constitute investment advice or a solicitation to trade. This information is provided by Signal Centre, a third-party unaffiliated with OANDA, and is intended for general circulation only. OANDA does not guarantee the accuracy of this information and assumes no responsibilities for the information provided by the third party. The information does not take into account the specific investment objectives, financial situation, or particular needs of any particular person. You should take into account your specific investment objectives, financial situation, and particular needs before making a commitment to trade, including seeking advice from an independent financial adviser regarding the suitability of the investment, under a separate engagement, as you deem fit.
You accept that you assume all risks in independently viewing the contents and selecting a chosen strategy.
Where the research is distributed in Singapore to a person who is not an Accredited Investor, Expert Investor or an Institutional Investor, Oanda Asia Pacific Pte Ltd (“OAP“) accepts legal responsibility for the contents of the report to such persons only to the extent required by law. Singapore customers should contact OAP at 6579 8289 for matters arising from, or in connection with, the information/research distributed.

FTSE 100 AT MAJOR RESISTANCEFTSE 100 has reached a major resistance after the breakdown that we called around a month ago. We are looking for a reaction at this level to possibly go short and we will updated if we take that position.
FTSE 5-3-5 pattern Out of all the indexes the FTSE one has the cleanest looking 5-3-5 pattern. Perfect ABC to the vwap from top. A pivot here should start another long 5-wave down. 5th wave extension will cover the most ground on capitulation.

FTSE H1 7715 Target Hit, What Next?In this update we review the recent price action in the #FTSE an identify the next high probability trading opportunities and price objectives to target

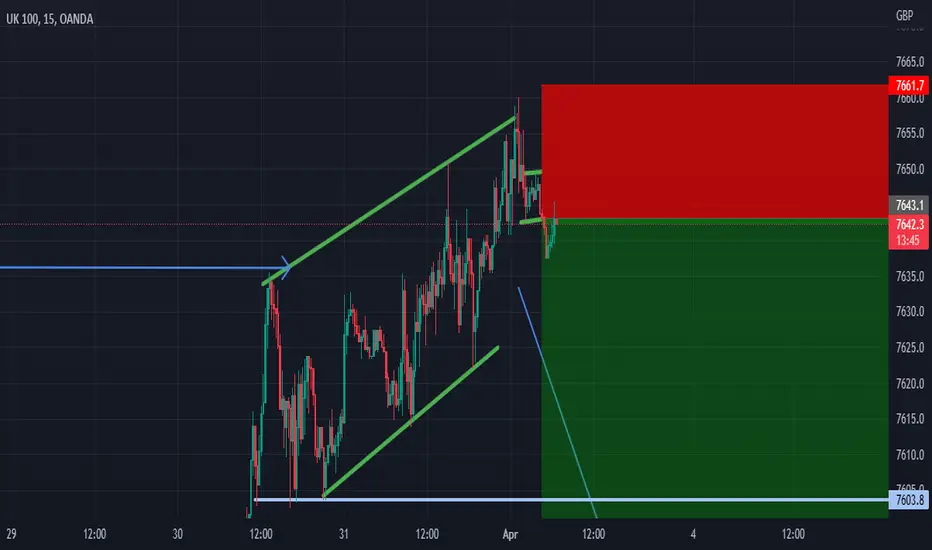
uk100 shortprice has been ranging between bottom resistance @6780.2 and top resistance @7917.9 on a daily timeframe. 0n the 1hour timeframe there is a small resistance at 7636.6 which price retested in an ascending channel. On the 15min there is a flag which I'm using as entry with stoploss at 7661.7 and take profit at 7465.2
FTSE H1 Trading The Correction Targeting 7715In this update we review the recent price action in the #FTSE and identify the next high probability trading opportunities and price objectives to target

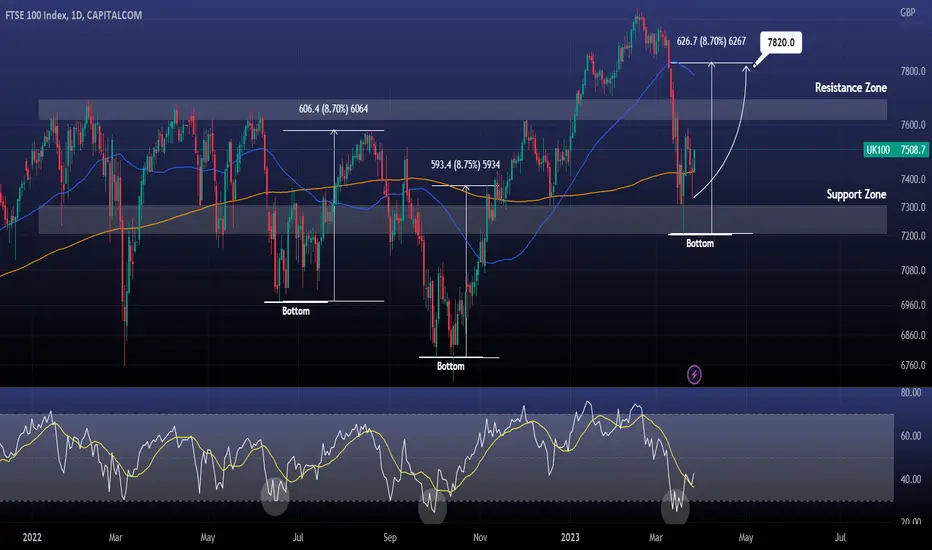
FTSE100 Bottom formed. Buy opportunity.FTSE100/ UK100 is forming a Bottom on a 1 year Support Zone. The RSI is also bottoming out.
Target 7820 (+8.70% rise0>
Follow us, like the idea and leave a comment below!!
Break out for BATSNot a BATS out of hell just yet but a breakout all the same. Broken away from 2756 and a good dividend, but now has to clear 3000 last established in Jan 2020.

FTSE Update Pre BOEHey Traders,
The FTSE has been wildly moving between extremes.
We can now look further at key PA levels.
Watch for more.

FTSE 100 | UK 10 | DECRYPTERS Hi Welcome to Decrypters
Simple reasons to Buy
Liquidity Raid
Fib retracement
Weakness in Forex Pairs
Daily 200 EMA

US100, US30, UK100, DE30 Technical Analysis and Trade IdeaIn this video, the US100, US30, UK100, and DE30 are analysed to find a common thread between these four instruments. The stock markets have traded into key support levels and a reaction from these levels could be worth consideration. The trend, price action, price gaps, market structure, and a potential trade opportunity are covered. It is important to note that this is not financial advice and is meant for educational purposes only.

FTSE To Test Trend, HVN & Equality ConfluenceIn this update we review the recent price action in the FTSE and identify the next high probability trading opportunities and price objectives to target

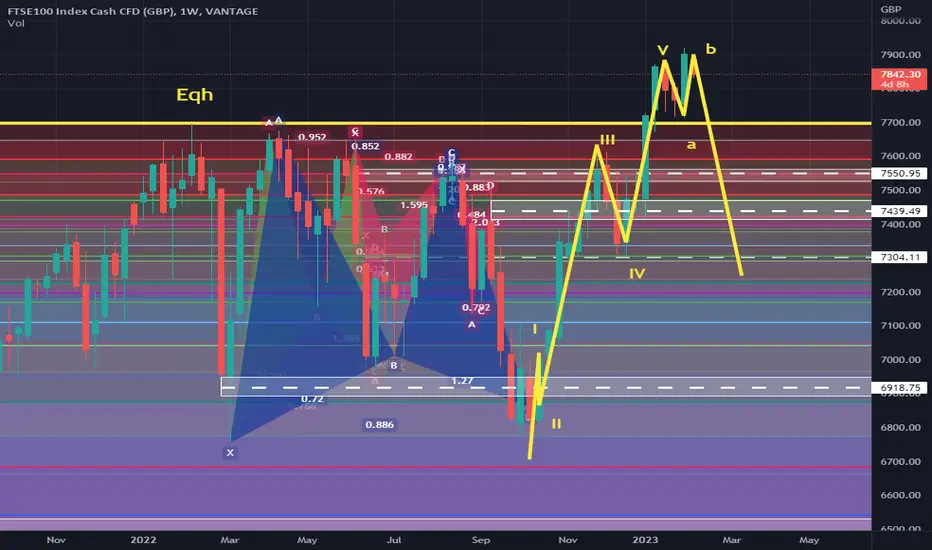
UK100 CrashHello we are part of a new community called lucky trading club in tradingview so let's begin our second analysis.
UK100, ftse100 will crash, we have a eqh on 7700 with a lot of liquidity it was already taken last friday on 7900, also we have 5 waves of elliot and harmonic pattern in the range of 7700-7900
We still in uk100 ATH when all institution begin to sell gradually and uk economy still in acute crisis because inflation and decrease of pbi.
In ressume a lot of confluences to take this short position.
Type of trade: Swing.
Entry: 7840-7900
Our targets
Target 1: 7700
Target 2: 7580
Target 3: 7400
Target 4: 7200
Max x20
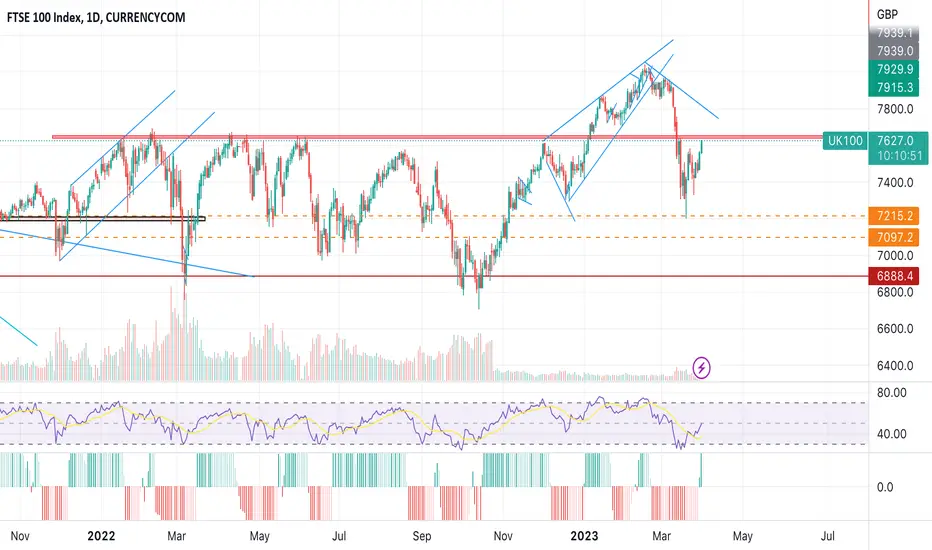
Big Breakdown on FTSE 100/ UK 100After ATH for the FTSE100, the development of bearish divergence within a rising wedge has occurred.
This bearish pattern has broken down now and I AM SHORT at the current levels.
I am looking for the price to come down to 7700 where I will take some profits. Followed by 7600, 7400, and finally 7000
I don't have a stop loss in place as I think it could put in another confirmation high just sub 8100, which would still keep me bearish. I will close the position if a bullish edge develops

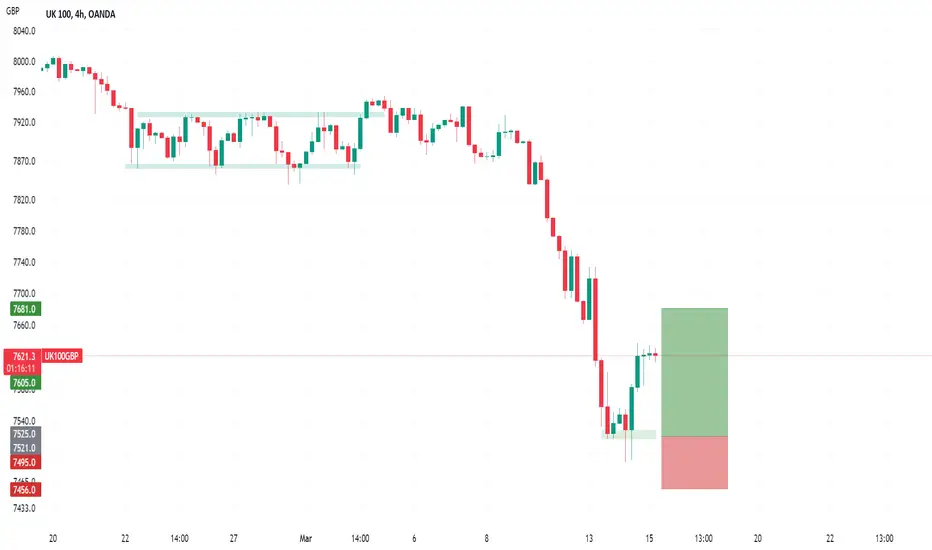
Has FTSE formed a swing low?UK100 - Intraday -
Previous support located at 7600.
Previous resistance located at 7650.
Price action has continued to trend strongly lower and has stalled at the previous support near 7500.
Price action looks to be forming a bottom.
Risk/Reward would be poor to call a buy from current levels.
A move through 7650 will confirm the bullish momentum.
We look to Buy at 7521 (stop at 7456)
Our profit targets will be 7681 and 7711
Resistance: 7650 / 7700 / 7750
Support: 7600 / 7500 / 7400
Risk Disclaimer
The trade ideas beyond this page are for informational purposes only and do not constitute investment advice or a solicitation to trade. This information is provided by Signal Centre, a third-party unaffiliated with OANDA, and is intended for general circulation only. OANDA does not guarantee the accuracy of this information and assumes no responsibilities for the information provided by the third party. The information does not take into account the specific investment objectives, financial situation, or particular needs of any particular person. You should take into account your specific investment objectives, financial situation, and particular needs before making a commitment to trade, including seeking advice from an independent financial adviser regarding the suitability of the investment, under a separate engagement, as you deem fit.
You accept that you assume all risks in independently viewing the contents and selecting a chosen strategy.
Where the research is distributed in Singapore to a person who is not an Accredited Investor, Expert Investor or an Institutional Investor, Oanda Asia Pacific Pte Ltd (“OAP“) accepts legal responsibility for the contents of the report to such persons only to the extent required by law. Singapore customers should contact OAP at 6579 8289 for matters arising from, or in connection with, the information/research distributed.