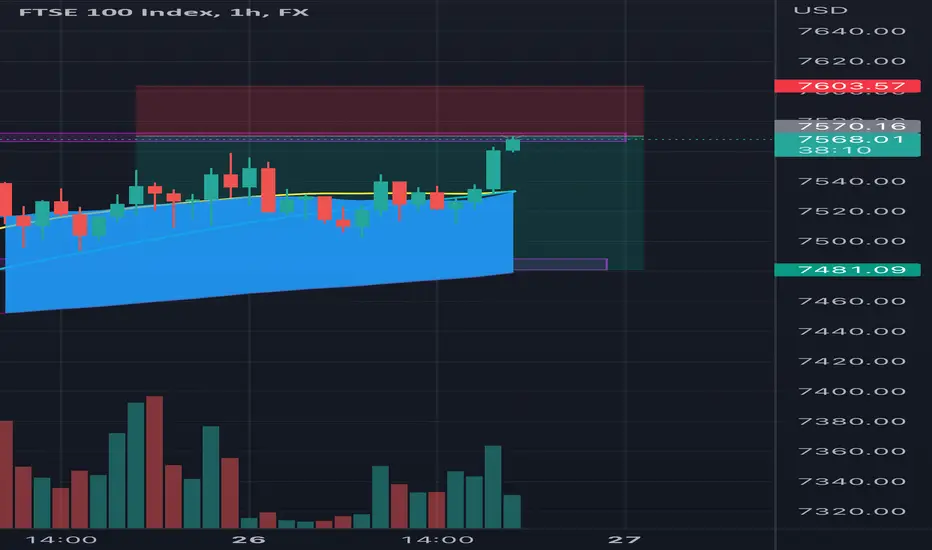
Joe Gun2Head Trade - Fading FTSETrade Idea: Selling FTSE
Reasoning: Initial rejection at 7493
Entry Level: 7468
Take Profit Level: 7375
Stop Loss: 7498
Risk/Reward: 3.06:1
Disclaimer – Signal Centre. Please be reminded – you alone are responsible for your trading – both gains and losses. There is a very high degree of risk involved in trading. The technical analysis , like all indicators, strategies, columns, articles and other features accessible on/though this site is for informational purposes only and should not be construed as investment advice by you. Your use of the technical analysis , as would also your use of all mentioned indicators, strategies, columns, articles and all other features, is entirely at your own risk and it is your sole responsibility to evaluate the accuracy, completeness and usefulness (including suitability) of the information. You should assess the risk of any trade with your financial adviser and make your own independent decision(s) regarding any tradable products which may be the subject matter of the technical analysis or any of the said indicators, strategies, columns, articles and all other features.
UK100 CFD

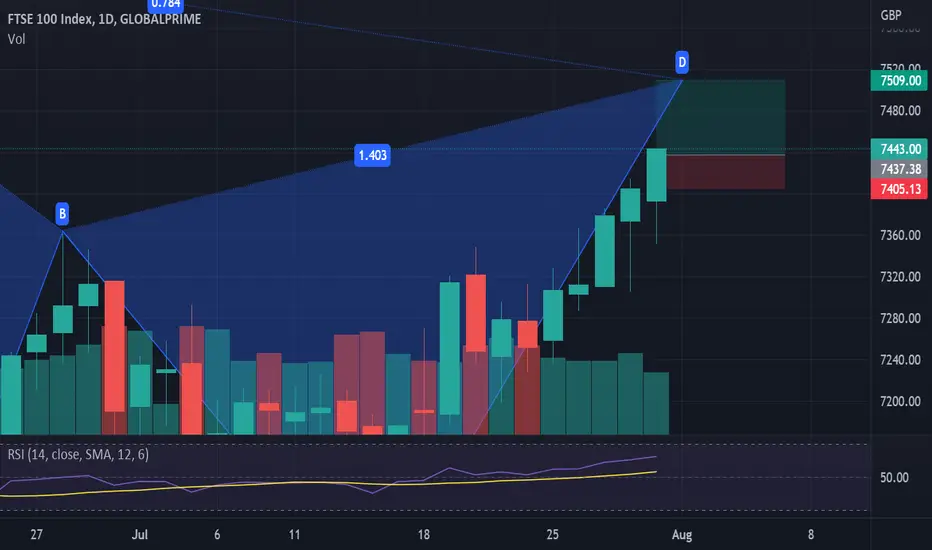
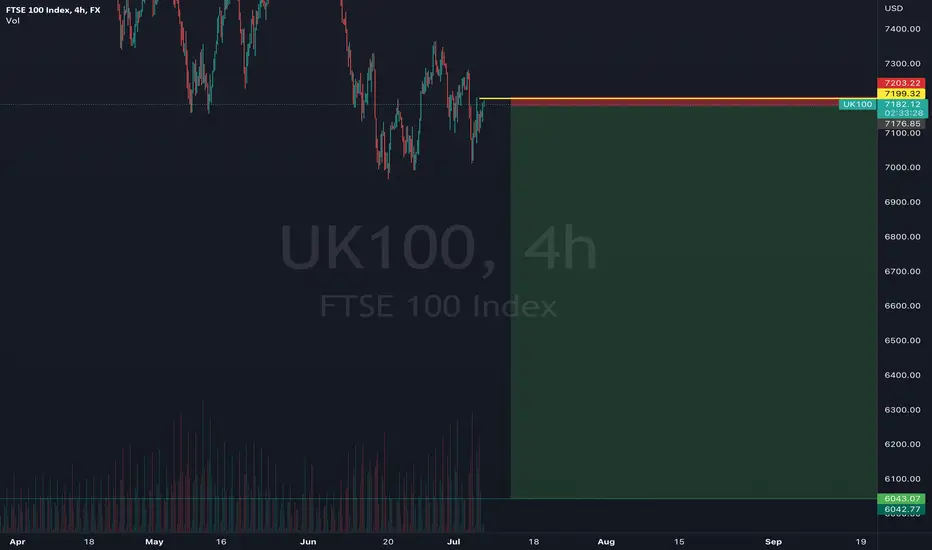
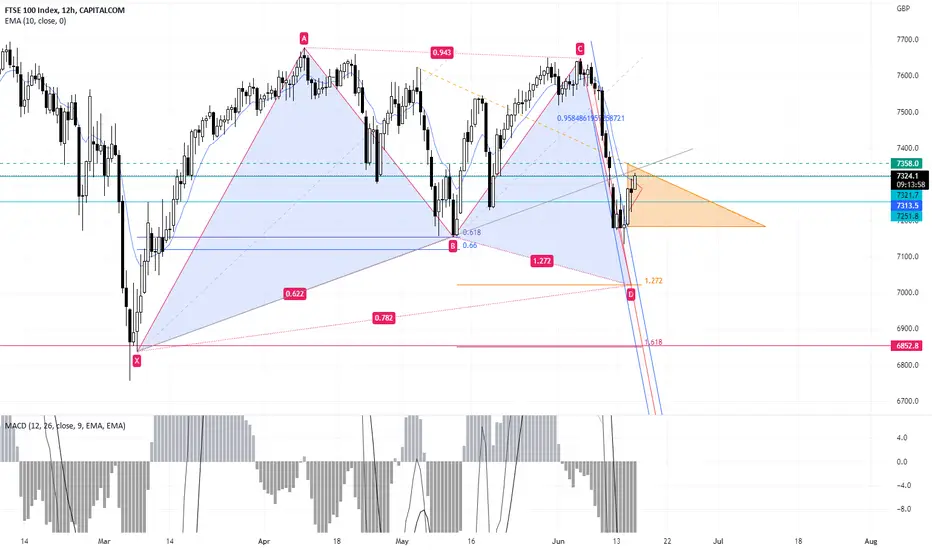
FTSE100/ UK100 longHi traders,
Following an amazing bullish run in the direction of our Bearish Gartley, we anticipate the UK100 to continue being bullish until point D before shorting back to point B. This is an easy sell on the daily timeframe.
Please share your thaughts.
Disclaimer
NASDAQ Guru offers general trading signals that does not take into consideration your own trading experiences, personal objectives and goals, financial means, or risk tolerance.
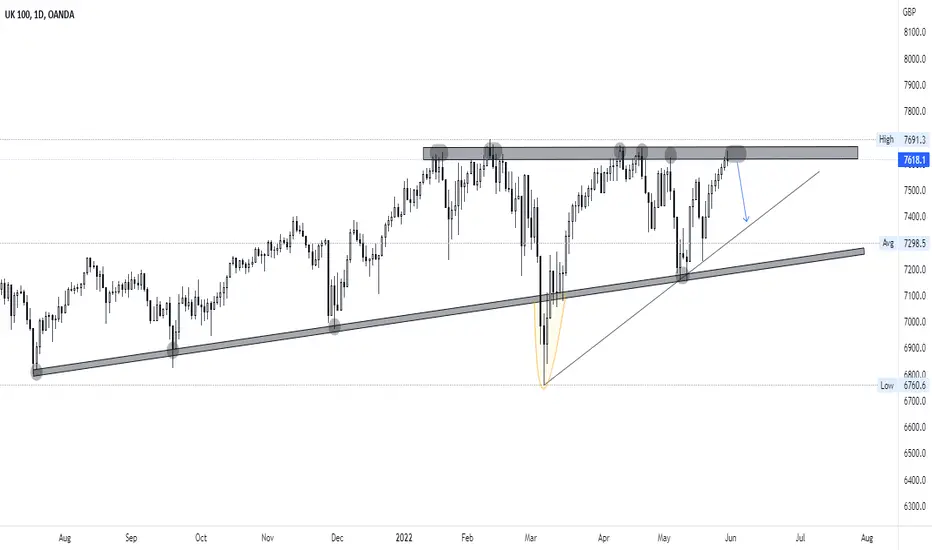
UK 100 FUTURE LOOKING FOR CONTINUATIONFTSE 100 is looking good for continuation, it is trying to break through Resistance and hold as Support.
Channel Up for all of 2021 and half of 2022. Fell out of the pattern into an Ascending Triangle and hit Target 1 and 2.
Ascending Triangle complete and Target 1 hit.
If we fail to break current Resistance we will retrace to Targets 1 and 2.

Ferguson: Uptrend to resume?⏫VALUE BUY - Ferguson Plc - FERG
🔢Technicals
▪️Stock: Bearish
▪️Sector: Industrials - Bearish
▪️1 Month vs FTSE100: 3.91%
▪️3 Month vs FTSE100: -1.67%
🔠Fundamentals
🔸Overall Rank: 12/276
🔸Value: 71/276
🔸Quality: 35/276
🔸Momentum: 109/276
🔸Growth: 9/276
🔸Profitability: 25/276
🔹Entry Zone: 9216.00p - 9576.82p
🔻Stop: 8455.00p
▪️Target1: 10934.00p
▪️Target2: 12023.00p
▪️Target3: 13112.00p
BUY RATING: ⭐️⭐️⭐️⭐️

FTSE100 Targeting A Weekly Wave 4 LowIn this update we review the recent price action in the FTSE100 and identify the next high probability trading pattern and price objectives to target

UK100 12th JULY 2022100 selected UK big companies that are components of the FTSE 100 index. Bullish trend may end this day. I see a bullish potential, the price is in the hourly resistance area. Price is possible to be bullish in the future.
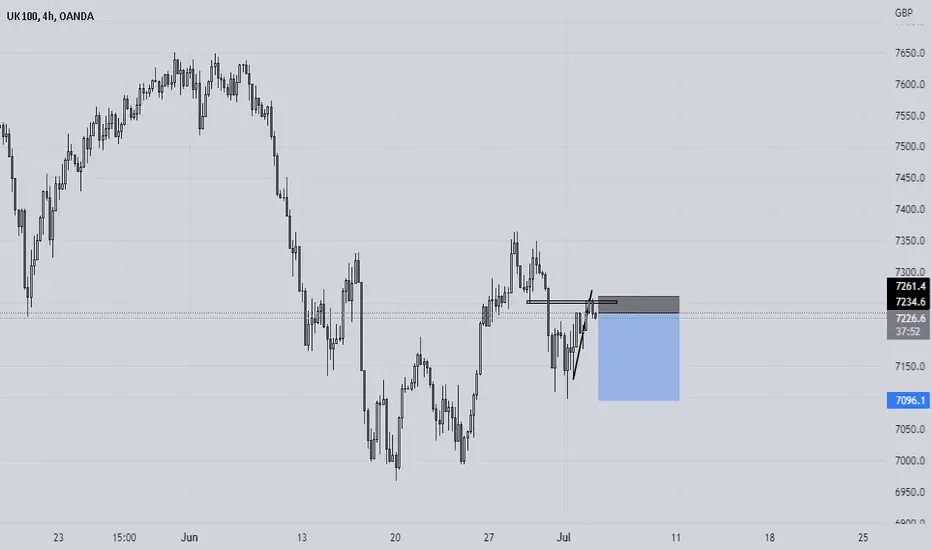
LONG POSITIONBuy on Retest Confirmation for the Upside.
UK100 showing some bullish momentum
am looking for a short ter, buy
FTSE sell @borisjohnsonRisking 27 for 1136 pips. It may not give up so easy but, what if, Boris, and most likely, resigns today? What’s happening at the moment in UK’s politics is like cannibalism. One cannibal gets injured and the rest turn on them and devour down to the bone. It’s difficult to survive this orchestrated attack. Look for a power struggle between the remaining cannibals. The whole thing makes no sense. I think the ship is going down and the rest will be his-story.
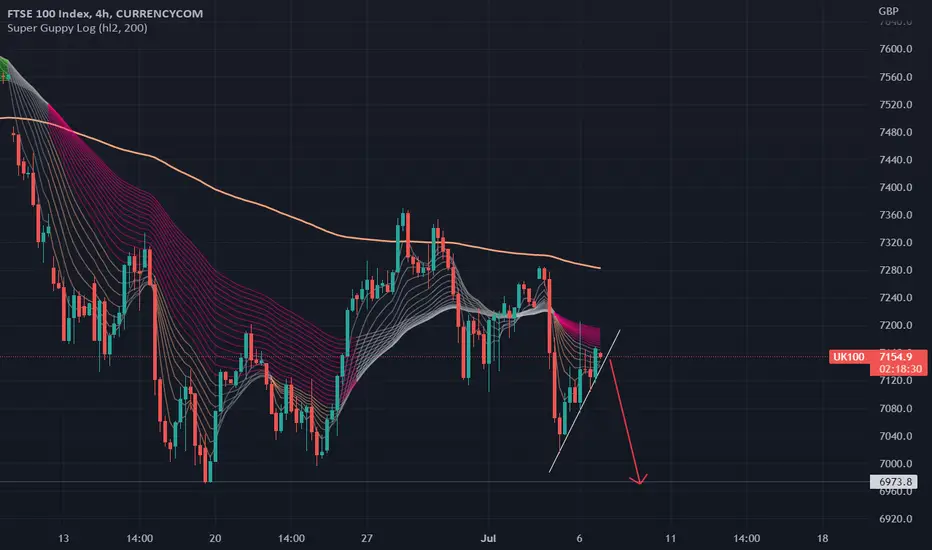
Uk100 Sell IdeaUk100 is in a downtrend.
1. On H4 its due for another swing low
2. On the daily there is a bearish engulfing candlestick pattern
3. This move down is actually at the 718 and I expect a move down from here.
So look for the entry to sell.
This trade idea is based on Fibonacci
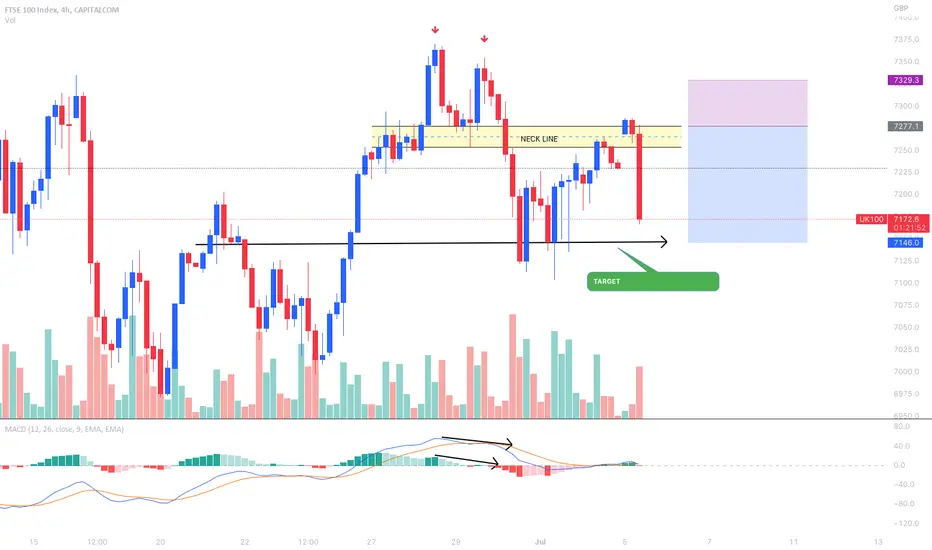
Lets Go Short – Double Top On The UK100Hi Traders,
Today we are on the UK100
In the 4-hour time frame, we see a nice double top.
My entry was the deepest point of the neckline.
I waited for the price to retrace to the deepest point at the top of the resistance of the neckline.
My short position opened then.
I had confluence from the divergence across the MACD as well as the large bearish volume that occurred during the impulsive break of the neckline.
My target is previous support which gives me a Risk/Reward of 1/2
Have a good Tuesday!
The Vortex Trader
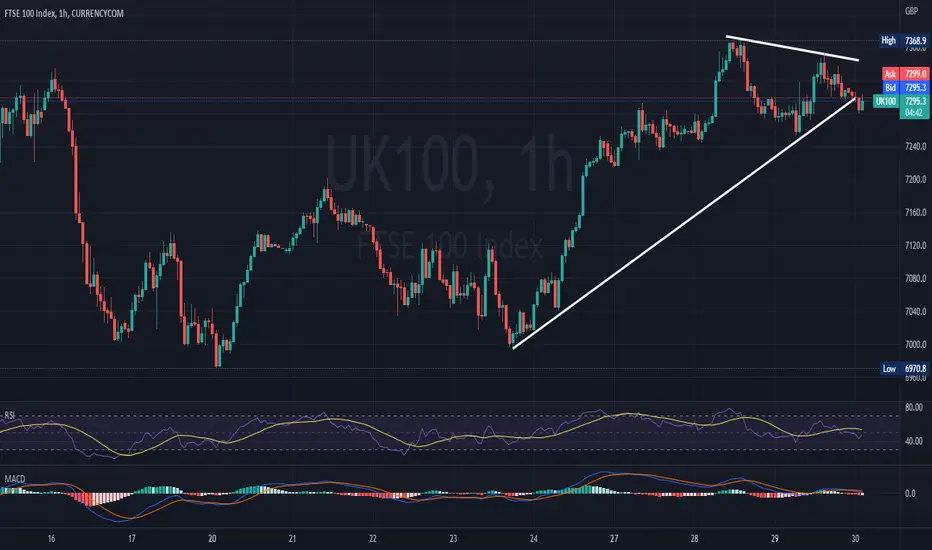
UK100 BEARISH PATTERNUK100 CFD had broken the support of the triangle pattern that was formed on the 1H graph. The histogram of MACD indicator is still below the zero line, also confirming a bearish outlook for the instrument.
If the price of the instrument continues its current movement, it might reach levels below 7040. On the other hand, if price reverses, it will most probably test the resistance of the triangle at 7350.
Risk Disclosure: Trading Foreign Exchange (Forex) and Contracts of Difference (CFD's) carries a high level of risk. By registering and signing up, any client affirms their understanding of their own personal accountability for all transactions performed within their account and recognizes the risks associated with trading on such markets and on such sites. Furthermore, one understands that the company carries zero influence over transactions, markets, and trading signals, therefore, cannot be held liable nor guarantee any profits or losses.
UK100 21st JUNE 2022London's UK100 rose on Monday, boosted by gains in financial and energy stocks. London's main share index fell last week on escalating worries about a recession and bets of bigger interest rate hikes after a cautious raise by the Bank of England.
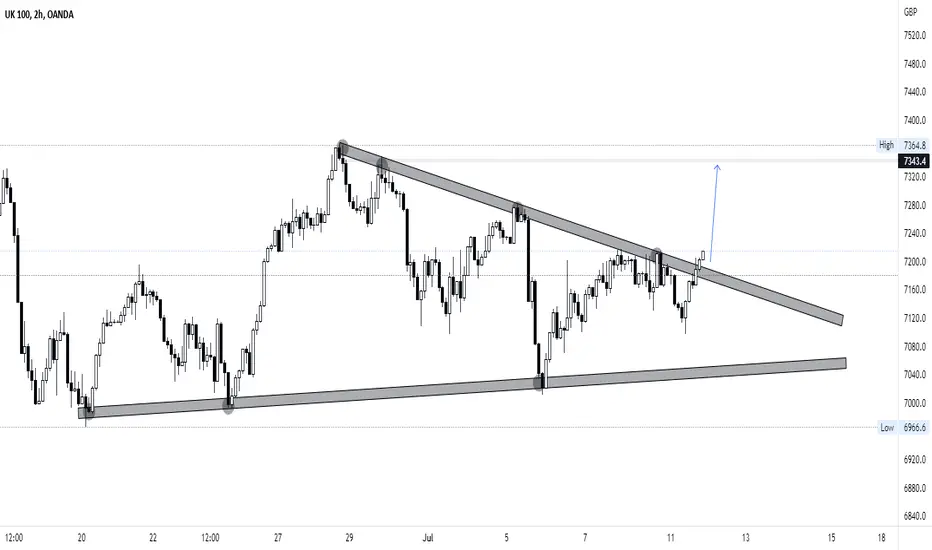
Short Opportunity on UK100 According to A falling wedge pattern is seen as a bullish signal as it reflects that a sliding price is starting to lose momentum, and that buyers are starting to move in to slow down the fall.
Divergence on CCI
UK100 - Pump 15 June 2022 - Possible Descending Triangle Non bias, a possible descending triangle forming. Take care to know your support and resistance levels.
FTSE100 Turning Time?FTSE100 is not a growth index but value based. We debate inflation but entered in recession talk, for FTSE100 consumer stands strong is very important but UK Govt inject money again but it is not a solution. Index got a big part over 17% OIL shares but Oil can slip at some point.

UK100 13th JUNE 2022100 selected UK big companies that are components of the FTSE 100 index, only 9 stocks record gains, while 91 stocks losses and 1 stock traded unchanged. Bearish trend may end this week. I see a bullish potential, the price is in the weekly strong support area. With a tail tolerance of 4.3% below the support area. Price is possible to be bullish in the future.

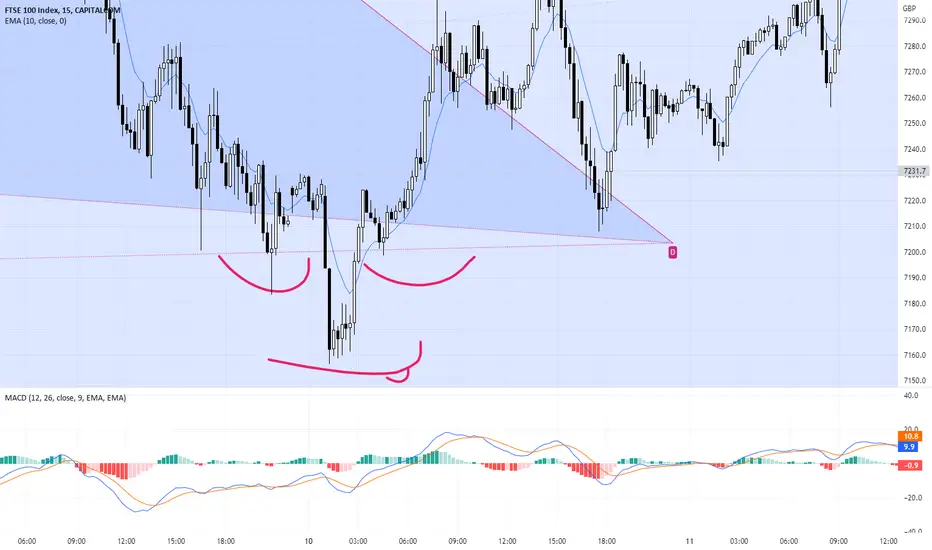
Reverse Head and Shoulders - Beautiful ThingThe funny thing about this trade to me was how I traded this so wrong and absolutely got, well I traded this wrong. To read the very next day from a book so close to me about trading. Doh, reverse head and shoulders! And what's even more fun, is the failed reverse head and shoulders (not depicted here). Got me twice. :) Wont get me again. This was the UK100 15 minute.
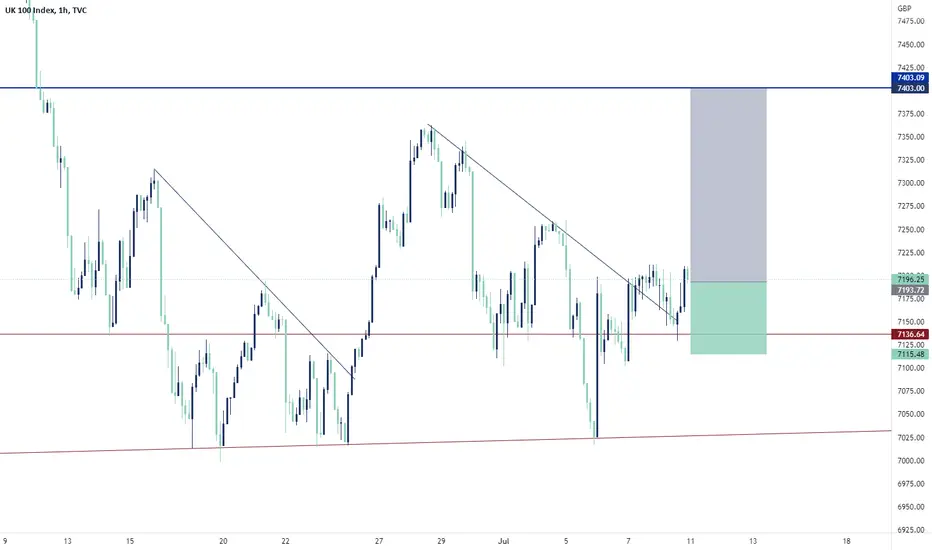
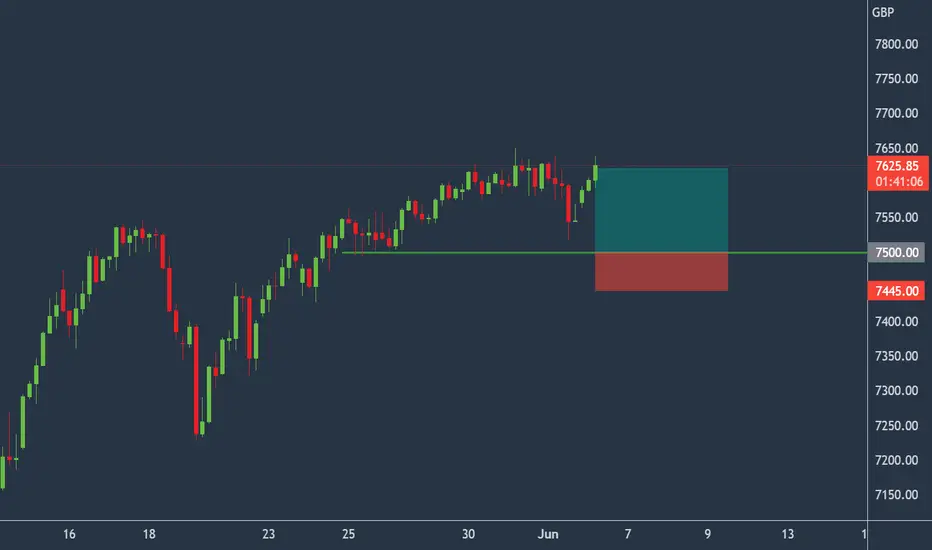
FTSE - Strength to continue? UK100
Intraday - We look to Buy at 7500 (stop at 7445)
Previous support located at 7550. Previous resistance located at 7620. A lower correction is expected. Risk/Reward would be poor to call a buy from current levels.
Our profit targets will be 7620 and 7650
Resistance: 7620 / 7650 / 7700
Support: 7550 / 7500 / 7450
Please be advised that the information presented on TradingView is provided to Vantage (‘Vantage Global Limited’, ‘we’) by a third-party provider (‘Signal Centre’). Please be reminded that you are solely responsible for the trading decisions on your account. There is a very high degree of risk involved in trading. Any information and/or content is intended entirely for research, educational and informational purposes only and does not constitute investment or consultation advice or investment strategy. The information is not tailored to the investment needs of any specific person and therefore does not involve a consideration of any of the investment objectives, financial situation or needs of any viewer that may receive it. Kindly also note that past performance is not a reliable indicator of future results. Actual results may differ materially from those anticipated in forward-looking or past performance statements. We assume no liability as to the accuracy or completeness of any of the information and/or content provided herein and the Company cannot be held responsible for any omission, mistake nor for any loss or damage including without limitation to any loss of profit which may arise from reliance on any information supplied by Signal Centre.
LSEG looking leggy - SELLREASONS TO BE BEARISH
Recently lost the 100 week SMA and just re-tested it for resistance
Fell out of the exponential green top zone in March 2021
As far as the RSI is concerned, broke into the bear zone (below 40) and confirmed it for resistance failing to reclaim 60s
Target of 2,700p would coincide with the 0.618 fib retrace of the entire move from March 2009
This would take us back to Jan 2017 levels
Only saviour for the bulls would be to reclaim the 100 week SMA, given we are still in the upper-half of the exponential channel
That said, with only air below, I don't see the mid-point of the channel (at 6,400p) holding in the months ahead...
Not a terrible risk/reward entry for a short from these highs....

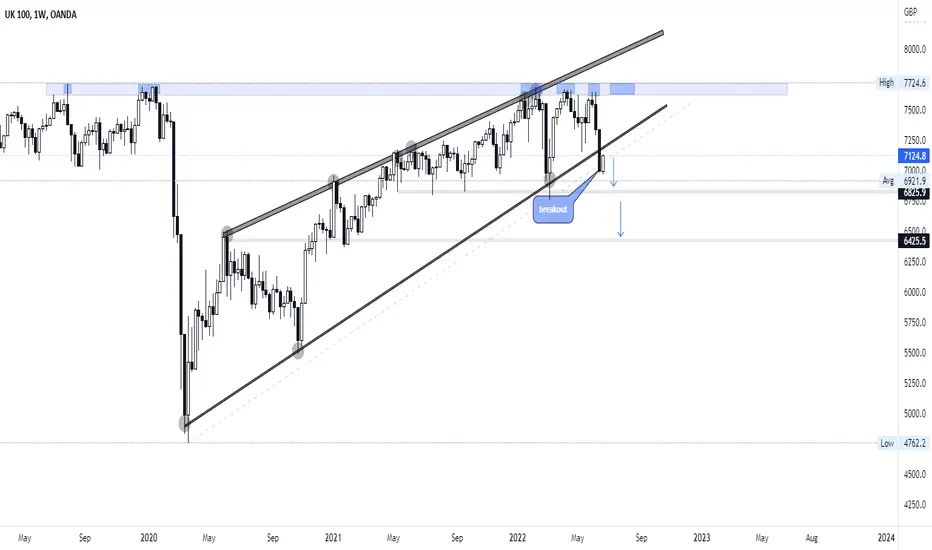
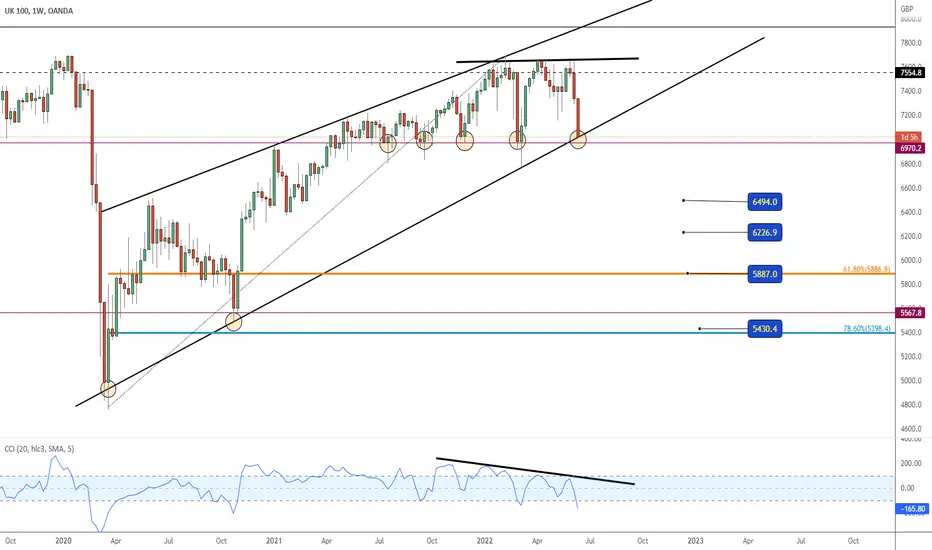
FTSE 31st MAY 2022OANDA:UK100GBP have no power to breakout above the highest resistance area Aug 2019 - Jan 2020. Last month UK100 was bearish to the diagonal trendline support, and returned to the horizontal resistance area . However, at the end of 2021 there was a bearish divergence signal. where the price is bullish but the flat indicator value tends to bearish.
Bearish potential on the UK100 Weekly, Check this out :
UK100 Weekly
Timeframe. According to the stochastic 5 3 3, it seems to be back in the overbought area, it will be strengthened to bearish if the indicator crossover.
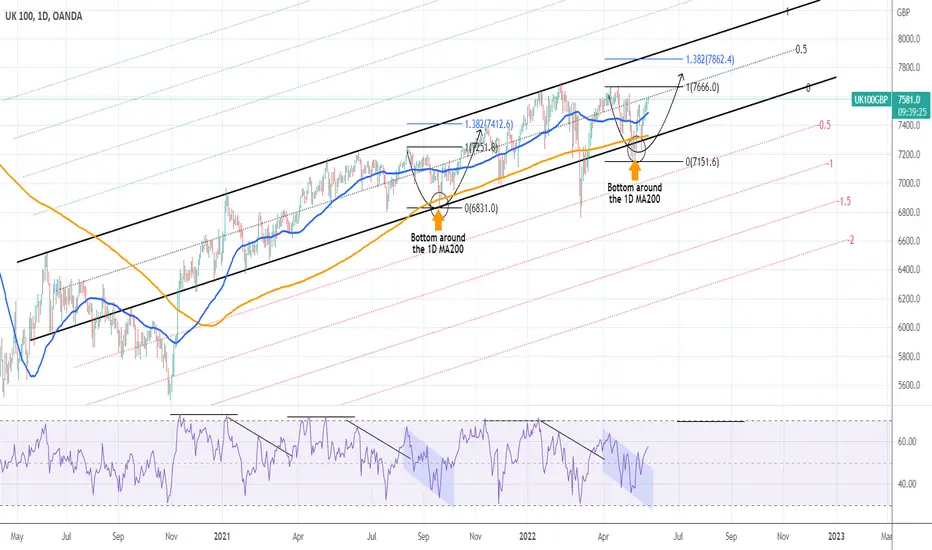
FTSE100 One of the best index buysThe FTSE100 index is approaching its 2022, a rare feat among the leading global stock indices, the majority of which are making Lower Lows. This strength is technically derived by the bullish dynamics of the Fibonacci Channel Up it has been trading in since 2021, which only broke during March's correction.
The price action since April 10 is similar to the sequence of August 11 - October 11 2021. The bottom on both pattern was made after the 1D MA200 (orange trend-line) broke. The latter sequence went on to make a Higher High on the 1.382 Fibonacci extension. That extension on the current pattern is around 7860 and that is our Target by July.
--------------------------------------------------------------------------------------------------------
Please like, subscribe and share your ideas and charts with the community!
--------------------------------------------------------------------------------------------------------
Uk100 slight shortShorting UK100 high probability of price drop before another bullish run. Take caution and don't over risk it. Will add more analysis description shortly