UK100 - A Big Test AboveIt's been a highly volatile period in the markets, with equities coming under severe pressure as a result of high inflation, the Russian invasion of Ukraine, and the sanctions against it that followed.
The UK100 has shown more resilience than its European peers during that time, in part as a result of the UK having fewer trade ties - particularly oil and gas - and due to the weight of commodity stocks within the index. Soaring commodity prices are naturally beneficial for those companies, which has to an extent shielded them during the declines.
Of course, they haven't been entirely immune, particularly those with direct exposure to Russia. The weakness in the pound may have also helped given how much revenue from FTSE 100 companies is generated outside of the UK.
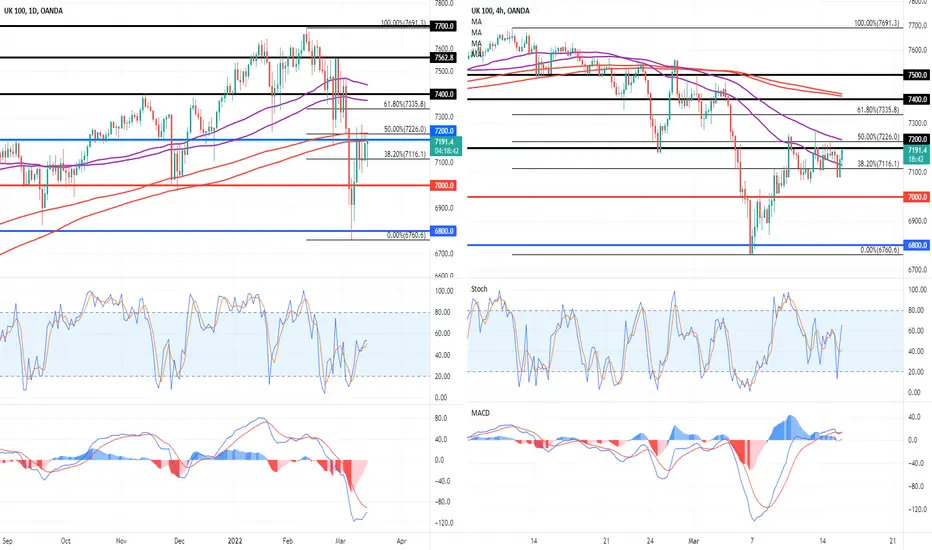
That said, the index has still fallen into correction territory during that time and below the 200/233-day SMA band. After seeing support around 6,800 we have seen a partial reversal of those losses, buoyed by talks between Ukraine and Russia which both sides suggest are making positive progress.
It is now running into resistance in a very interesting area on the chart. The 50% Fibonacci retracement - February highs to March lows - falls around the 200/233-day SMA band which is now being tested as resistance, having previously been support. A rejection of this level could be a very bearish signal while a break above here could be quite the opposite.
Ultimately, this is a very headline-driven market and volatility is expected to persist. If we do see a move above, 7,335-7,400 is the next big test, with the 61.8 fib, 55/89-day SMA band and prior resistance combining. A failure at the 50 fib could see attention shift back to 7,000 - a major psychological barrier, prior support and resistance, and roughly the mid-point of the recent lows and highs.
UK100 CFD
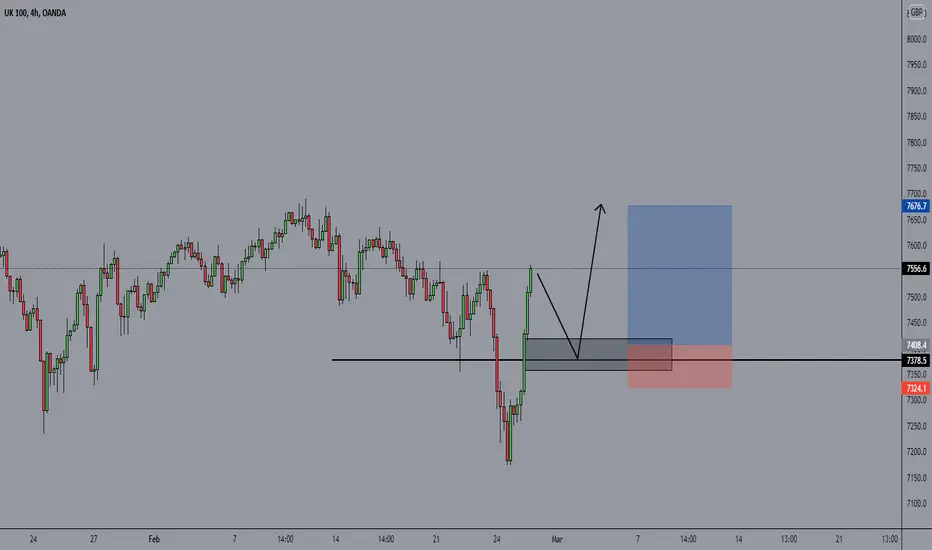
Scalp trade for UK100Hey guys,
I've been scalping for 2 years and decided I woud start sharing my ideas.
Waiting for:
RSI confirmation
EMA confirmation
Trend already acknowledged
Key levels mapped out.
I'm in and out pretty quick, 10-15 pips with a decent lot size. This is just my method and works for me. I wouldn't recommend this if you are new to trading or inexperienced with good entries/exits.
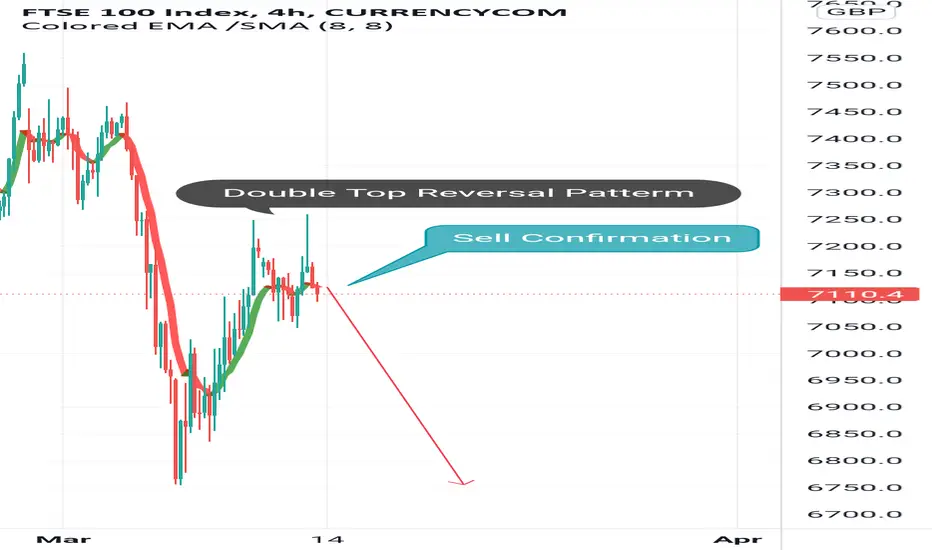
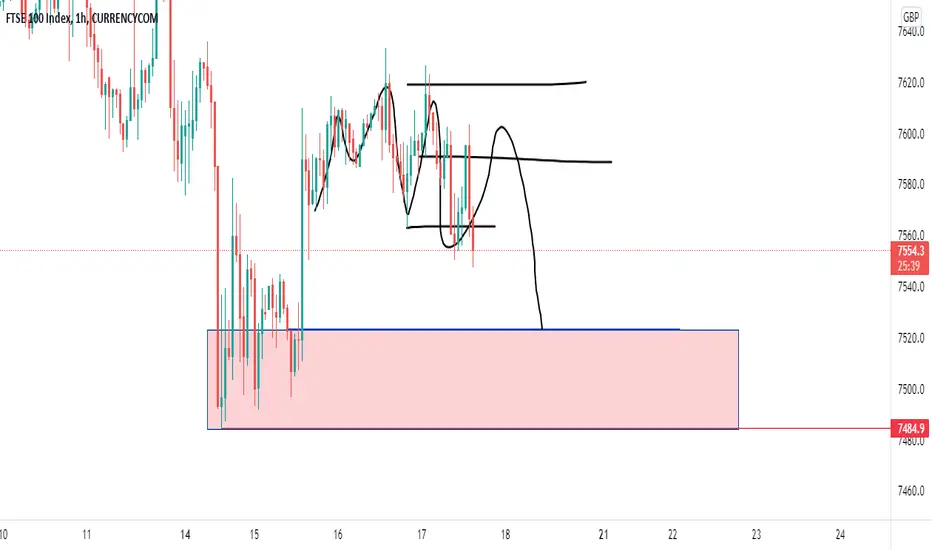
UK100 Index Sell IdeaThis is going to be a amazing trade.
Details are on the chart but price is making huge lows and huge lower highs and huge lower lows on the hour 4 time frame.
So there is a confirmation to sell.
Uk100 sell ideaHoping to see a nice rejection from the fib level then hopefully a nice ride down to the last low, hitting areas of resistance from previous lows.

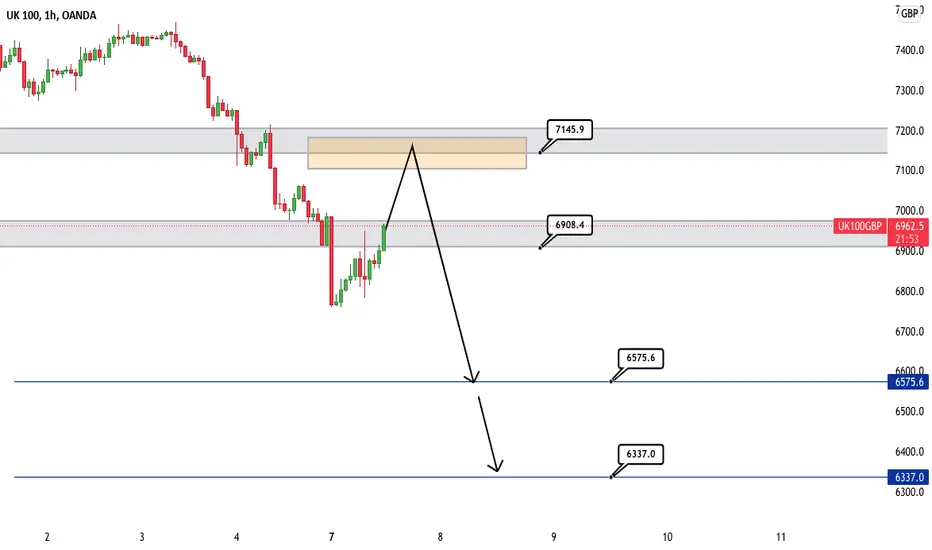
UK100 Golden area of sell Ftse100 is currently retracing after a very big movement to the downside. This retracement can take us up to the golden area of 7145. Here we can sell to push prices back down to the support area of 6900, if broken can take us to areas of 6575-6337.
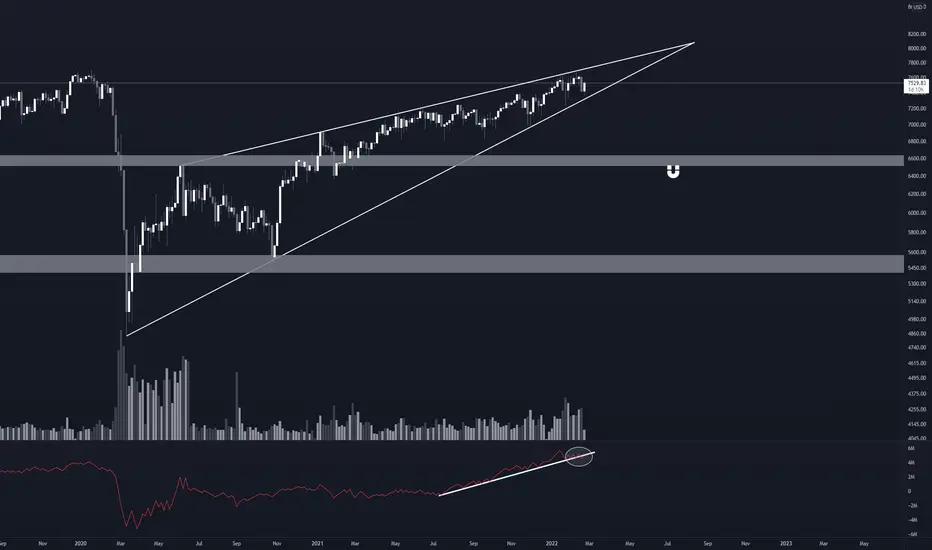
UK100 - Massive rising wedge near breaking pointThe UK100 is looking very bleak for the foreseeable future. A massive rising wedge has formed on the 3D and looks to break at any point in the next couple of months.
Combine this with rising inflation and fears of conflicts in Russia, all provides the perfect setup for the UK100 to take a large pull back.
It is also worth noting that the OBV has broken down already, is the rising wedge next?
1.35 trillion euros till June 2021A good analogy would be inserting a couple of mentos candies into a bottle of Coke. Then shake it for a while and you open the cap and see what happened.
The carbonated drink would fizzled out explosively, gushing out from the mouth of the bottle as fast as it could.
Similarly ,with the trillion of euro dollars to be pumped into the system by ECB, the stock market would also enjoy an explosive growth.
Compared with SPX500, UK index still has a long way to catch up.
Whilst SPX 500 still has about 6% more to rise before it revisit the peak at 3396 level, UK index has 3 times about, ie. 18% to reach 7659 level.
Just watch the bullish trend line for UK index remains intact. If it breaks down (which is unlikely for this year), then this trade opportunity ceased.

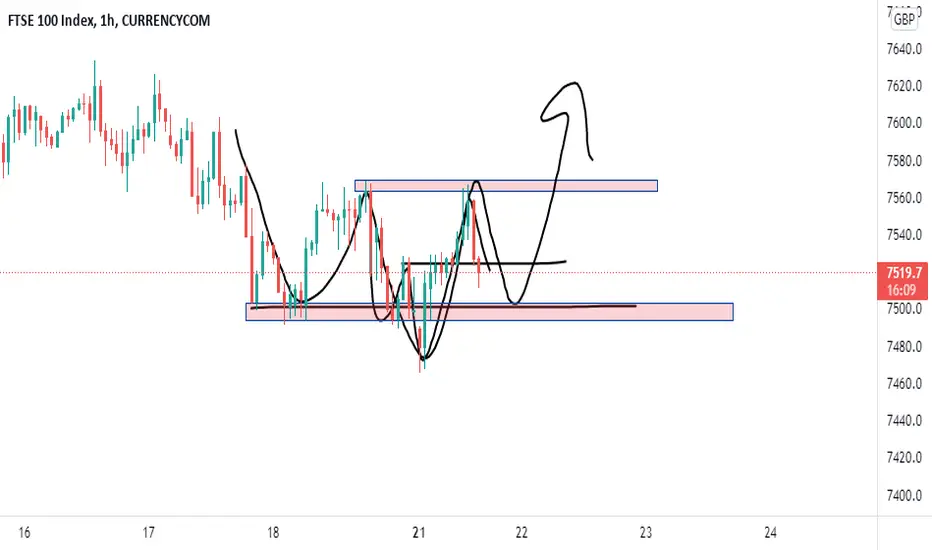
Possible Long Opportunity on UK100 According to Possible Head and shoulders in formation
CCI Below Level Zero

UK100 looking promisingGood setup for UK100, will be looking to go long when prices comes to my marked zone...
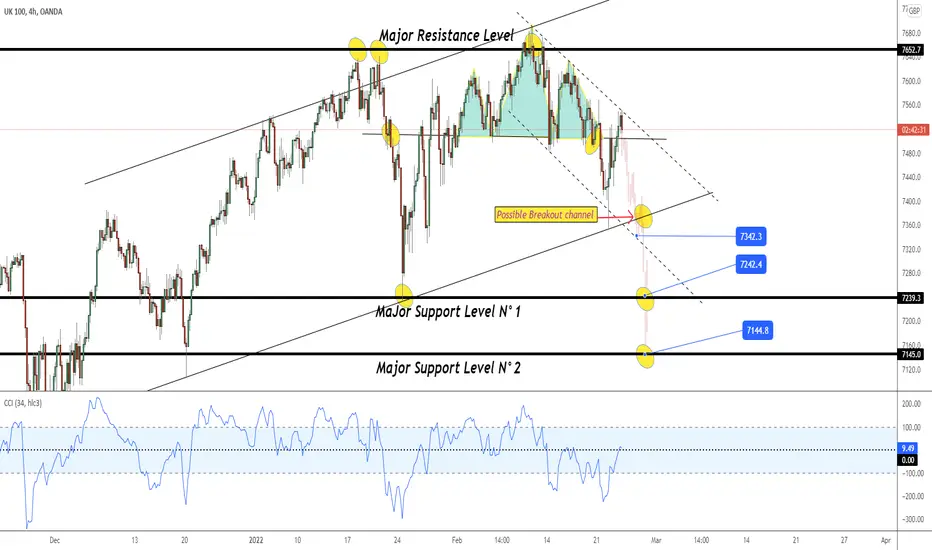
Short Opportunity on UK100 According to Head and shoulders
Downtrendline channel
Resistance and support level
Convergence on CCI
UK/FTSE 100 SHORT ZONE LIVE AnalysisHere we have our FTSE 100 Full Analysis,
After global tensions increasing and the UK Putting sanctions on Russia we have seen a fall in the price of the FTSE followed by a rise on Good company earnings and Oil company profits with rising prices due to the threat of supply.
As we return to former highs and some strong resistance we can look to get short on the FTSE. We can progressively Trade this move down to some comfortable support for an full exit before turning long. The current price rejection zone is being hit by impulsive upmoves.
Use Arrows/Eclipse symbols as a guide.

uk100 this is my view on chart next keep eyes on this. this is creat a inverted head and sholder form lower side. this a sing of weakness and last few days straling is quit bullish as my views

UK100 - complex correctionCrawling upside, looks like a corrective structure at this point.
Approx in the middle of the structure.

UK100 -- Bullish ProjectionsI like the Idea of bullish action on daily chart. We also have some nice bullish action on H4 which supports this. Let's see how it plays out!
Trading Idea --- NOT AN INVESTMENT OPPORTUNITY!
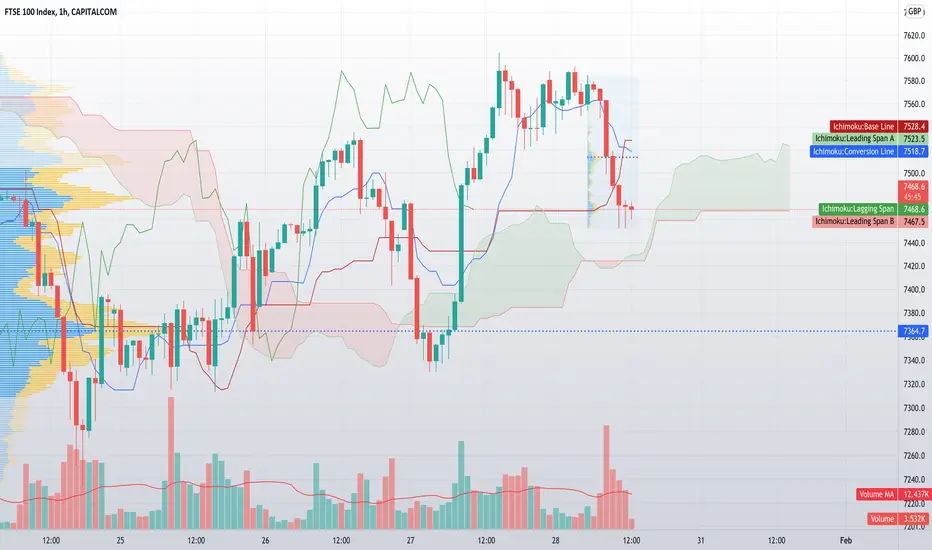
UK100A quick look at the FTSE100 Index using the traditional Ichimoku Cloud Settings of 9,26,52,26 and the MACD Indicator.
The Ichimoku Cloud Conversion Line (Tenkan Sen) is indicating that the Mid-Point of the Short-Term momentum is downwards at the moment.
The Ichimoku Cloud Base Line (Kijun Sen) is indicating the Mid-Point of the Mid-Term momentum is sideways at the moment but that may possibly change to downwards momentum once a significant low is created for the 26 periods.
The Ichimoku Cloud Lagging Span (Chikou Span) is indicating that momentum at the moment is downwards. Note that the Lagging Span (Chikou Span) is now under the Price from 26 Periods ago.
At the moment the Price is still in the Bullish Zone of the Ichimoku Cloud but is getting close to the Ichimoku Cloud Leading Span A (Senkou Span A) support level. At the moment of typing this, there is very little distance between the Leading Span A (Senkou Span A) and Leading Span B (Senkou Span B) support and resistance levels below the price.
Note that the Leading Span A (Senkou Span A) level is pointing downwards.
Note that the Last 5x Volume Bars have closed above its Volume 20 Period MA in the red.
The Price is still below its Volume Profile Fixed Range Point of Control (VPFR POC) for the Fixed Range of 8x 1hr candles that i have selected.
The Price is still way above its Volume Profile Visible Range Point of Control (VPVR POC) for this charts Visible Range.
If we look at the Moving Average Convergence Divergence (MACD), we can see that the MACD Line is still under is Signal Line and is indicating momentum is downwards at the moment. Note that the MACD Line as dropped under its 0.0 Base Line into the Negative Zone on this 1hr timeframe and that the Red Histograms are increasing in size. If you are waiting for confirmation to go long, you need the MACD Line to cross back ABOVE the Signal Line creating a Buy Signal for this 1hr timeframe.
Be on the lookout for a break below the Leading Span B (Senkou Span B) level into the Bearish Zone and a successfully re-test of the Leading Span B (Senkou Span B) level as Resistance, after that, full Bearish confirmation on this 1hr timeframe will be when the Leading Span A (Senkou Span A) crosses below the Leading Span B (Senkou Span B) creating a Kumo (Cloud) Twist into a new Bearish Red Cloud.
I hope this is helpful with trading.
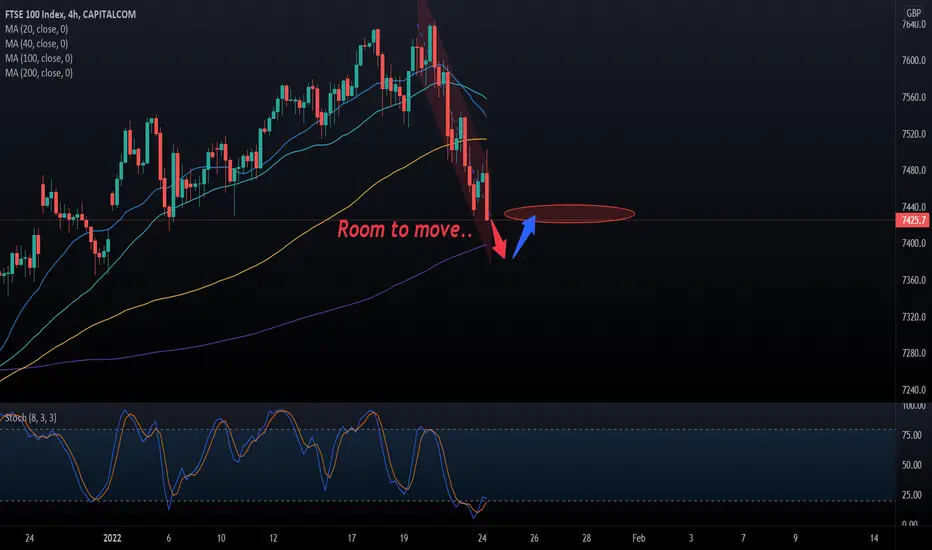
FTSE 100 with room to fall..For more Daily Detailed analysis, go ahead and click on the follow button. If you have any questions, please do ask them!
Here we have our Detailed FTSE 100 chart..
On the latest Market sentiment we have seen a drop to the downside. This move has left us nearer our Key MA's and some comfortable support areas.
We are looking long slightly lower on this mornings fall. There is room to move To Greater support.
Look long and Exit at the eclipse symbol area for your first target.
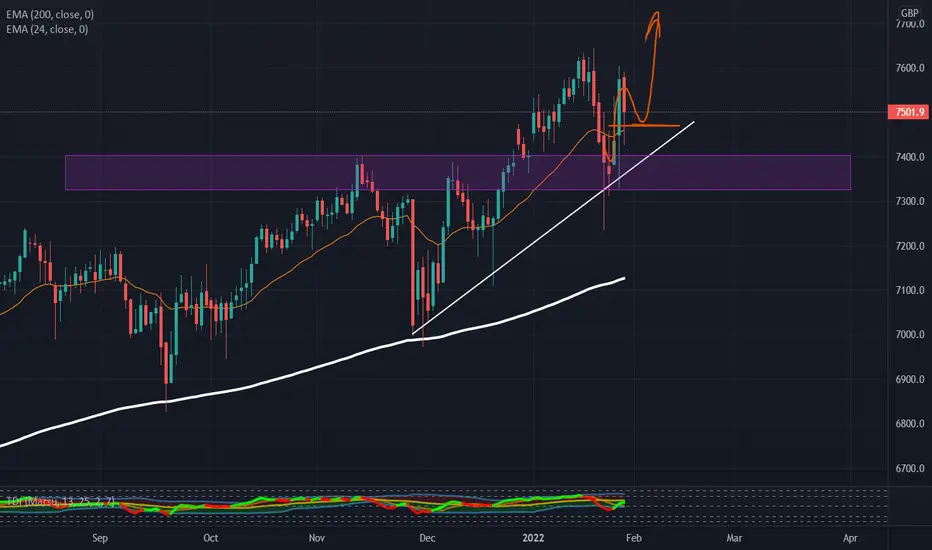
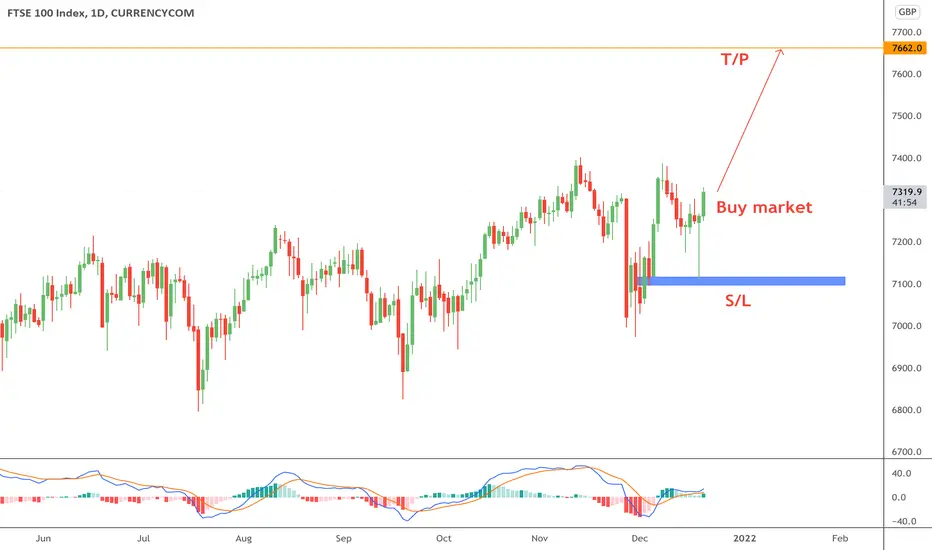
UK100 LongUK100 has nice uptrend, Today is the day to enter to new wave. $7650 is next target. S/L is around $7100. Good luck!
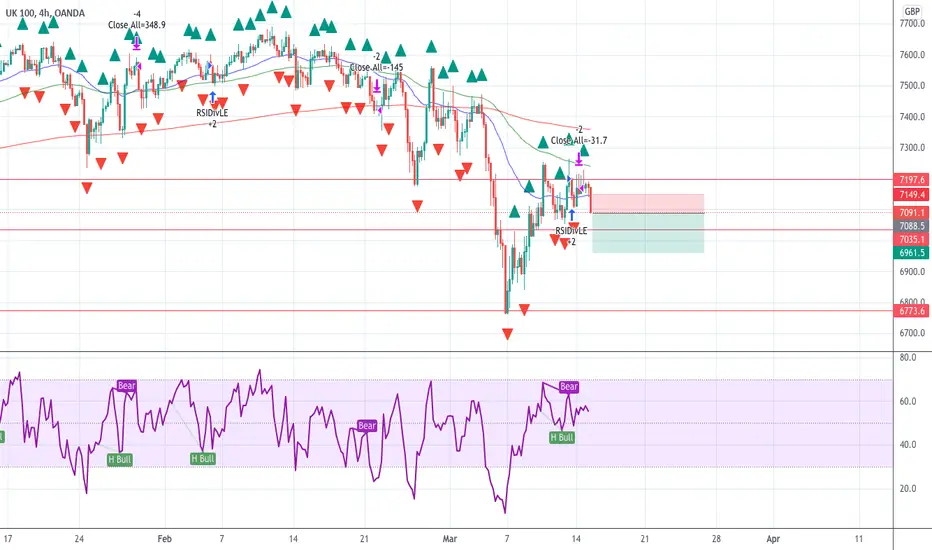
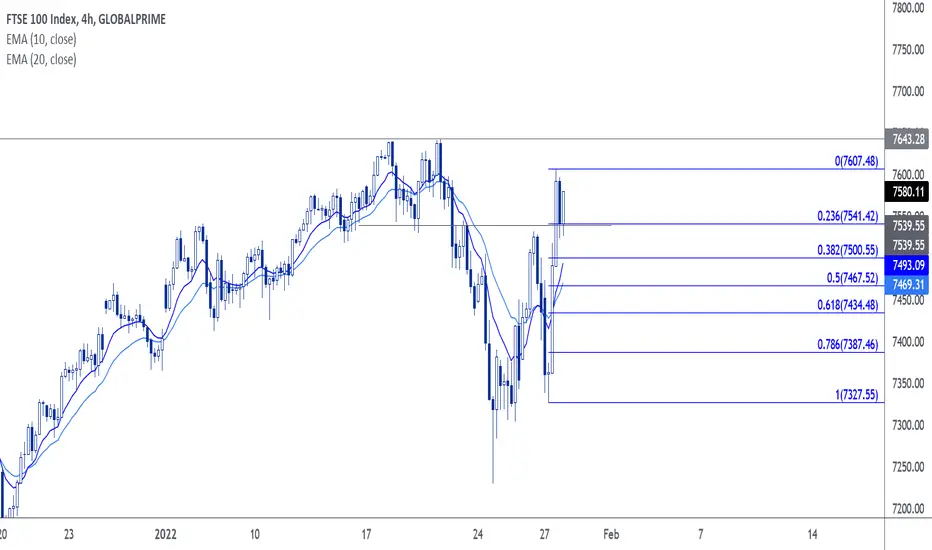
UK100 H4Identifying a reversal, we have 2 patterns here. First the double top that occured as price failed to break the all time high, along with a breakout of the rising channel. Watching the lower timeframe for slight retracements & a bearish continuation.

FTSE IntradayOn our UK100 charts this morning we are looking for an intraday long.
Price action is showing us early signs of price rejection around the current 7580 level. This leaves us a fair profit margin to hit especially with the lack of News this morning leaving less downside risk.
See the wick candles for early indication. Exit is at the eclipse symbol area.

UK100 GOOD UP SPIKE CORRECTION FOR SHORTAnother short opportunity. With the UK inflation is on 20 years record just released. This is very great opportunity. good R:R. Target on the support.
