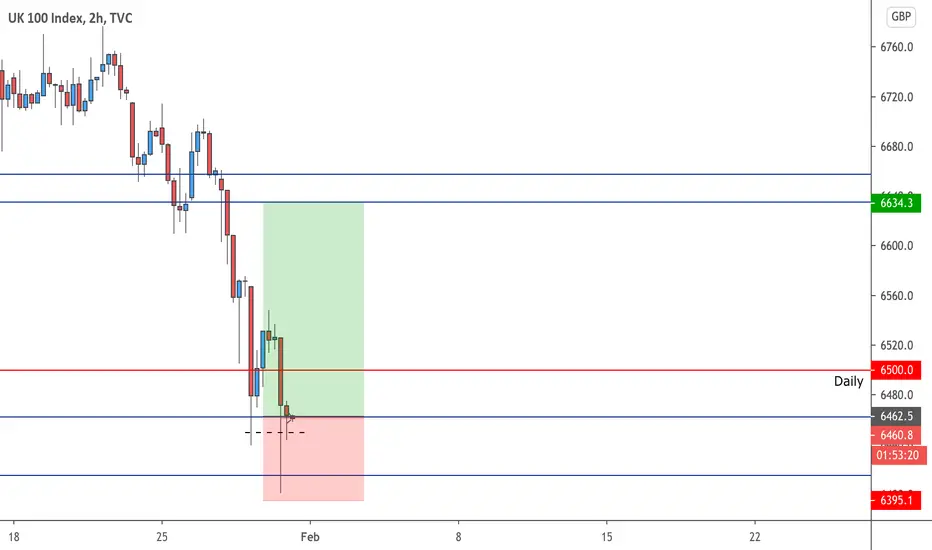
UK100 LONG BIAS Price in the short term is in a bearish decline, while the medium to long term trend is bullish. Price has declined to a key area of previous resistance and potentially support on the Daily timeframe. Based on price action I believe this could be a key area where price could reverse to test previous broken support. I don't expect price to hit this target till next week.
UK100 CFD
FTSE100Trade idea
Impulse move now corrected to the initial demand zone
IF unchanged / positive Economic data Look for potential Longs
19TH OF Feb (Multiple FTSE companies Earnings report ) A day to watch IF trade ongoing.

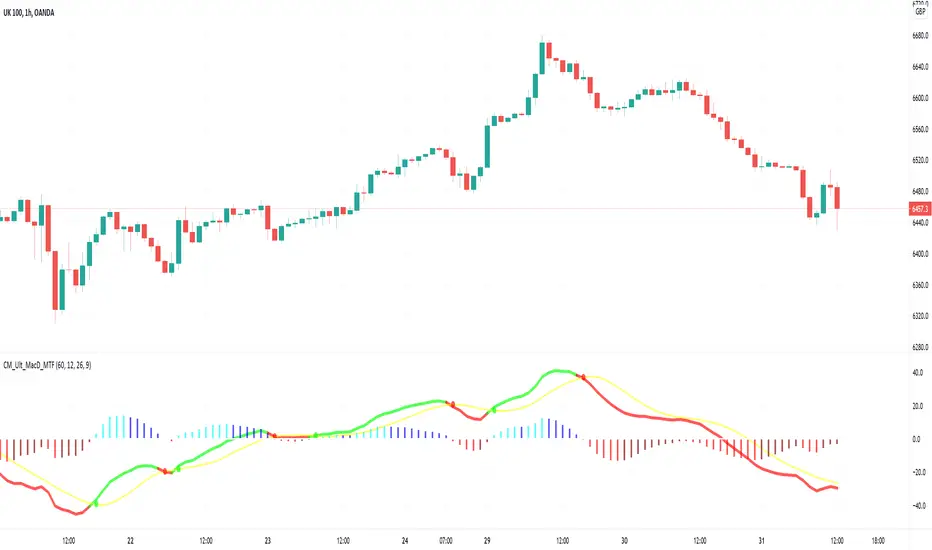
Pretty Good Oscillator Indicator
In a Downtrend:
Only sell
1. At the end of the overbought area
2. Add when crossing below 0 line
3. Add at the start of Oversold
In an Uptrend:
Only buy
1. At the end of the oversold area
2. Add when crossing above 0 line
3. Add at the start of overbought
Indicator Settings
Period 28
Overbought 2
Oversold -2
Your Capital is at Risk. This is only an educational video.

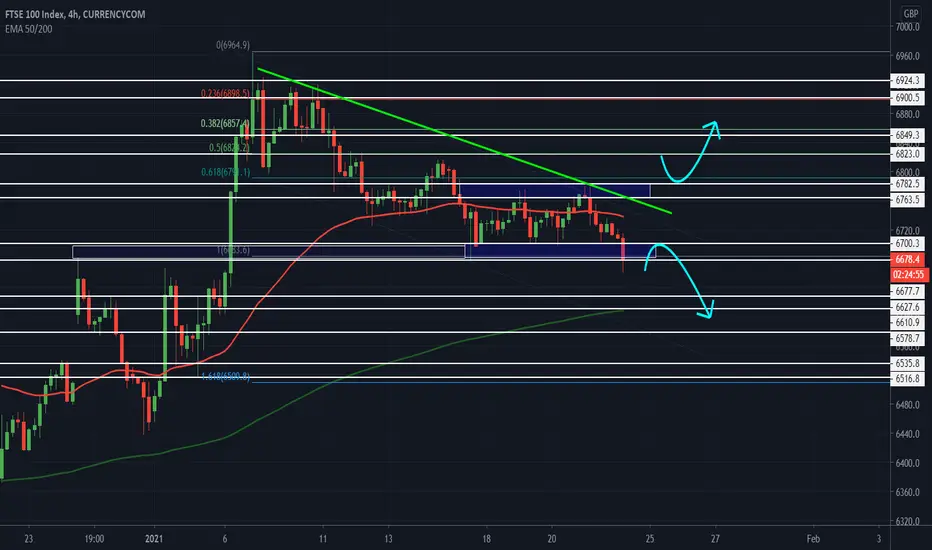
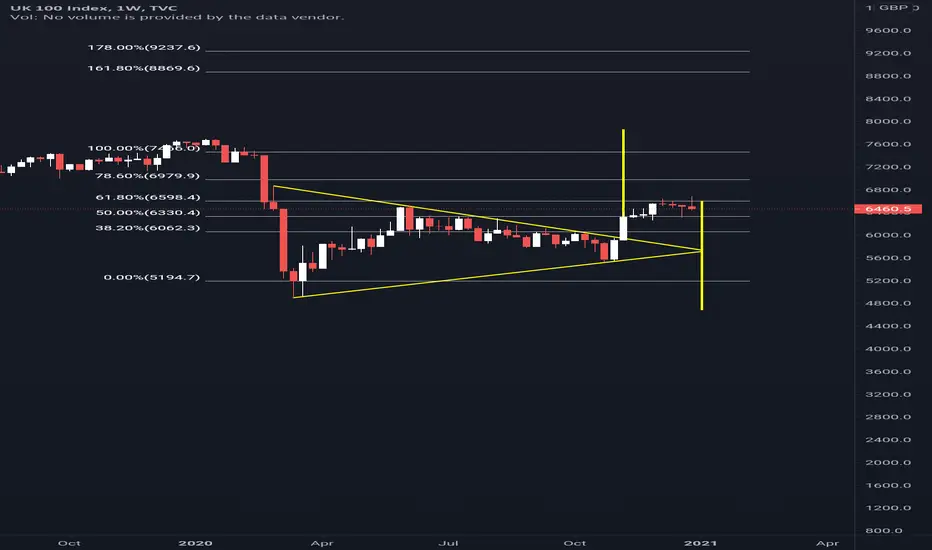
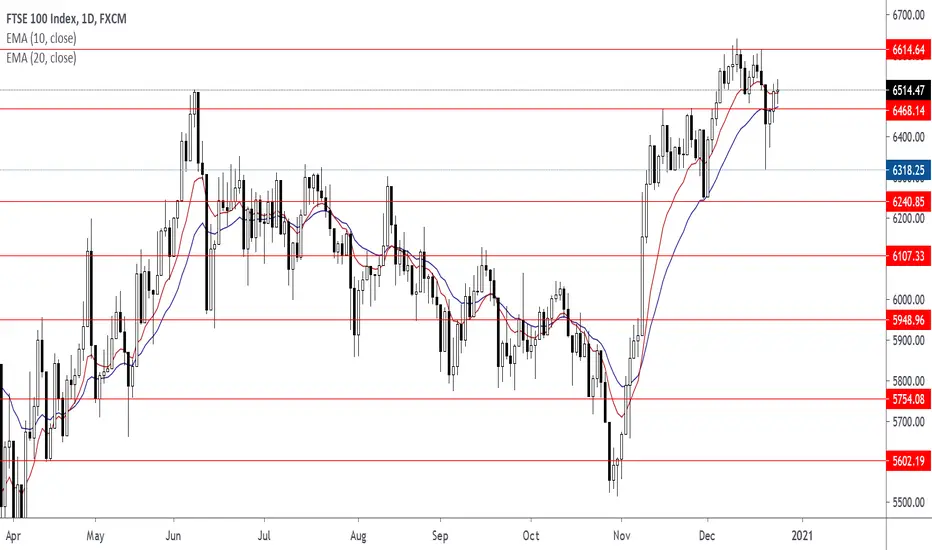
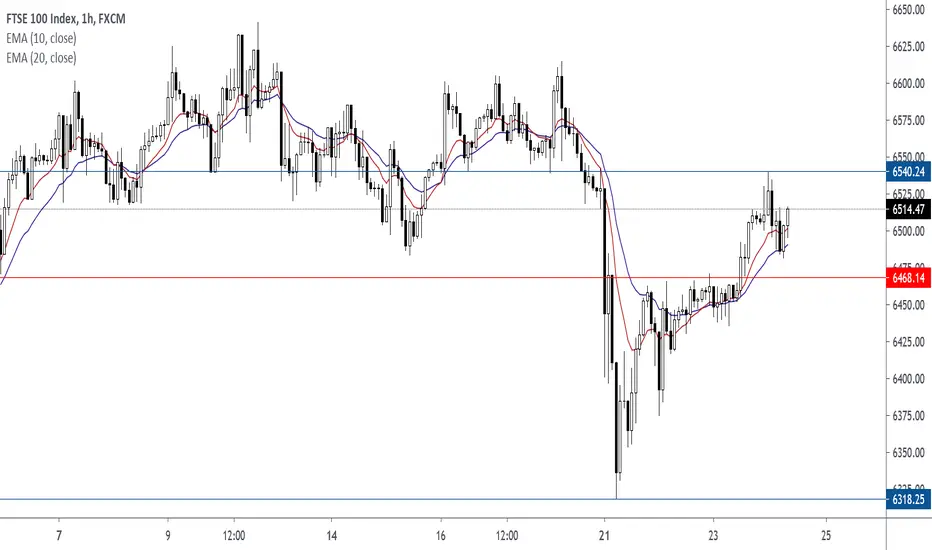
FTSE100 - UKX - WHERE TO NEXT?FTSE100 UKX - Range Bound - WHERE TO NEXT?
Technical View:
Resistance: 6782.5, 6823.0, 6900.5
Support: 6677.7, 6627.6, 6610.9, 6535.8 (200EMA)
Pattern: Multiple formation Bull Flag / Triangle Formation
How to approach this trade idea:
- Add alerts at key break out areas
- Wait for the break out and trade the pull back
- Check the key Fibs matching S&R Areas
- Don't forget to gain a good R/R
- Add limit orders to break out areas, bit more of risky approach as you don't want be part of fake break out!
Go with what you have written on your trade plan overall.
It's FRIDAY....! On a Friday - I take day trades, review my journal and get ready for the week ahead. It hasn't been bad week very choppy markets we are in range bound areas in most assets apart from Crypto's great momentum towards down side I always say in life and in the markets - What goes up, comes down eventually. Now it doesn't mean you're going to become profitable trader and come down - NO! What I mean is, your performance isn't going to be straight line there will be days up and down and let be honest with you - I don't always trade everyday because I know when I want to be part of the market, be disciplined! It does depends on way you mange your portfolio.
Have a great weekend.
Trade Journal
(Just a trade idea, not a recommendation)
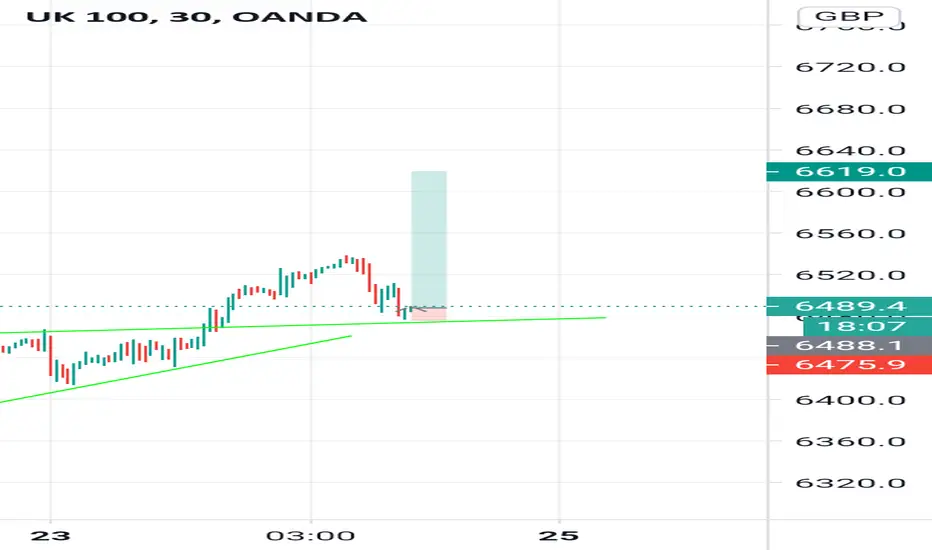
FTSE testing at critical junstionBreak of the uptrend line was strong with a good impulsive candle. Now at critical support near 6600 level. 200SMA is also at support. An impulsive break lower could signal momentum to get us to 6500 target.
Risk-off this morning across the board. Some of it on news as China's surging COVID-19 cases trigger clampdowns.
Good Luck and Stay Healthy!

UK100 (MY SNIPEST ENTRY)UK100 is going to buy because we have a break of structure for potential upside movement, (DAILY STRUCTURE)

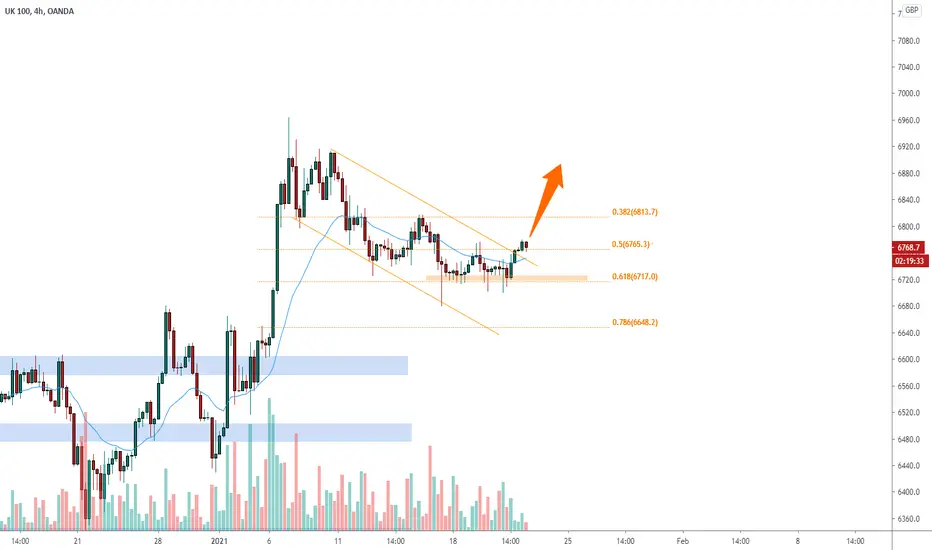
UK100 for new recent highs? 🦐After our last analysis on UK100 index we look for a new opportunity.
The price on the 4h chart retraced inside a channel until the 0.618 where the market found a support.
According to Plancton' s strategy if the conditions will be satisfied, we can set a nice long order.
–––––
Follow the Shrimp 🦐
Keep in mind.
• 🟣 Purple structure -> Monthly structure.
• 🔴 Red structure -> Weekly structure.
• 🔵 Blue structure -> Daily structure.
• 🟡 Yellow structure -> 4h structure.
• ⚫️ Black structure -> >4h structure.
Here is the Plancton0618 technical analysis , please comment below if you have any question.
The ENTRY in the market will be taken only if the condition of the Plancton0618 strategy will trigger.
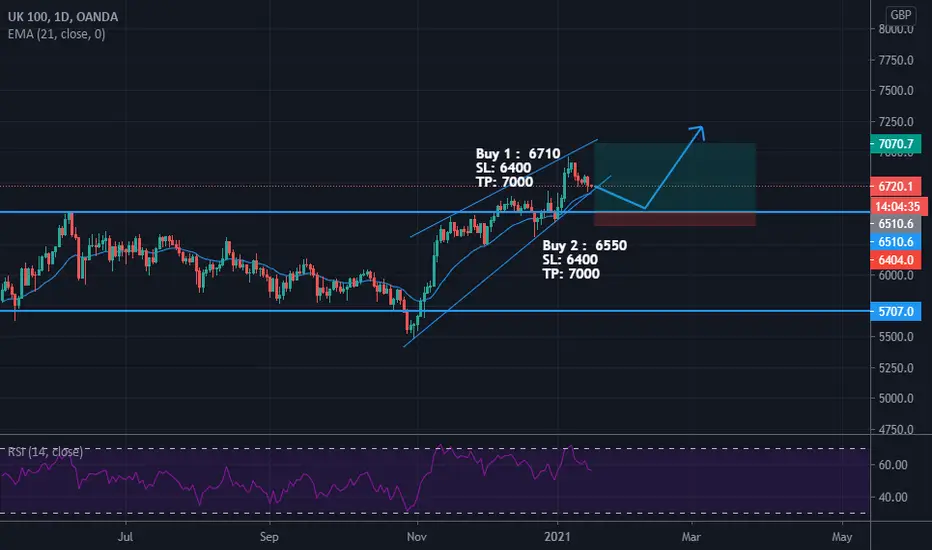
UK100 Stock, Again bought UK100 indexUK stock index is retracing a little after the bit impulsion that we predicted in our previous Analysis. If you are not in open position you can buy One at the CMP and second buy limit will be 6550.
If you like my idea just hit the LIKE button.
FTSE testing important levelA falling channel on a 4-hour timeframe is soon to approach the support zone. A potential retest of the uptrend line and 200SMA make it a strong level.
Can trade the bounce here looking for reverse patterns on a smaller timeframe. A break lower is possible but requires significant selling pressure and some 'more' bad news regarding the pandemic.
Please support the idea and share your thoughts on FTSE!
Good Luck and Stay Healthy!

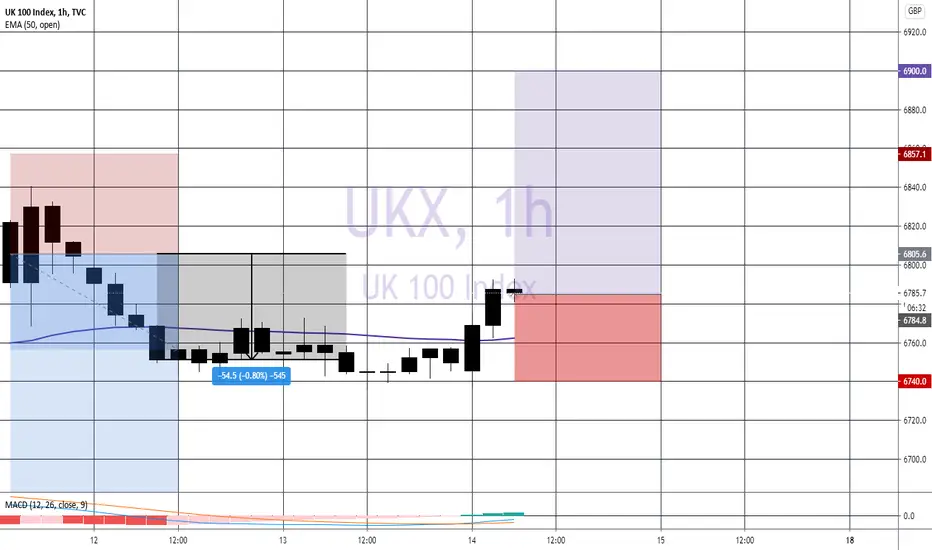
UK100 WXN Trade Idea LongWXN Trade Idea
UK100
Entry: 6780-6785
Stop Loss: 6740
Take Profit: 6900
Risk/Reward : 1:2.53/3 depending on entry
We recommend that you take profit whenever you feel happy.
Strong Support created on H1 and price failed to break down, additionally bullish pressure and price action indicating the upside.
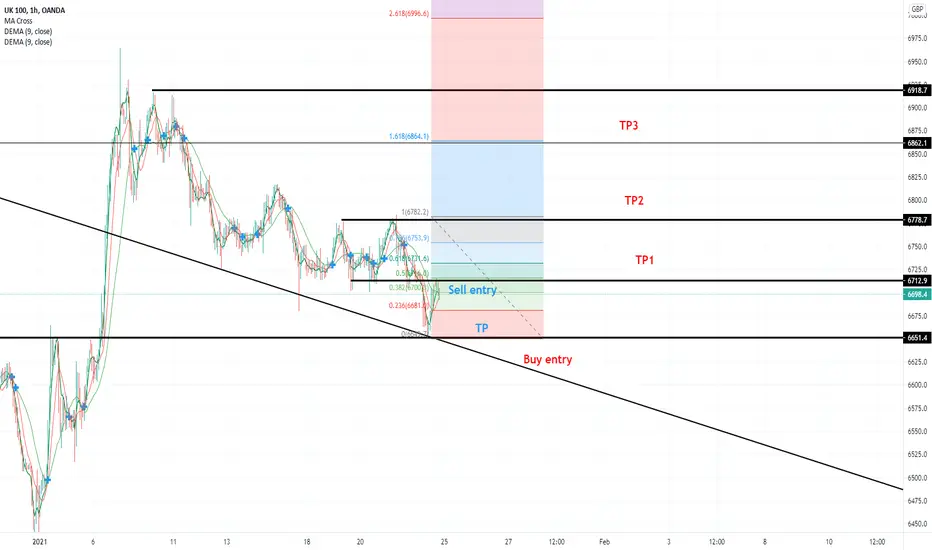
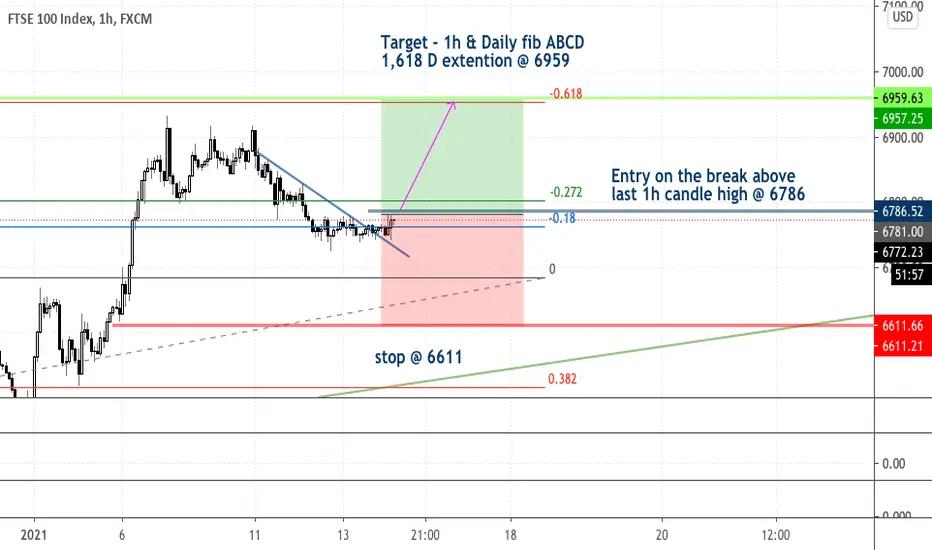
Byuing UK100 for 173 points move higherUK100 is moving up towards Daily fib ABCD 1,618 D extention @6959. This level coincides with 1h up fib ABCD 1,618 D extenion. 1h counter trend line is broken to the upside. For more secure entry I will enter on the break above last 1h candle high.
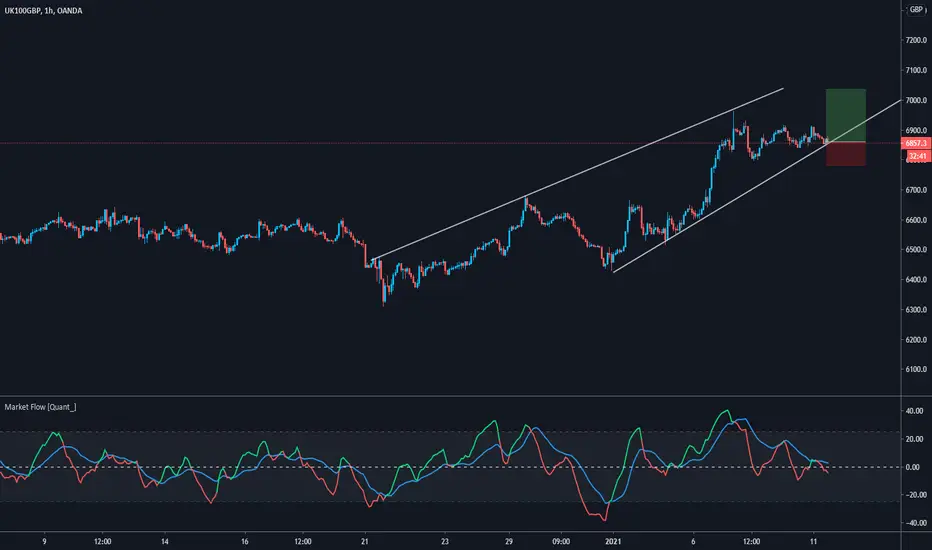
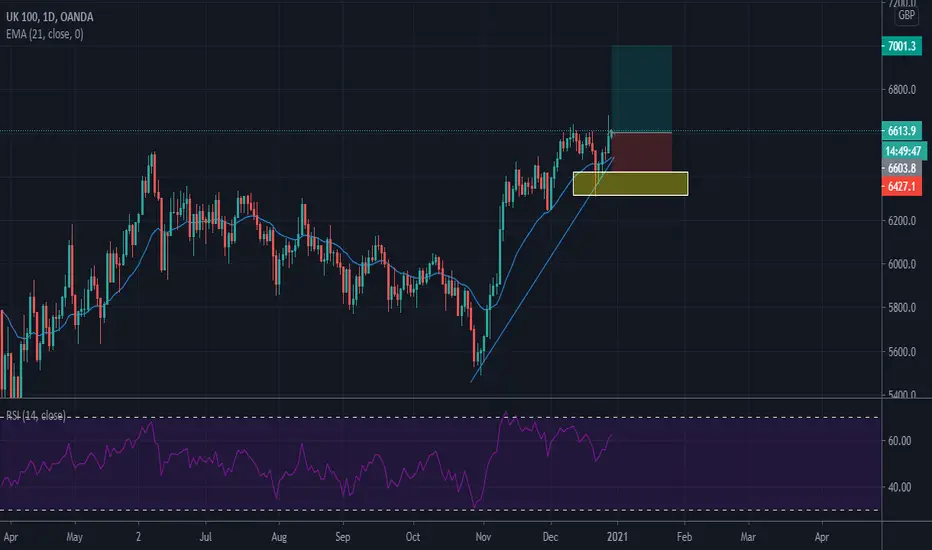
UK100 Ascending Triangle - Long OrderUK100 Ascending Triangle Long Position
Entry: £6,861.3
TP & RR: £7,036.9 (2.21)
Stop Loss: £6,781.8
REASONS FOR THE TRADE
Unfortunately, this is not a trade that I will take since I already have enough positions for the day and my system prohibits me from being overexposed. From a technical point, this seems like a sound trade - testing lower trendline in ana ascending triangle and the Market Flow indicator printing a divergence. My sixth sense tells me, however, that this trendline may not hold... but it's usually wrong, that's why I count on technical indicators. The Stop Loss is far enough for you to evaluate if the price will drop down or will bounce up and start heading towards the target.
I will not count this trade in my journal but I will continue to update it as it goes.
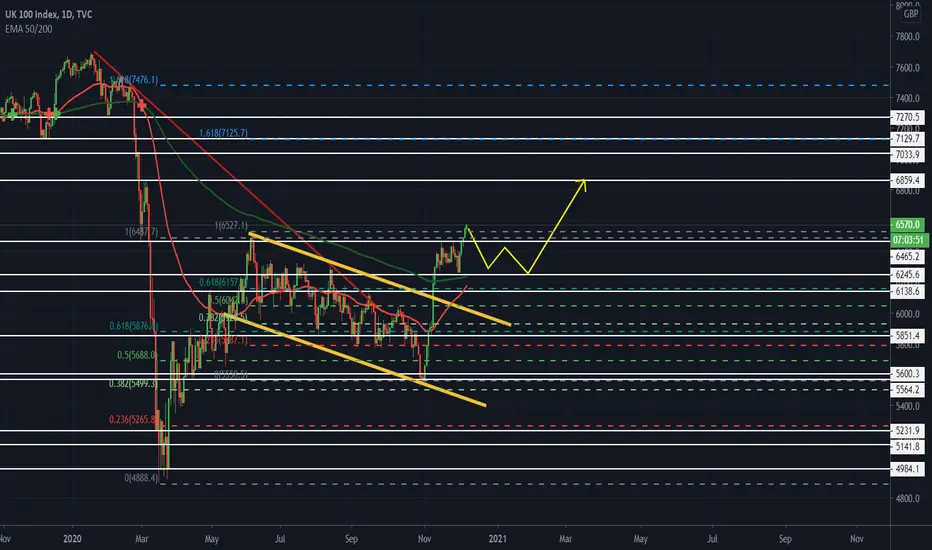
Golden Cross formed early in DecemberThings are looking good for the FTSE 100.
Not only has a Brexit deal been agreed, but 2 vaccines approved for use.
Early in December we saw a golden cross form on the daily chart.
For those who don't know, a golden cros is formed on the 50 and 200 MDA and is a good indicator ( along with the above ) as strong upword trend.
It seems a 7000 recovery is likely
UK100 Stock, Just bought UK100 indexAs UK100 index is looking a good buy position after Brexit Deal between UK and Europe is supporting UK Assets.
If you like this idea, Please give it a thumbs up!
UK100This could be based on the fact that the lockdown could be eased. And the vaccine can be tweaked to tackle the new covid strain.
USD/CAD : PRICE ACTION ON DAILY TIME FRAME 🔔Analysis of #USDCAD
If you have found this useful then help us support my page by hitting the LIKE button.
If you are not subscribed yet then please feel free to follow my page for daily updates and ideas. Thank you
It means a lot to us!
***
Strategy: Daily Price action - We will be waiting for all the confirmations to enter in this trade.
A clear chart is Always the best business card for a trader.
***
Your support and feedback will always welcome
Thank you for your time.
The information contained herein is not intended to be a source of advice or credit analysis
Regards,
Walter

SHORT UK100 SELLI expect pice to retrace a bit before it carries on a uptrend. So i'll be looking for sell opportunities

I am still bullish FTSE! It's a pair I've trading within the indices that I have had great return this yr - great momentum trend towards it and with Brexit drama going on too, it has has great volatility.
Fun fact: When the first lock down occurred earlier this year in UK...A family relative was intrigued about me being a young trader - I had advised a distant family member to watch out for the FTSE it's a great buy at the areas of 5850! Let's hope they did listen to advice and if not - there's always chances in this beautiful market we've had this year! Let's hope to make plenty of pips for the end of this year and start the next year with great optimism within ourselves!
Let's get onto the technicals:
Pattern - Bullish Flag target area: 1.618
Resistance: 6860 & 7035
Support: 6140 & 6040
My target - 6800-7100 Areas!
One of the major investment banks did even announced UK assets are undervalued within options check out Rolls Royce has been a great trade to take as well!
Fundamentals to keep in mind: Brexit and what the indices has a large portion of companies energy based. Although, my target for Crude is 55 area.
All the best,
Trade Journal
Remember: Just a trade idea, not a recommendation
FTSE100 - Full Breakdown + Future Trade OpportunityFirst time breaking down this market, I want to further illustrate what we are seeing in global markets.
I will link related ideas below.
In this video I explain this pattern in official AriasWave terms so you can see how we differ from other forms of analysis.
The move up since the Great Depression is a TYPE-2 ZIG-ZAG and we are seeing Wave v of an ending diagonal since 2009 unfold.
Please LIKE and FOLLOW to get notification of updates and future posts.
