UK100 CFD
Compass Group - Buying the dip to the long term trend line.Buy Compass Group (CPG.L)
Compass Group PLC provides food and support services. The Company's segments include North America, Europe, Rest of World and Central activities. The Europe segment includes Turkey and Russia. The Rest of World segment includes Japan. The Company delivers services in sectors, including business and industry; healthcare and seniors; education; defense, offshore and remote, and sports and leisure.
Market Cap: £31.19Billion
Compass is trading in a fantastic long-term uptrend and this is showing no signs of stopping. The latest correction appears to have found some buying support at the long-term trend line. We expect the shares to rally towards the upper end of the corrective channel before eventually breaking higher towards new highs.
Stop: 1890p
Target 1: 2050p
Target 2: 2145p
Target 3: 2250p
Interested in UK Stocks?
Join our free Telegram channel for up to date analysis on the best main market opportunities in the UK right now - t.me

AstraZeneca - Breaking from a wedgeBuy AstraZeneca (AZN.L)
AstraZeneca PLC (AstraZeneca) is a biopharmaceutical company. The Company focuses on discovery and development of products, which are then manufactured, marketed and sold. The Company focuses on three main therapy areas: Oncology, Cardiovascular & Metabolic Disease (CVMD) and Respiratory, while selectively pursuing therapies in Autoimmunity, Infection and Neuroscience.
Market Cap: £90.48Billion
AstraZeneca is breaking higher from a corrective wedge pattern on the daily chart. The long-term uptrend remains bullish and a move towards new highs is expected.
Stop: 6565p
Target 1: 7465p
Target 2: 7580p
Target 3: 8000p
Interested in UK Stocks?
Join our free Telegram channel for up to date analysis on the best main market opportunities in the UK right now - t.me

RBS - Set to correct lower?Sell RBS (RBS.L)
The Royal Bank of Scotland Group plc (RBS) is a banking and financial services company. The Company provides a range of products and services to personal, commercial, corporate and institutional customers, through its subsidiaries, The Royal Bank of Scotland plc and National Westminster Bank Plc (NatWest), as well as through other brands, including Ulster Bank and Coutts.
Market Cap: £29.13Billion
RBS appears overdone in the very short term. The shares have benefitted significantly form the rally in GBP over recent weeks with a 30%+ rally from the October lows. The shares have rallied into an unfilled gap at 247.4p, which was created on the 26th April 2019. This also corresponds with a 78.6% Fibonacci retracement level from the highs at 266.1p on the 17th April to the lows at 176.6p on 15th August 2019. The looks to be a reasonable level to take some short-term profit or initiate some speculative selling. The bearish looking candle on the daily chart adds further weight to the bearish argument.
Stop: 250.5p
Target 1: 232p
Target 2: 217p
Target 2: 197p
Interested in UK Stocks?
Join our free Telegram channel for up to date analysis on the best main market opportunities in the UK right now - t.me

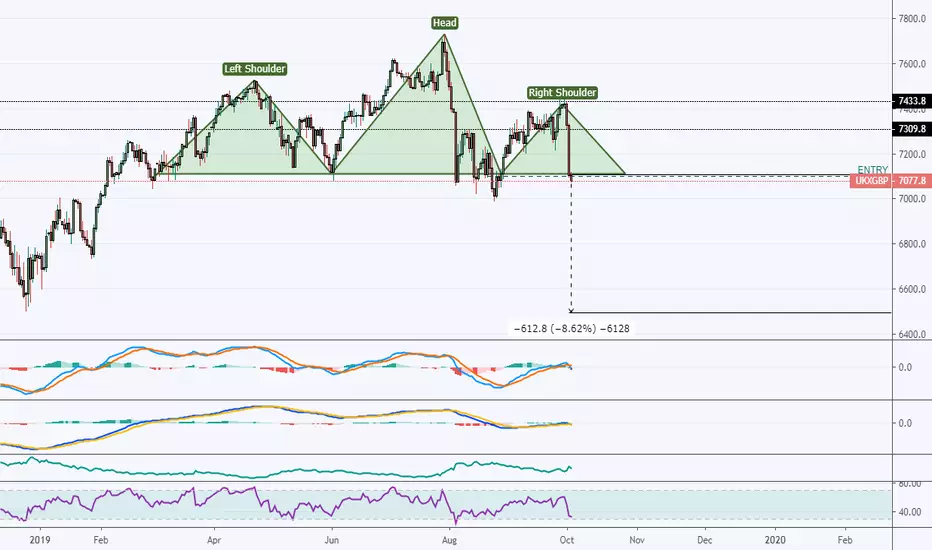
FTSE100 might look like the weakestJust trying out (again) H&S.
UKX is the weakest index at the moment, Brexit and economic contraction pushing it down.
MACDs are ready to go down again.
Let's see :)
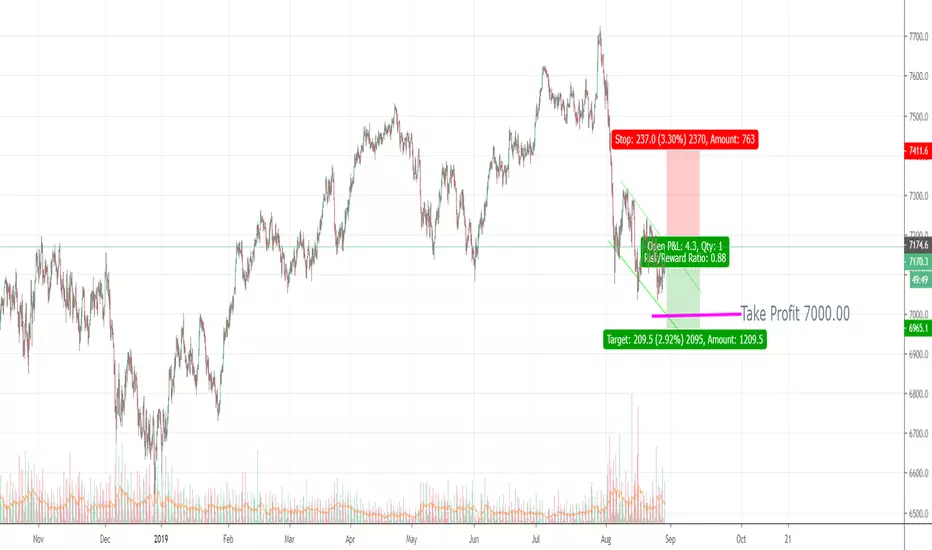
UK 100 long 7114.41stop @ 6970 should it moves against me I will take a 2nd position @ 7062.62 and the target is TBD
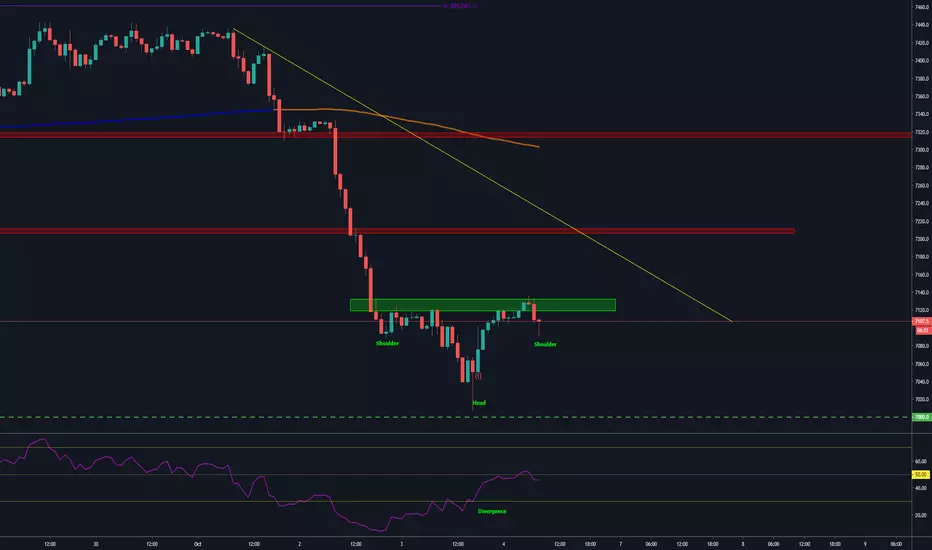
FTSE inverse head and shouldersDivergence on indicators, potential to trade the break of the neckline.
Today could the day of retracement after one of the worst sell offs we had in months.
Good Luck!
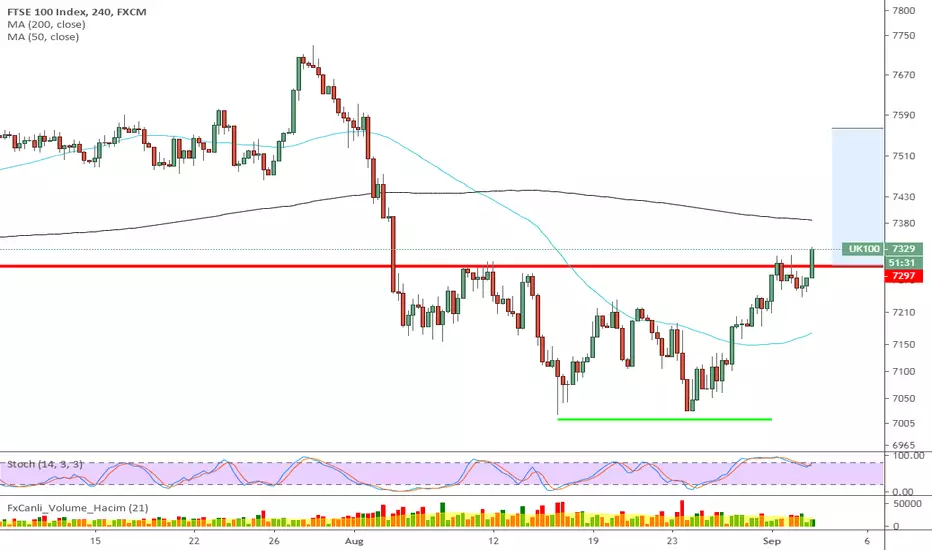
FTSE updateWith US manufacturing data yesterday triggering recession fears, FTSE dropped along with other indices. Looks lkie wave i of wave C started. Now at 200SMA on 4 chart.
Once support is found, we could close shorts and buy the pullback on wave ii.
Good Luck!

FTSE 100 Short Trade *4hr TREND CONTINUATION*Bearish bias on FTSE100 index.
Previous 4hr support zone broken and retested.
Bullish Trendline broken and now retested.
Fib 0,618 and lower high forming.
4hr 50ema to act as dynamic resistance.
Entry 7310.00
Final TP around the 7100 level

FTSE - Limited upsideTrade Idea
Prices are extending higher from the bullish flag/pennant formation.
We have a 61.8% Fibonacci pullback level of 7458 from 7020 to 7729.
Bespoke resistance is located at 7461.
Although the bulls are in control, the stalling positive momentum indicates a possible turnaround is possible.
Preferred trade is to sell into rallies.
Expect trading to remain mixed and volatile.
We look to Sell at 7460
Stop: 7495
Target 1: 7375
Target 2: 7300

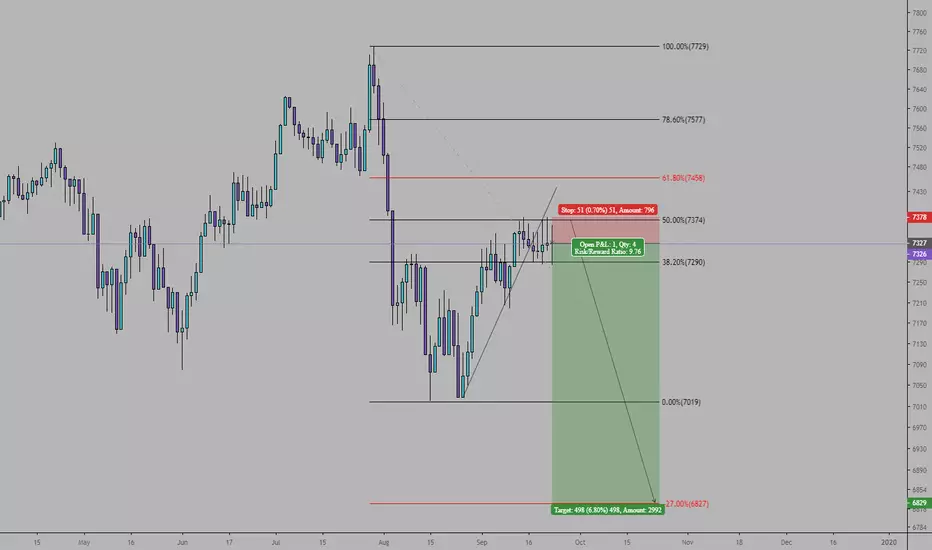
Lets try something new...UK100 Short trade setupNormally I only trade Forex pairs and it has been a while since I last traded any indexes. But I was strolling through markets and saw this opportunity so I analyzed quick and opened a short trade @7216.
My quick analysis
The Market has reversed at the end of July and stayed in a Down Trend ever since. Now we can clearly see Resistance @7305 so that gives us a nice opportunity to go short and aim for a Lower Low. In this setup I used the Fibonacci Retracement tool to look for a TP level and found one @6992 (fib 0.618). The Market is already down -0.47% while writing this text so I don't know if there will be a good window of opportunity for long. My StopLoss is set @7336 I don't know what to expect of the duration for this trade but I have patience and confidence.
Lets wait and see what happens!

UK100 - LONG 4HR Uk100 - Wait for the 4HR candle close to confirm the break.
Target - Full target 7560
- MANAGE YOUR RISK -
Disclaimer: All ideas are m FX:UK100 y opinion and should not be taken as financial advice.
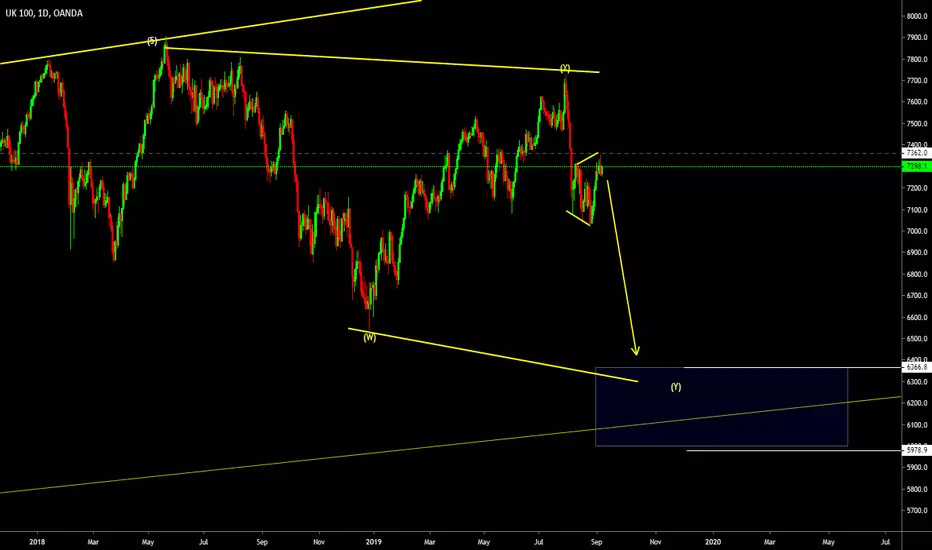
UK100 Look For The Down MoveHello traders,
We had a strong down move in the beginning of August which we have been correcting thus far and now I am looking for that continuation down to the 6700 / 6600 range.
I will re-evaluate the action in the coming weeks to assess whether or not I think this will be the complete reversal and probably the inevitable recession or back up to break and make new highs (which I think will be the case by the way).
Check out some of my other ideas posted under 'related ideas' down below.
If you would like me to forecast a specific pair that I have not covered, feel free to comment it down below.
Don’t forget to like & follow. I will be posting forecasts & trade setups on a regular basis!
Thank you,
Good luck

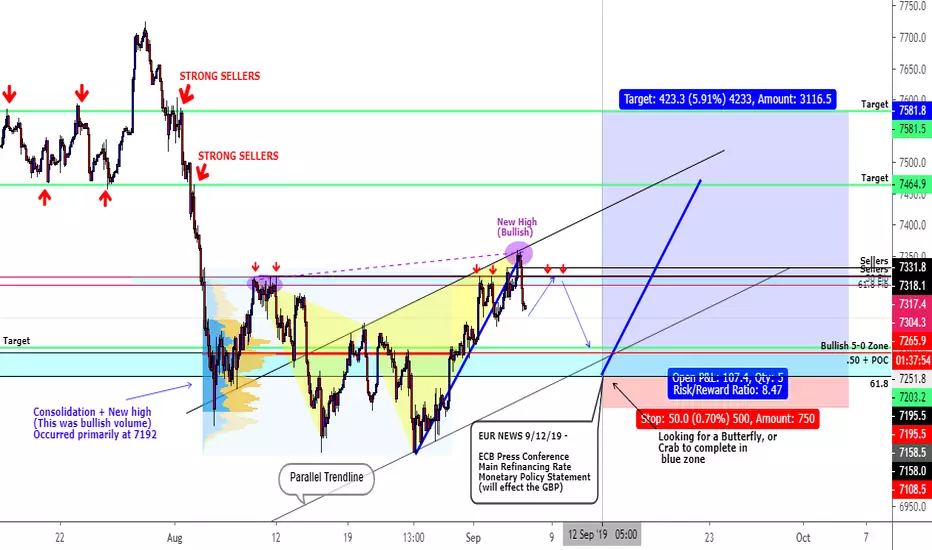
UK100GBP - Possible 10:1 Return Depending On Your EntryIt all starts with price action. After a loss of downside momentum we have made a new high (purple) which indicates some bullish strength.
It has also completed a shark pattern at the 1.13 which is great, this shows a new high has been made, but we could be due for the pullback now, before a new high is made.
I will be looking for this bearish shark to become a Bullish 5-0 on it's retest of old support (the bottom light blue zone is 5-0 buy zone)
Another thing I like to see is if there is VOLUME at the price I'm looking to buy, which there is. We want to buy WITH the smart money, and they have been buying at the spot recently as well.
I have also drawn the potential channel we could be in using a method I teach with three drives patterns.
The dark blue line is an ABCD projection for where the possible New high could be. It is also a bearish 61.8 and Strong spot where sellers are sitting.
My stop will depend on my entry signal, I'm looking for a butterfly or crab to complete in the blue zone, this could make a big difference. But 50 pips will be my maximum! I'm really looking to use a 25 pip stop. I typically go in a scalp these moves and hold them for the long term.
I believe we are due for the dip/pullback because we just knocked out our previous swing low on the 1HR, momentum has shift to the downside on the 1HR.
Also, keep in mind we have MAJOR MAJOR news for the EU dropping right around the time of this buy idea, which could be the catalyst we need to push price up.
We are a long ways away from buy though, we need to see how price structure looks if it comes back down, things can change
Enjoy
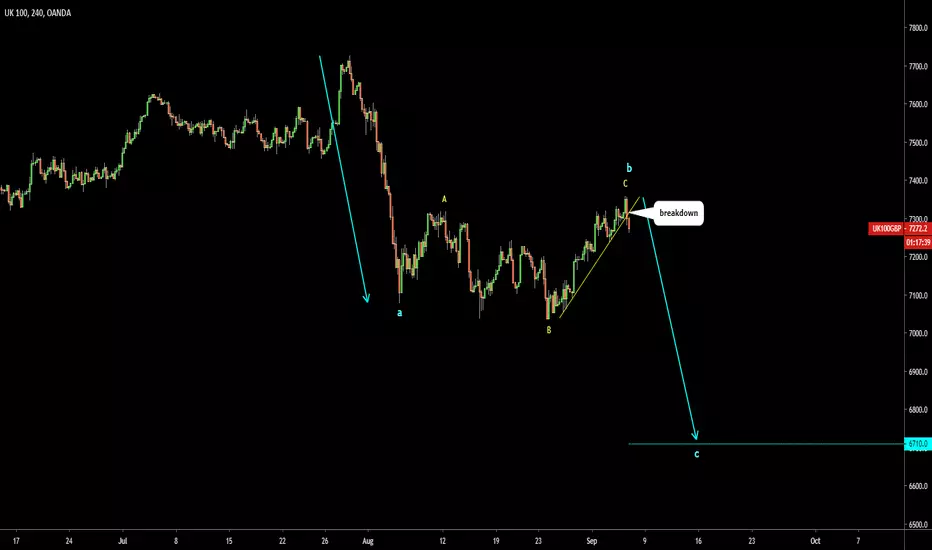
UK100 (FTSE 100) is in a second leg of a correction to hit 6710 The UK100 could have finished the flat correction and now it is heading south.
The wave C blue could drop to the 6710 where C=A.
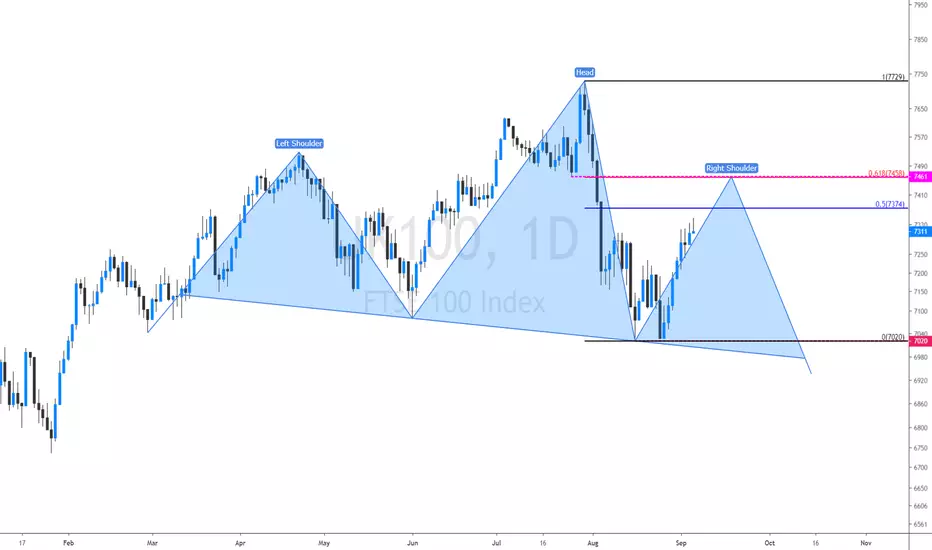
FTSE - Forming a right shoulder?Trade Idea
Trading has been mixed and volatile.
The sequence for trading is lower lows and highs.
We have a 50% Fibonacci pullback level of 7374 from 7729 to 7020.
Negative overnight flows lead to an expectation of a weaker open this morning.
Further downside is expected although we prefer to set shorts at our bespoke resistance levels at 7375, resulting in improved risk/reward.
Expect trading to remain mixed and volatile.
We look to Sell at 7375
Stop: 7425
Target 1: 7235
Target 2: 7170
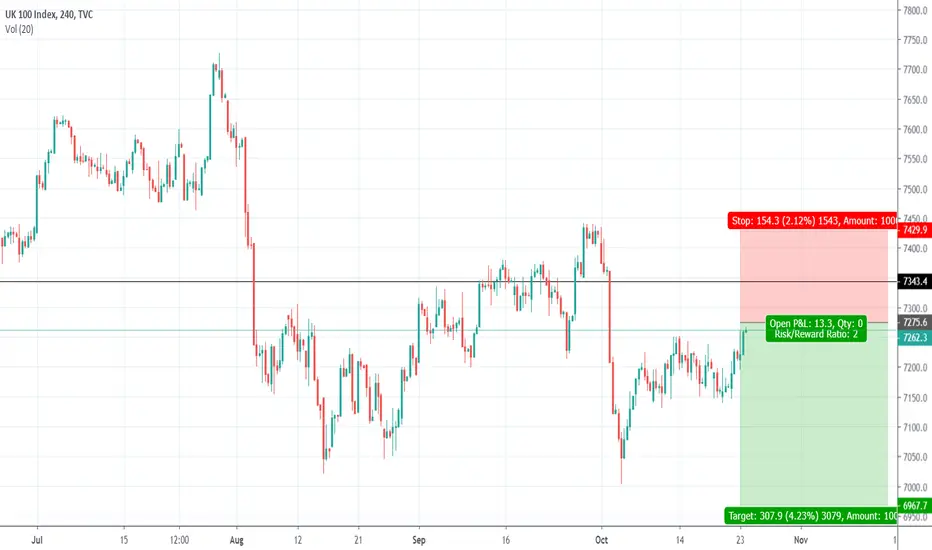
FTSE updateResistance zone worked to add another long on the break or pullback, whichever you chose. Now we see rapid rise in FTSE this morning, additional long position can be taken if we wait for the pullback. Good Luck!
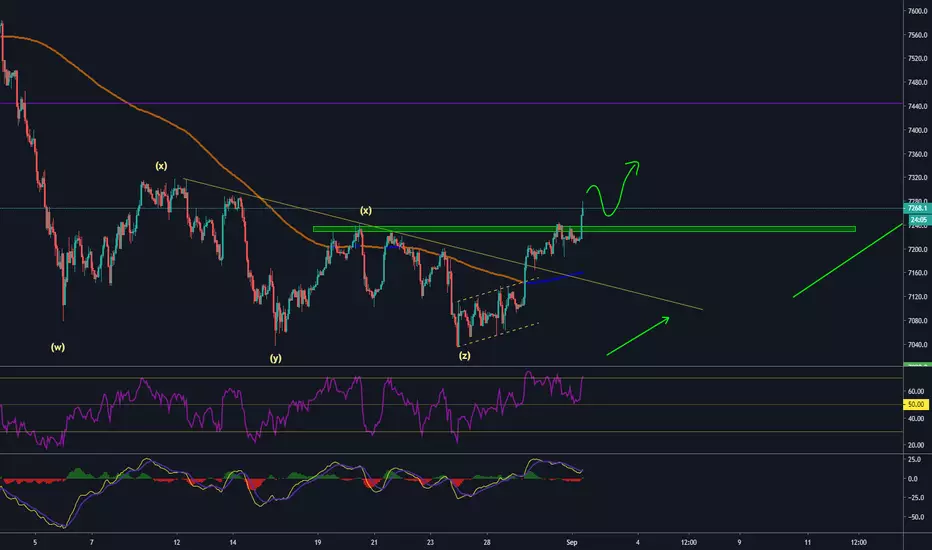
FTSE updateThe break happened by the book and going well. Now at small resistance zone, a pullback here would be welcome as we could add another long at the low of the pullback. Going to small time frames to see catch that low. This is the start of the B wave.
End of summer today so many traders and investors will be closing trades. Expected high volatility at the end of London session and New York session.
Good Luck!
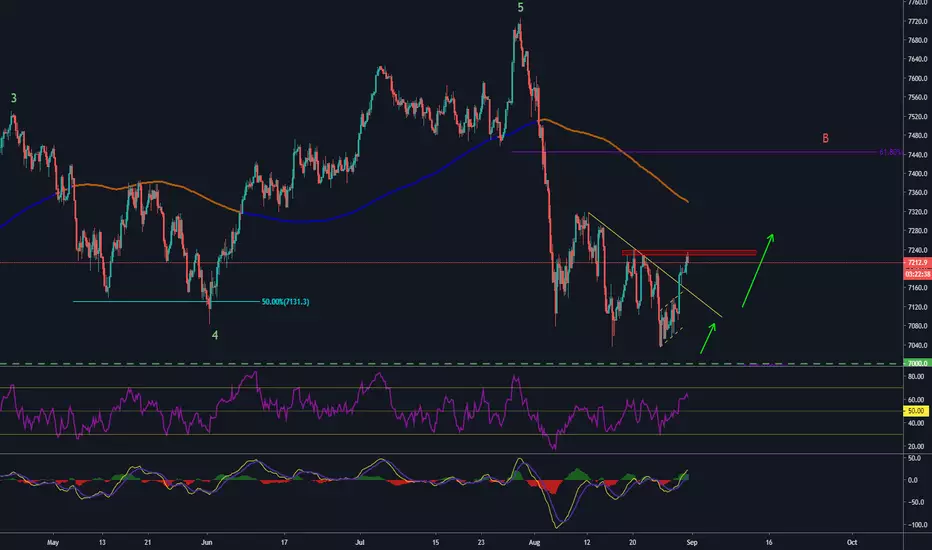
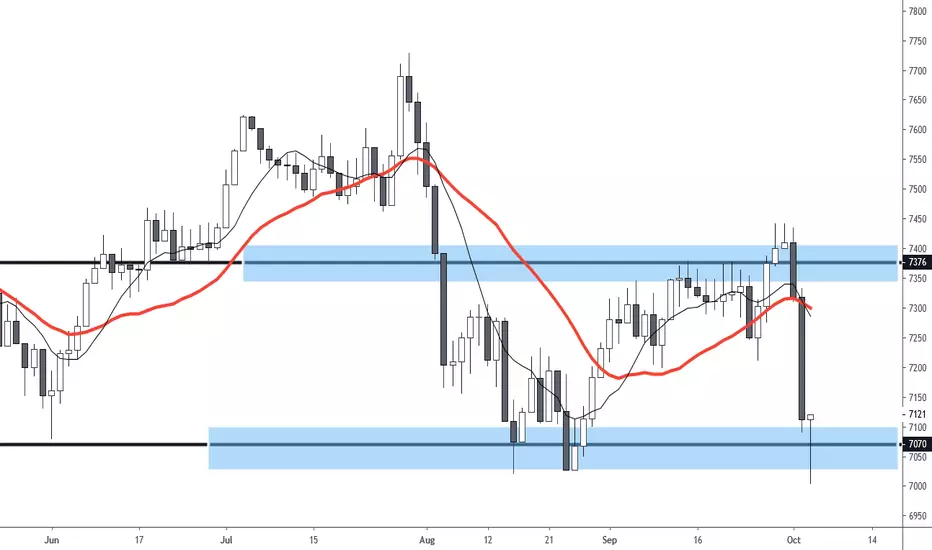
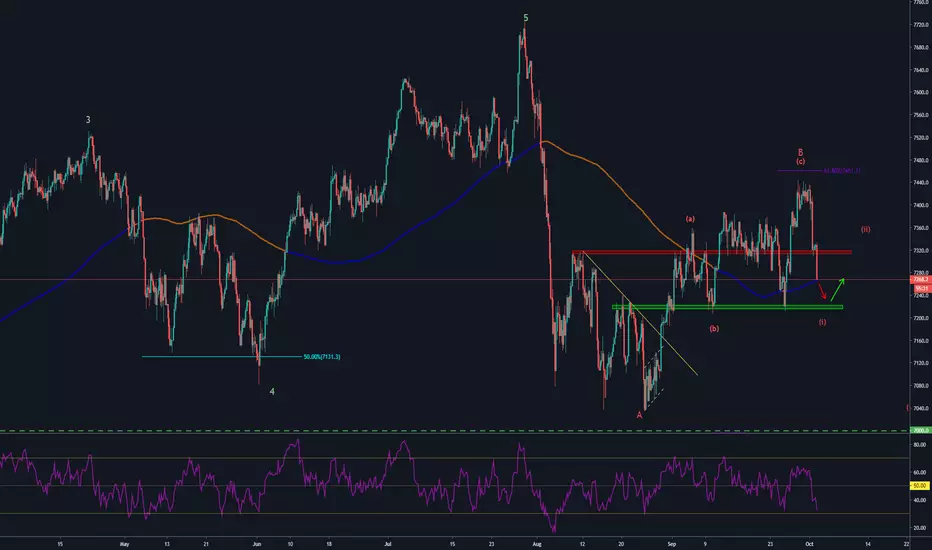
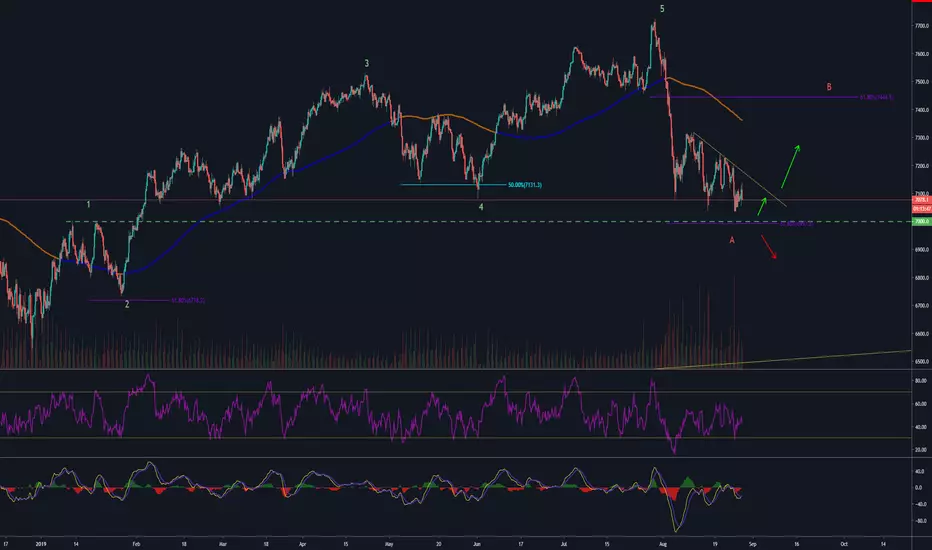
FTSE updateWave analysis shows that we could be nearing the end of wave A. Very good support of 61.8% at the key 7000 level. Great opportunity for a long there as GBP sells off on the potential of Parliament being suspended in September-October.
Boris trying to get the government out of the way so that they can not interfere with his Brexit plans.
Also a downtrend line from August 12, respected and confirmed. If it break we could see it going into wave B from there to retest broken level around 7400.
Indicators going back close to oversold, adding more probability for a potential bounce.
Good Luck!
UK 100 SHORT down to 7000My idea on a short on the UK 100. Following recent news the UK economy will have a bleak outlook and will drop down near the major resistance of 6990.