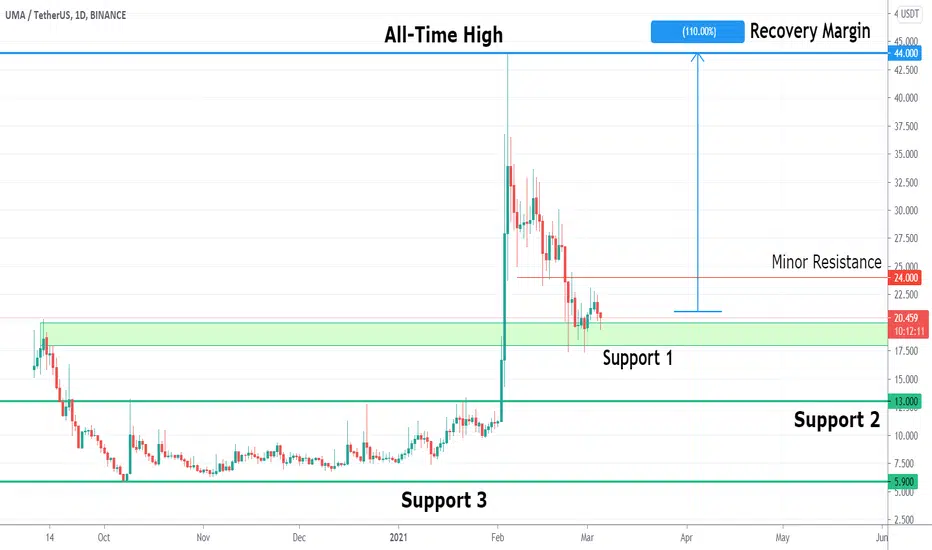
How Profitable Is UMA's Recovery?After reaching the important support level between $18-$20, UMA started rebounding. Let’s see how much potential profit UMA could bring us if we bought in now!
Backstory: UMA’s previous strong growth was mainly due to an announcement regarding the arrival of the uSTONKS synthetic token. uSTONKS tracks an index consisting of ten stocks that are most commented on r/wallstreetbets. Wallstreetbets is a Reddit that gained popularity after pumping certain stocks (such as GME and AMC), making hedge funds lose billions of dollars in a short squeeze.
Recovery and Potential Profit
When the hype regarding uSTONKS started to die down, UMA’s price began descending. The price eventually reached $17, or 60% lower than the all-time high. Since then, the token has consolidated for a while, and now it looks like it is trying to start a new uptrend.
If UMA were to recover to its all-time high, it would mean a 110% increase in price, which would essentially more than double your funds if you were to invest now. A minor resistance on its way to a full recovery is the $24 price point. Breaking above $24 significantly would probably mean that UMA is attempting to reach its all-time high again.
Uncorrelated: One excellent aspect about UMA is that it is not as influenced by Bitcoin as the rest of the market. For example, when Bitcoin was trending strongly in October and November 2020, UMA wasn’t moving much. The token made its most substantial moves when it had positive news.
Disclaimer: We do not give trading recommendations; we only break down potential trades. Always do your own research before entering any position.
UMA
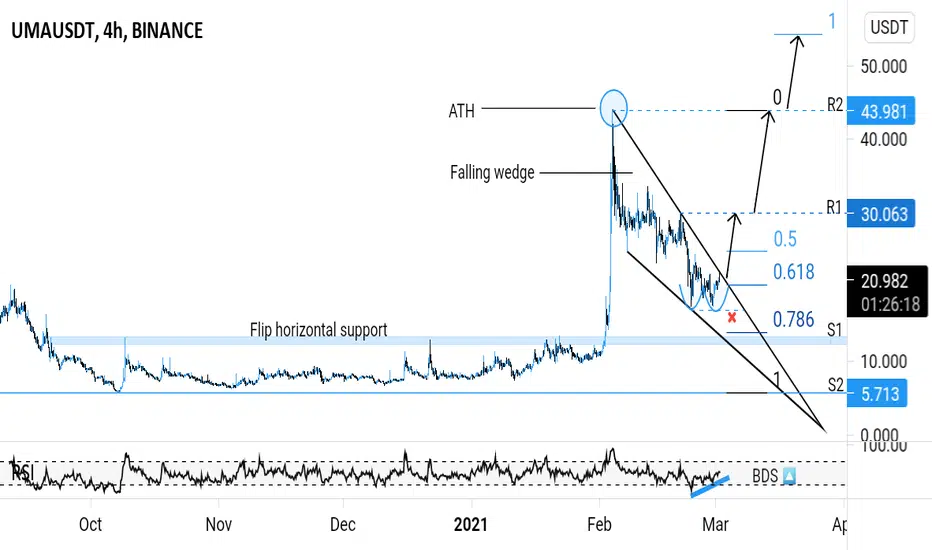
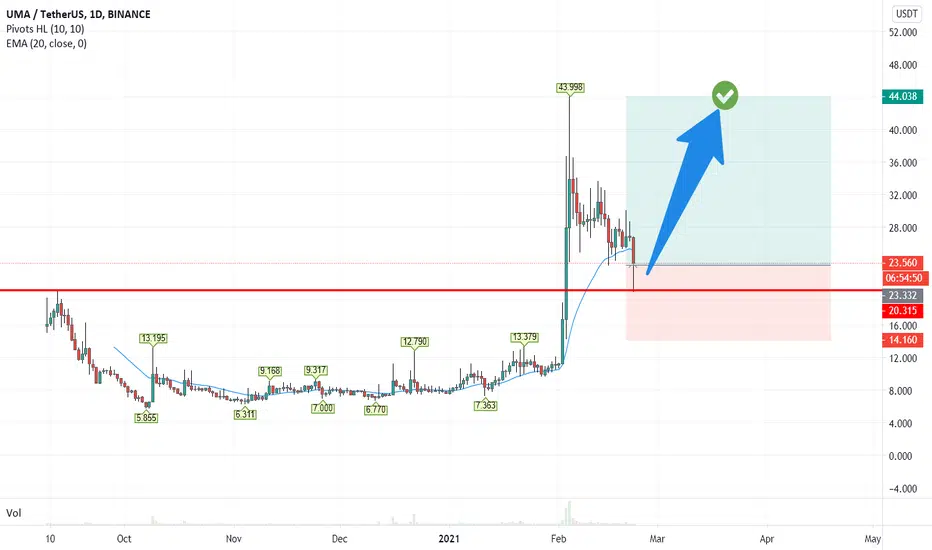
UMAUSDT (UMA) - POTENTIAL BUY ENTRY ANALYSIS 🔎
- UMAUSDT brokeout above the horizontal resistance level and hit an ATH
- Price then retraced for a retest of the flip horizontal support and 0.618 fibonacci retracement level.
- RSI is printing a bullish divergence signal (BDS 🔼).
- The retracement is bounded in the falling wedge pattern.
- A falling wedge pattern is a bullish reversal pattern.
- A breakout above the falling wedge's resistance could be an uptrend continuation signal.
- Price action is printing a double bottom pattern at the retest area.
- A double bottom pattern is a bullish reversal pattern.
- There's a breakout potential.
BUY ENTRY ⬆️
- Breakout above the falling wedge's resistance.
TARGETS 🎯
- Horizontal resistance level (R1).
- Horizontal resistance level (R2).
- Fibonacci extension levels.
SETUP INVALIDATION ❌
-Breakdown below the double bottom horizontal support level.
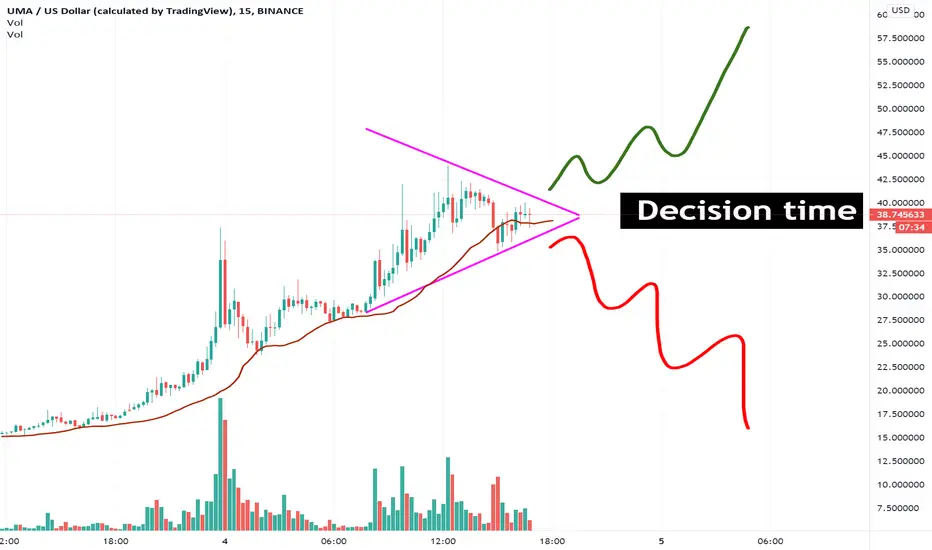
UMA - Decision Time is upon us! 67%+ Gains Potential! Hello Traders,
Here is one of the more unique projects the cryptosphere has to offer.
#1. This is great bc there isn’t a lot of competition in the direction this company is taking. But as a lot of bigger people in the crypto market like to say, this could be a bad thing bc competition is what allows a company to get more creative and to speed up what they offer. Though, I still believe this company is just budding and we will see big things from it in the future.
#2. Circulating supply is very low, with only 56 Mil coins currently circulating. Max supply is just over 100 mil. Which will allow for a higher demand once this coin finds it’s footing.
#3. Like stock derivatives, but with a crypto/defi twist — UMA is focused on building “priceless” derivatives on Ethereum. The space has been quoted to be worth between 500 Trillion and 1 Quadrillion $$$. While this is all speculation until it starts to take hold, I do believe it’s something to dive deeper into to get a better understanding of. You can read more about what they do here: docs.umaproject.org
Technically speaking, I’m seeing a 3-dive pattern forming in the downward channel. Depending, if we can find a support, which we hold, then we should see a strong move up. But to be honest, this is one we want to hold and hold for the long term to realize the true potential this amazing market will be able to offer.
Good luck!
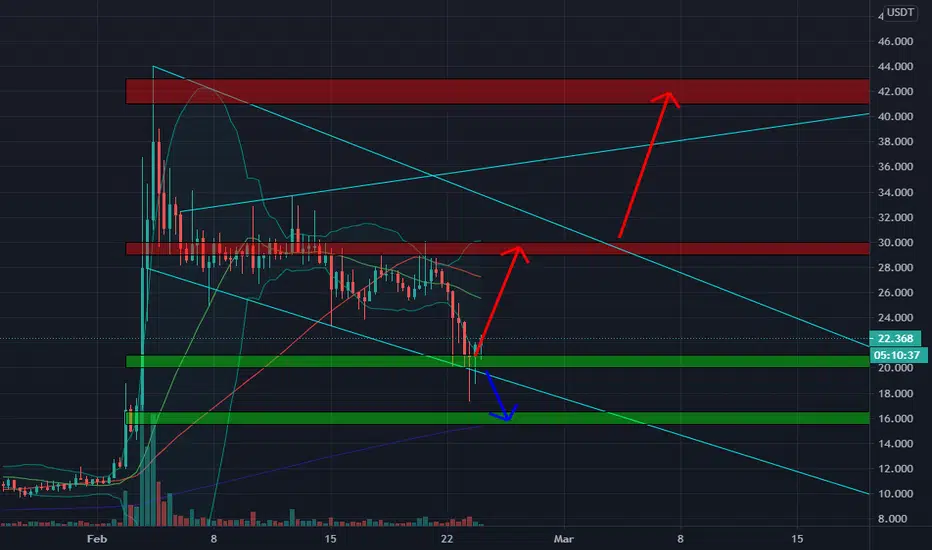
🆓UMA/USDT Analysis (24/2) #UMA $UMAThere is good buying force at 20$ zone and now it is heading to 30$ zone, this zone is very strong so I think it will take us some days to break through this zone to move up to re-test the ATH at 42$ zone
📈BUY
-Buy: 20-21$. SL if B
-Buy: 29-30$ if A. SL if B
📉SELL
-Sell: 29-30$. SL if A
-Sell: 41-43$. SL if A
♻️BACK-UP
-Sell: 20-21$ if B. SL if A
-Buy: 15.5-16.5$. SL if B
❓Details
Condition A : "If 8H candle closes ABOVE this zone"
Condition B : "If 8H candle closes BELOW this zone"
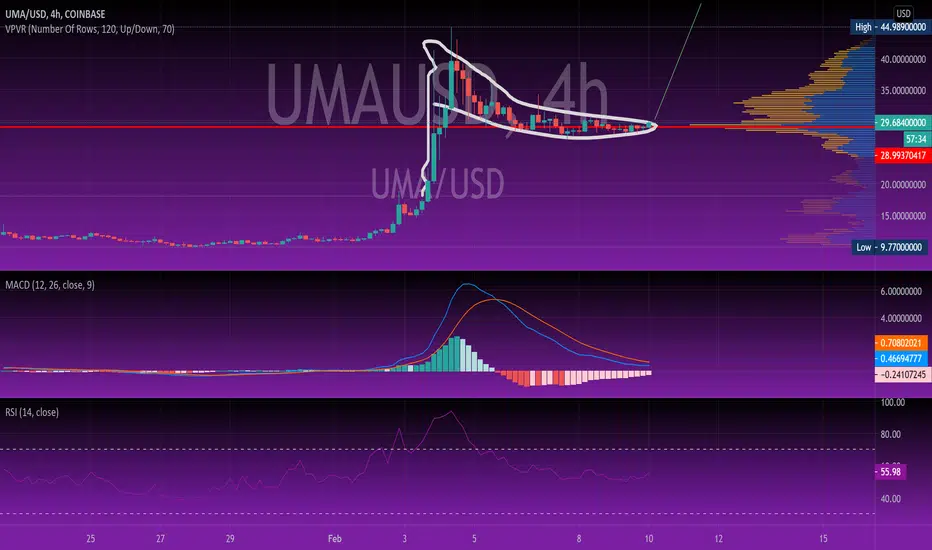
UMA/USD 4h Possible Cup and Handle by the End of MarchPlaying around with the price predictions I've came over the potential for a huge Cup and Handle pattern for the Unified Market Access USD pair.
Of course this is just one of possible scenarios and yeah, it's a positive one. Let's watch what will happen soon.
Meanwhile I'm using the market dip to perform dollar cost averaging for the UMAUSD pair.
This is not an investment advice as I'm not a financial advisor.
Make your investment decisions at your own risk and perform your own researches.
And REMEMBER: Likes and comments make your trades much more successful :)

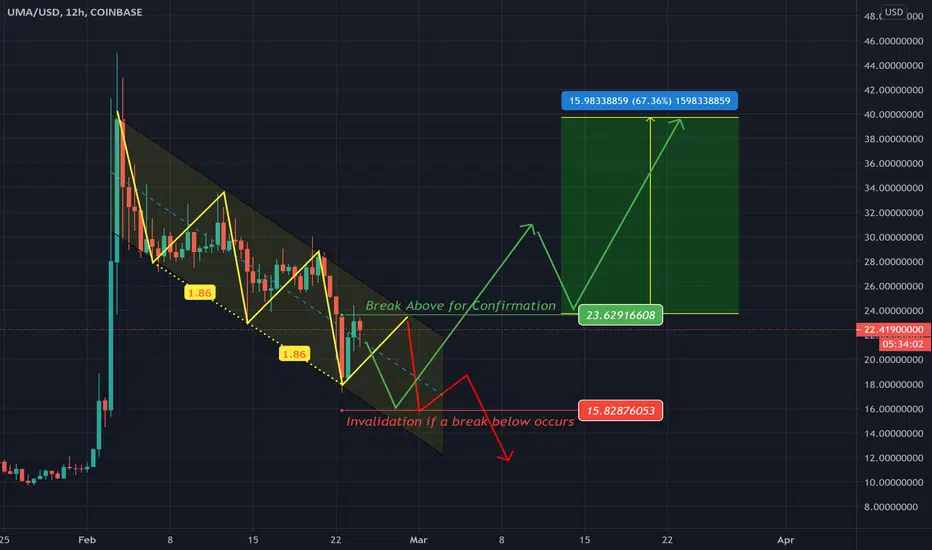
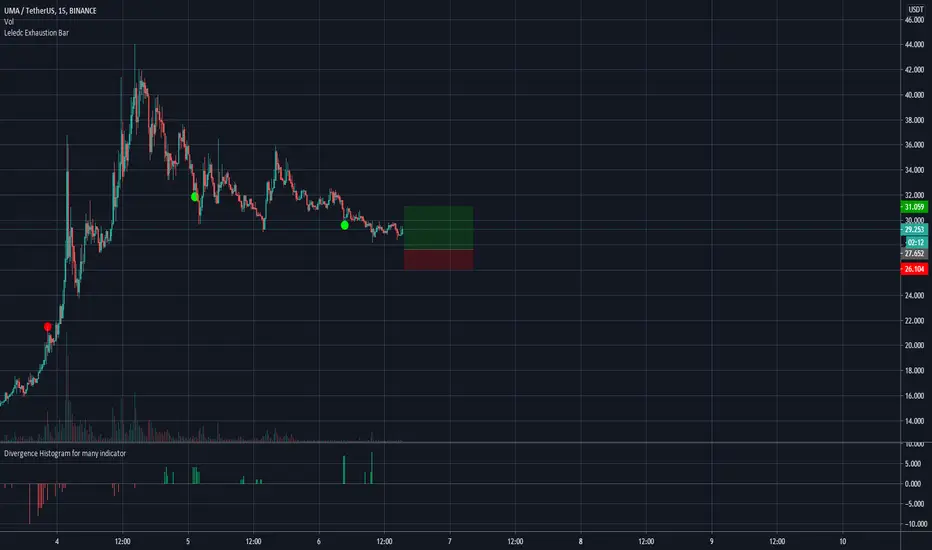
UMA probably one more move down before breakoutIt looks like we are going down short term before UMA breaks out the bullish flag.
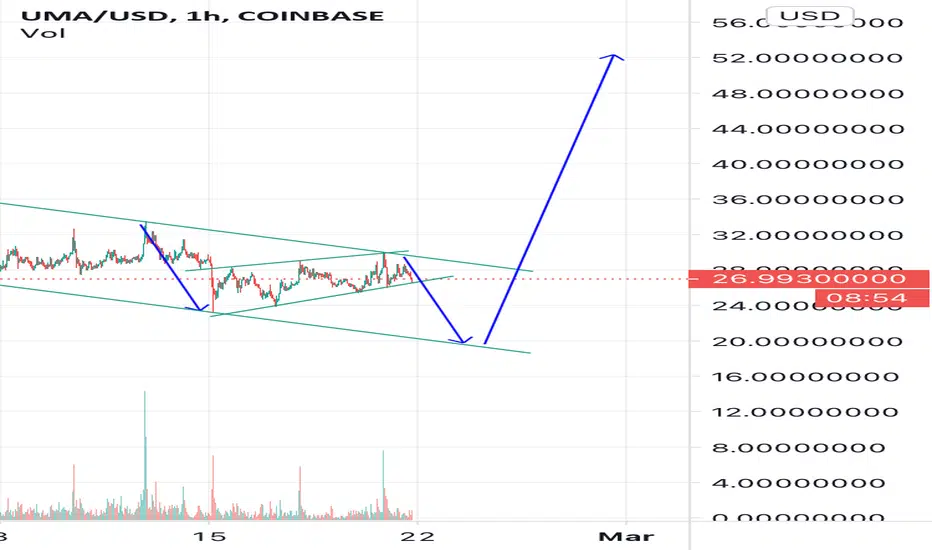
UMAUSDT (UMA) - POTENTIAL BUY ENTRY ANALYSIS 🔎
- UMAUSDT is printing a falling wedge pattern.
- This is reversal pattern.
- A bullish pattern to be precise.
- Price action is printing the double bottom pattern.
- This is also a bullish reversal pattern.
- RSI is printing a bullish divergence signal.
- Price is testing the falling wedge's resistance and double bottom neckline resistance.
- There's a breakout potential.
BUY ENTRY ⬆️
- Breakout above the falling wedge's resistance and the double bottom neckline resistance.
TARGETS 🎯
- Horizontal resistance level (R1).
- Horizontal resistance level (R2).
SETUP INVALIDATION ❌
- Breakdown below the double bottom horizontal support level (S1).

UMA - long opportunity UMA looks like it will approach resistance - initial trade.
Expecting break and short term rally.
Best, HF


UMA High and Tight Flag Pattern - Potential 300% GainsUMA has the set up for a high and tight flag pattern but has not confirmed breakout yet.
If breakout does occur above the top of the flag pole there is potential for a 300% increase in price.
One worth watching.

UMA update: Consolidating in range, potential to break downUMA continues to consolidate in this range in very low volume. It could range like this for several days.
NOTE: the overall altcoin market condition right now (Sunday, 2.14.21) is in CORRECTION. Very few alts are pumping today. We just had a major week of huge altcoin pumps, this correction is normal and expected, but there's no telling if it will continue to sell off into monday and onwards, of there will be a strong bounce back soon.
Best course of action: follow your coins on your watchlist carefully, and look for good entry conditions.
UMA right now looks good consolidating in a very low volume range. But the price swings can be huge. See that there is a potential 20%+ drop to lower support, so if you enter now, be prepared for 20% drops. It's possible to set buy bids in the 24.9 area which is the lowest support zone in this range.
I would not enter UMA now unless you have a very long fundamental bullish opinion.

UMA LONG, pumping out of support into right side of baseUMA potentially entering a pump out of the support area, with a 40% runway to previous ATH. First profit target is previous high of 44.12.
Potential profit taking targets of 20% on the way to 40%. Resistance expected at ATH. Potential add on if confident to add after breakout from ATH
Crypto 2021 Strategy notes:
I enter trades in 5 and 10% positions (of total trading portolio). If possible I look to add to succesful positions to a max of 25% total of portfolio.
For this cryptocurrency 2021 bull market, my profit taking targets are around 40-50%, in quarters, thirds or sometimes halfs. I look for 80-100% gains for further profit taking.
Depending on the coin and cycle of its pumps, I hold some of my position through 100-200-300% returns on the lucky ones, taking profits on the way up. ($LUNA, $ADA)

DeFi crypto markets and why you should invest in themThese charts show an indication why you should invest in DeFi crypto currencies. Here we have 5 different DeFi coins and as you can see they all are following a similar pattern, that being AAVE. The charts are all 1day log charts.
We investigate further into each coin below, starting with the main pattern, AAVE.
AAVE - Came onto market and like most of these coins decreased in price. It was at around $50 and dropped to around $0.34cents before a huge pump up to to $350 USD.
If you look at the EMA's and MA's on the chart you can compare them to the other charts to see they are very similar in how the market reacted. Once the candle crossed above the MA 144 (white line) shown where the white down arrow is it went on a nice move upwards.
BAND - Has crossed the indicator mentioned above as shown where the white down arrow is. Target is the yellow horizontal line.
YFii - As you can see on this chart it has not crossed the MA 144 (white line) where the purple down arrow is. Good time to get in as it looks like it is squeezing between all the MA and EMA's and a nice build up on the LMACD on it's way to 0 and above. Target is the yellow horizontal line.
UMA - Has crossed the indicator mentioned above as shown where the white down arrow is.
CRV - Has crossed the indicator mentioned above as shown where the white down arrow is. Target is the yellow horizontal line.
Happy trading legends!
HTBB
Take a look at my other charts and analysis below to see my unbelievable correct analysis record. If this kind of analysis interests you and you want more than just 1 or 2 correct chart analyses every month or so, check out my website and become a member.


Cryptos on my bullish Trade List UMASharing my Cryptos/Coins that are currently bullish and in my view the best ones to buy now for great profits
This is my first One
UMA
Clear 5 waves up, and the price is currently in a correction.
And if UMA investors wake up again, we could easily see UMA price to 56
I am keeping this one in my portfolio

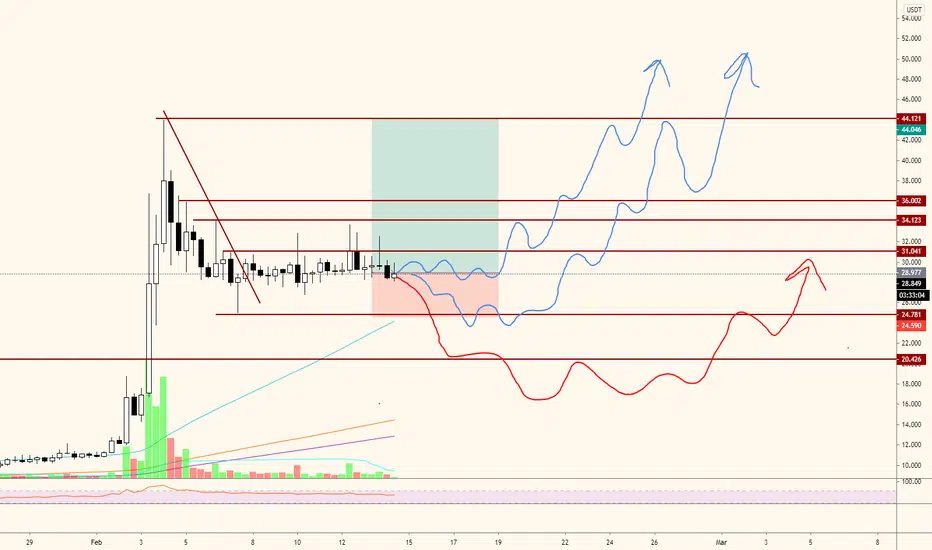
UMAUSDT (UMA) - POTENTIAL BUY ENTRY ANALYSIS 🔎
- UMAUSDT was printing a falling wedge pattern.
- This is a bullish reversal pattern.
- Price brokeout above the falling wedge's resistance.
- Price retraced and tested the 0.618 fibonacci retracement level.
- Price action is currently printing an ascending triangle pattern.
- This is a bullish build up pattern.
- There's a breakout potential.
BUY ENTRY ⬆️
- Aggressive (risky): current market price (now).
- Conservative: breakout above the ascending triangle's horizontal resistance.
TARGETS 🎯
- Horizontal resistance level (R1).
- Horizontal resistance level (R2).
SETUP INVALIDATION ❌
- Breakdown below the ascending triangle's inclined support.

Bullish Flag. Can UMA- USD reach $ 48?Hi Everyone,
A bull flag pattern is a chart pattern that occurs when a stock is in a strong uptrend. It is called a flag pattern because when you see it on a chart it looks like a flag on a pole and since we are in an uptrend it is considered a bullish flag. Every dip has been bought and looks like we are finally coming out of the POC ( point of control zone) I am expecting to break out of the $45 and possibly reach $48- $49 ( it could go higher or lower )
Whats your price prediction on UMA?
Thank you
Burak
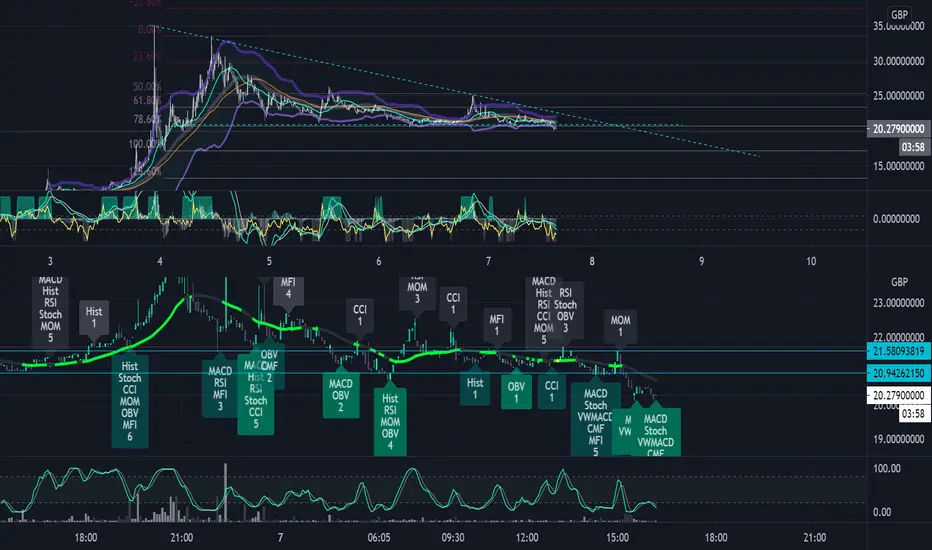
UMA Testing the 76% retracement line againAfer last weeks surge, UMA is testing one of the support levels from the first pullback, 3rd time since forming a downward triangle...
UMA Land a goshin' calamine lotionShe's down from a great flight, but fear not.
The waiting game is great game played by all things great. I'm not saying I know where this is headed, but these ethereum based alt coins are creating the true value for the mama coin Ethereum. These alt coins are the spindles that will support universes. These times will be forever remembered as ground floor.