UMA/USDT Weekly Analysis – At the Edge of Compression?📉 Chart Overview:
UMA/USDT has been in a long-term downtrend since its peak in 2021. For nearly three years, price action has been trapped within a descending triangle pattern, forming consistent lower highs while holding a strong horizontal support zone around $0.88 – $1.20.
Over the last two years, UMA has been consolidating sideways, creating a massive accumulation base. Now, the price is sitting just beneath the descending trendline, putting the asset in a critical compression zone — a potential breakout could trigger a major trend shift.
🔍 Technical Pattern Breakdown:
Multi-year Descending Triangle structure with a well-defined horizontal base.
Long-term accumulation zone between $0.88 – $1.20, repeatedly tested but not broken.
UMA is currently pressing against the descending resistance line, building pressure.
Setup hints at a compression breakout, often leading to explosive moves when volume confirms.
🟢 Bullish Scenario – If Breakout Confirms:
If UMA breaks out convincingly above the descending trendline (~$1.85) with a weekly candle close and strong volume, the market could start targeting these levels:
1. ✅ $2.94 – First horizontal resistance from prior breakdown zone.
2. ✅ $4.30 – Key structure from mid-2023.
3. ✅ $6.96 – Larger swing target from historical resistance.
4. 🚀 $16.92 – Mid-to-long term target if bullish momentum sustains.
5. 🎯 $32 – $43 – Potential long-term upside under extreme bullish conditions (not base scenario).
Bullish Confirmation Signs:
Weekly candle close above trendline + high volume
RSI breaks above 50 with momentum
Bitcoin remains stable or bullish
🔴 Bearish Scenario – If Rejected Again:
If UMA fails to break the trendline:
Price could drop back into support: $1.20 → $0.88
A breakdown below $0.88 would open the door to new all-time lows
Watch for wicks and volume drop as signs of weakness
When Is Breakout Considered Failed?
Strong rejection from $1.80–$1.90
Weekly close back below $1.20
Broader market (especially BTC) turns sharply bearish
🎯 Trader Strategy Outlook:
Swing traders: Wait for breakout confirmation and retest before entering.
Long-term investors: The $0.90–$1.20 range remains a solid accumulation zone with tight risk management.
Conservative traders: Avoid entry until a clear close above the descending trendline.
📌 Final Thoughts:
> UMA is now positioned at a major inflection point after two years of sideways compression. The chart structure shows clear signs of long-term accumulation, and a breakout could mark the beginning of a new bullish trend cycle. However, patience and confirmation are crucial — this is a setup worth watching, not chasing.
#UMAUSDT #UMA #CryptoBreakout #TechnicalAnalysis #DescendingTriangle #AltcoinSetup #SwingTradeOpportunity #CryptoAccumulation #BreakoutWatch #PriceAction
Umacoin

#UMA/USDT#UMA
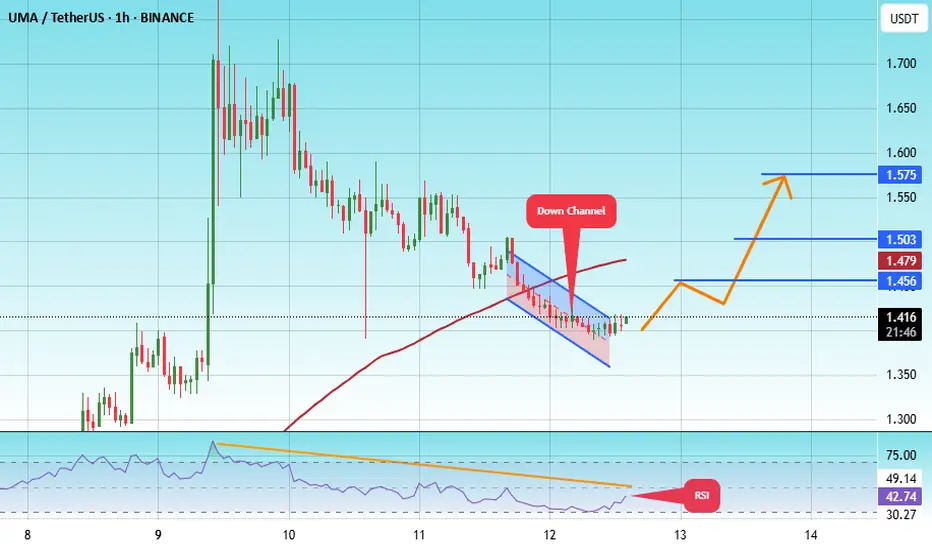
The price is moving within a descending channel on the 1-hour frame, adhering well to it, and is heading toward a strong breakout and retest.
We are experiencing a rebound from the lower boundary of the descending channel, which is support at 1.36.
We are experiencing a downtrend on the RSI indicator that is about to be broken and retested, supporting the upward trend.
We are heading toward stability above the 100 moving average.
Entry price: 1.41
First target: 1.45
Second target: 1.50
Third target: 1.57
#UMA/USDT#UMA
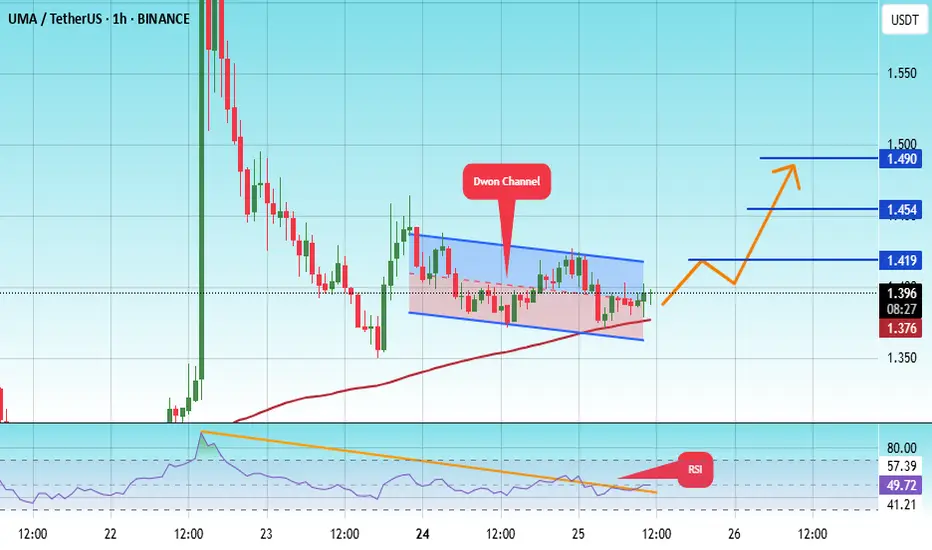
The price is moving within a descending channel on the 1-hour frame, adhering well to it, and is heading for a strong breakout and retest.
We are seeing a bounce from the lower boundary of the descending channel, which is support at 1.36.
We have a downtrend on the RSI indicator that is about to break and retest, supporting the upward trend.
We are looking for stability above the 100 moving average.
Entry price: 1.39
First target: 1.42
Second target: 1.45
Third target: 1.49
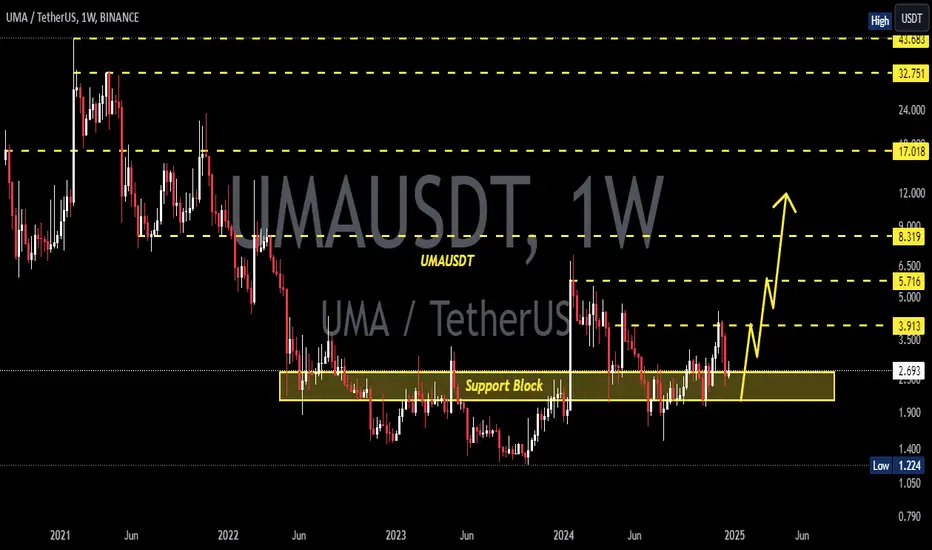
UMAUSDT 1WUMA ~ 1W
#UMA retest this support block,. And still continues to maintain its bullish structure. If you still have Conviction on this coin,. This support block will be a good buying place for now.
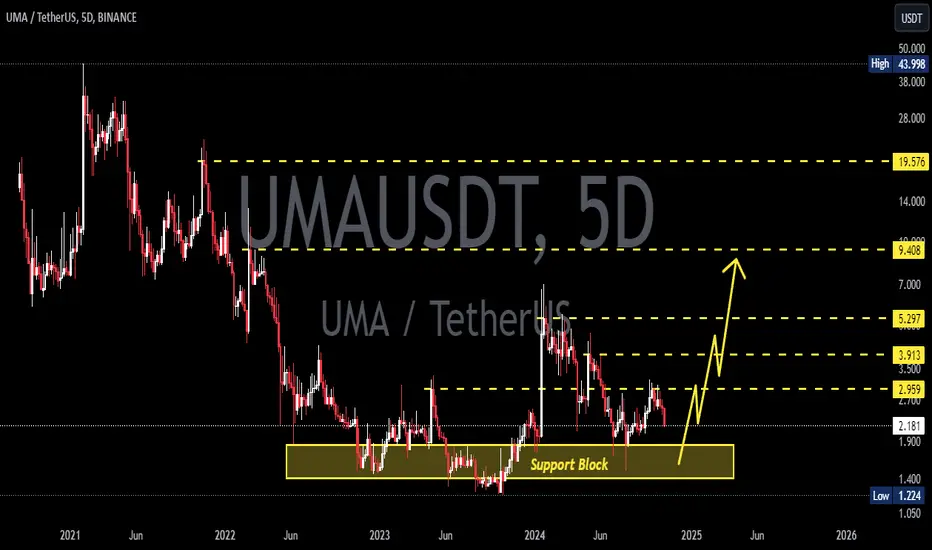
UMAUSDTNSE:UMA ~ 5D
#UMA If you still have Conviction on this coin, buy gradually on this support block. Minimum target 20%++
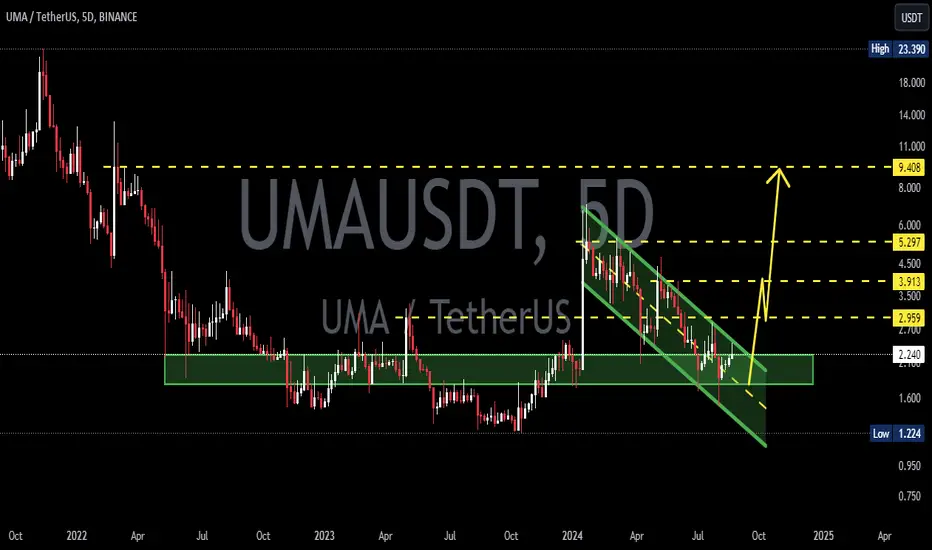
UMAUSDTUMA ~ 5D ✅
#UMA Make purchases gradually in this pattern. In our opinion, it is only a matter of time that this descending pattern is successfully broken.
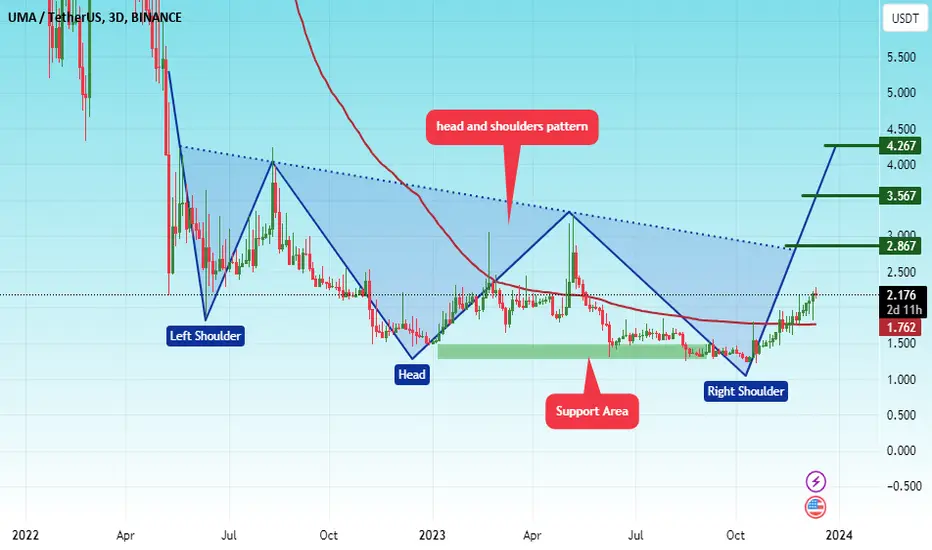
🚨#UMA/USDT lONG#UMA
The price has been moving in a head and shoulders pattern since July 2022
Moving average 100 was broken
We are now at the right shoulder of pattern
Current price 2.18
First goal 3.56
Second goal 4.26
Which represents 200% of the current price
Uma breaking Descending Channel seems Like Has already bottomed Out
Breaking descending channel incase Of successful breakout expecting 100 to 120% bullish move
keep eyes on uma for breakout

UMA LOOKS BULISH HEREForming Falling wedge In daily Timeframe
Also Printed Massive Bulish divergence In Rsi
Incase Of Breakout expecting Massive Bounce
