#UMA 200 % PUMP Loading#UMA 200 % PUMP Loading..
After falling to the buying zone, UMA could see an upside momentum of more than 200 %. Now, all coins will have some upside movement, but it will be temporary. I will keep providing all updates here.
Umausdtlong

UMAUSDT Forming Bullish WaveUMAUSDT is currently demonstrating a bullish wave pattern, signaling strong upward momentum and trend continuation. This wave formation suggests that the coin has entered a healthy impulsive phase, where higher highs and higher lows are forming consistently. The recent price action shows accumulation at key support levels, followed by breakout moves that align with this bullish structure, indicating renewed confidence among buyers.
Volume has remained consistently strong, which adds further credibility to the bullish wave pattern. Increasing trading volume during each leg up is a key confirmation that institutional and retail traders alike are stepping in. UMA, the native token of the UMA protocol focused on decentralized finance derivatives, is gaining traction again, fueled by both technical momentum and renewed interest in DeFi utility tokens.
With an expected gain range of 40% to 45%+, UMA appears poised for a substantial upside move if the current pattern plays out. Key resistance levels will need to be tested and broken, but the wave structure suggests buyers are in control. This setup presents an appealing opportunity for swing traders and trend followers who look for high-potential breakout trades with strong volume support.
✅ Show your support by hitting the like button and
✅ Leaving a comment below! (What is You opinion about this Coin)
Your feedback and engagement keep me inspired to share more insightful market analysis with you!

UMAUSDT — Major Battle at Demand Zone, Waiting for Breakout?🔎 Overview
The weekly chart of UMA/USDT is showing a very interesting setup:
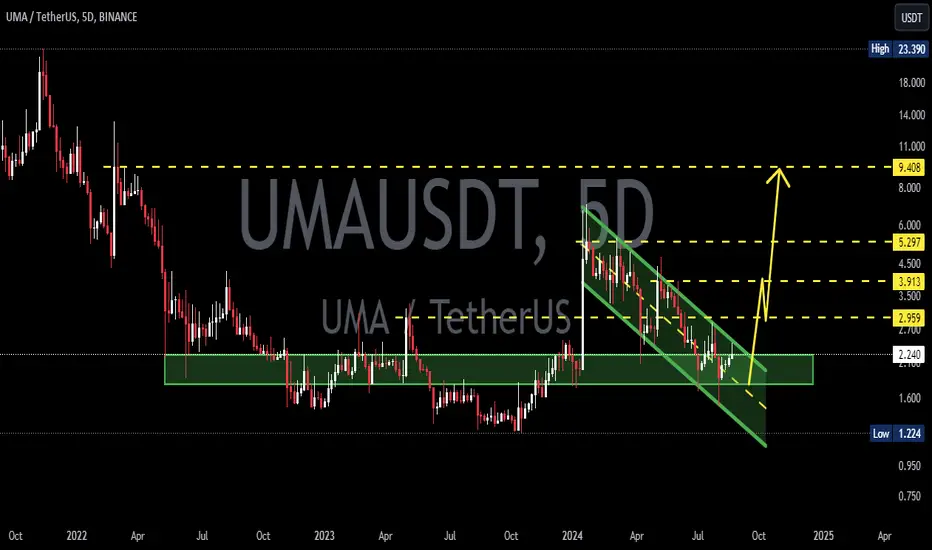
Since 2021, price action has been consistently forming lower highs, capped by a long-term descending trendline (yellow line).
On the other side, buyers continue to defend the strong demand zone at 1.20 – 1.70 (yellow box).
This structure has formed a multi-year descending triangle/base — a strong sign of long-term accumulation and compression.
In short, UMA is now at a crucial decision point: either a breakout that may spark a new bullish phase, or a breakdown toward new lows.
---
🟢 Bullish Scenario
1. The first confirmation will be a weekly close above the descending trendline and key horizontal level 2.28 USDT.
2. If confirmed, potential upside targets are:
2.94 USDT → minor resistance
3.50 USDT → psychological level & prior supply zone
4.30 USDT → major resistance
6.96 USDT → extended target for strong momentum
3. A high-volume breakout could trigger a short squeeze, accelerating price movement upward.
📌 Key point: A breakout above 2.28 could open the door toward the 4–7 USDT range.
---
🔴 Bearish Scenario
1. If the price fails to hold 1.20 – 1.30 USDT, the major demand zone collapses.
2. Next key downside target will be 0.888 USDT (the historical low).
3. Losing that level would push UMA into new price discovery to the downside, with no strong support below.
📌 Key point: Below 1.20, bearish pressure dominates, with risk of retesting 0.888 USDT.
---
📐 Pattern & Current Setup
Pattern: Multi-year descending triangle with flat demand vs sloping supply.
Current state: Sideways inside demand, waiting for a decisive move.
Sentiment: Neutral → Bullish if breakout confirmed, Bearish if demand breaks.
Weekly timeframe: Always wait for weekly close confirmations, not just intraday wicks.
---
⚖️ Trading Plan & Risk Management
Conservative traders: Wait for a confirmed breakout and retest above 2.28 before entering.
Aggressive traders: May accumulate small positions inside 1.20–1.70 demand zone with tight stop-loss below 1.20.
Risk/Reward: Attractive setup since downside is limited (tight invalidation), while upside targets are layered and potentially exponential.
---
🔥 Final Takeaway:
UMA is at a multi-year inflection point. As long as the demand zone holds, it remains an attractive accumulation area. A breakout above the descending trendline could trigger a strong bullish reversal, while losing 1.20 would expose UMA to retest its historical low at 0.888.
#UMA #UMAUSDT #CryptoAnalysis #TechnicalAnalysis #PriceAction #DescendingTriangle #SupportResistance #BreakoutSetup #CryptoTrading #AltcoinAnalysis

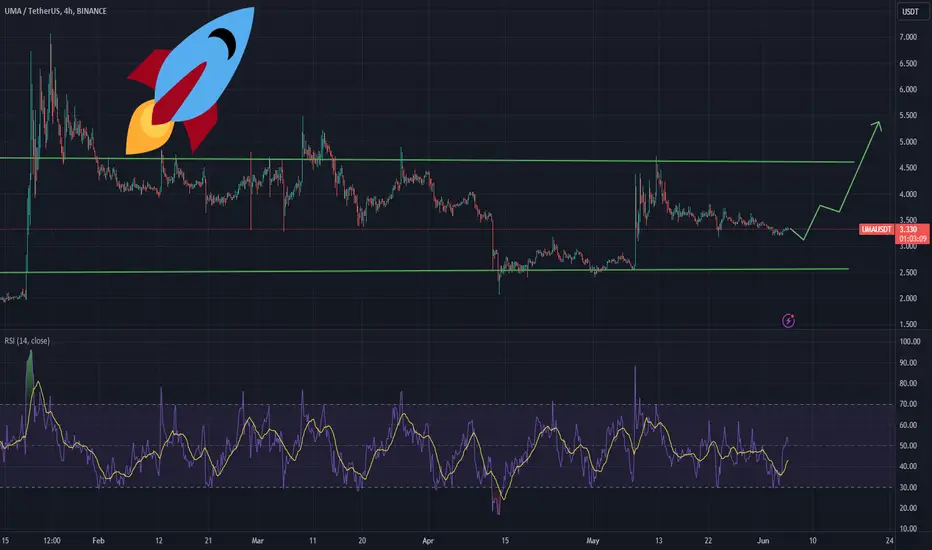
UMAUSDT Forming Bullish WaveUMAUSDT is exhibiting a strong bullish wave pattern, signaling a powerful upward momentum that could drive the price significantly higher in the coming sessions. This pattern often indicates a healthy continuation of trend following a consolidation or corrective phase. The current structure suggests that UMA is preparing for another leg upward, potentially reaching gains between 90% to 100%+ based on the historical wave amplitude and projected breakout zones.
Volume activity in UMAUSDT has remained consistent and healthy, supporting the idea that institutional and retail investors alike are accumulating during this setup. This type of volume behavior is often a key indicator that a significant move is imminent. When price aligns with volume in this way, it adds further credibility to the bullish thesis and highlights growing interest in the project across the market.
Fundamentally, the UMA project continues to attract attention with its decentralized financial contracts and oracle solutions, which are gaining traction in broader DeFi ecosystems. The technical setup now mirrors this fundamental strength, providing a strong combination that many smart traders and swing investors look for. With bullish wave patterns typically followed by explosive moves, UMAUSDT should be on every breakout trader’s radar.
✅ Show your support by hitting the like button and
✅ Leaving a comment below! (What is You opinion about this Coin)
Your feedback and engagement keep me inspired to share more insightful market analysis with you!

#UMA is 102% ready for the pump#UMA is 102% ready for the pump..
Hold Tight And Enjoy Ride.
!! Om Nmah Shiavye !!
$ Namaste $

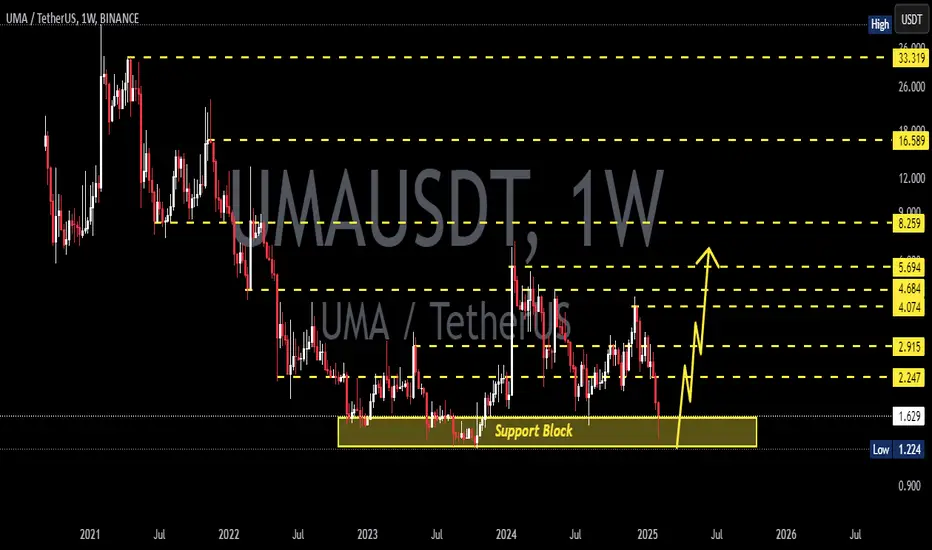
UMA/USDT Weekly Analysis – At the Edge of Compression?📉 Chart Overview:
UMA/USDT has been in a long-term downtrend since its peak in 2021. For nearly three years, price action has been trapped within a descending triangle pattern, forming consistent lower highs while holding a strong horizontal support zone around $0.88 – $1.20.
Over the last two years, UMA has been consolidating sideways, creating a massive accumulation base. Now, the price is sitting just beneath the descending trendline, putting the asset in a critical compression zone — a potential breakout could trigger a major trend shift.
🔍 Technical Pattern Breakdown:
Multi-year Descending Triangle structure with a well-defined horizontal base.
Long-term accumulation zone between $0.88 – $1.20, repeatedly tested but not broken.
UMA is currently pressing against the descending resistance line, building pressure.
Setup hints at a compression breakout, often leading to explosive moves when volume confirms.
🟢 Bullish Scenario – If Breakout Confirms:
If UMA breaks out convincingly above the descending trendline (~$1.85) with a weekly candle close and strong volume, the market could start targeting these levels:
1. ✅ $2.94 – First horizontal resistance from prior breakdown zone.
2. ✅ $4.30 – Key structure from mid-2023.
3. ✅ $6.96 – Larger swing target from historical resistance.
4. 🚀 $16.92 – Mid-to-long term target if bullish momentum sustains.
5. 🎯 $32 – $43 – Potential long-term upside under extreme bullish conditions (not base scenario).
Bullish Confirmation Signs:
Weekly candle close above trendline + high volume
RSI breaks above 50 with momentum
Bitcoin remains stable or bullish
🔴 Bearish Scenario – If Rejected Again:
If UMA fails to break the trendline:
Price could drop back into support: $1.20 → $0.88
A breakdown below $0.88 would open the door to new all-time lows
Watch for wicks and volume drop as signs of weakness
When Is Breakout Considered Failed?
Strong rejection from $1.80–$1.90
Weekly close back below $1.20
Broader market (especially BTC) turns sharply bearish
🎯 Trader Strategy Outlook:
Swing traders: Wait for breakout confirmation and retest before entering.
Long-term investors: The $0.90–$1.20 range remains a solid accumulation zone with tight risk management.
Conservative traders: Avoid entry until a clear close above the descending trendline.
📌 Final Thoughts:
> UMA is now positioned at a major inflection point after two years of sideways compression. The chart structure shows clear signs of long-term accumulation, and a breakout could mark the beginning of a new bullish trend cycle. However, patience and confirmation are crucial — this is a setup worth watching, not chasing.
#UMAUSDT #UMA #CryptoBreakout #TechnicalAnalysis #DescendingTriangle #AltcoinSetup #SwingTradeOpportunity #CryptoAccumulation #BreakoutWatch #PriceAction

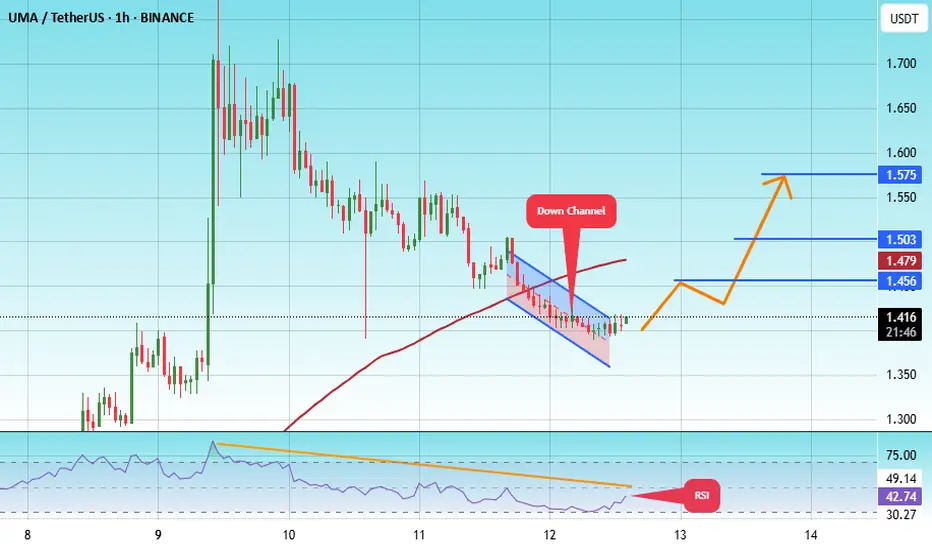
#UMA/USDT#UMA
The price is moving within a descending channel on the 1-hour frame, adhering well to it, and is heading toward a strong breakout and retest.
We are experiencing a rebound from the lower boundary of the descending channel, which is support at 1.36.
We are experiencing a downtrend on the RSI indicator that is about to be broken and retested, supporting the upward trend.
We are heading toward stability above the 100 moving average.
Entry price: 1.41
First target: 1.45
Second target: 1.50
Third target: 1.57
UMA Trendline Shattered! What’s Next for Bulls?BINANCE:UMAUSDT has broken above the key trendline resistance and is now testing a minor resistance zone.
If a candle closes decisively above this marked zone, we could see a parabolic upside move in the coming sessions.
This breakout structure, paired with strong momentum, makes it a setup worth watching closely.
DYOR, NFA

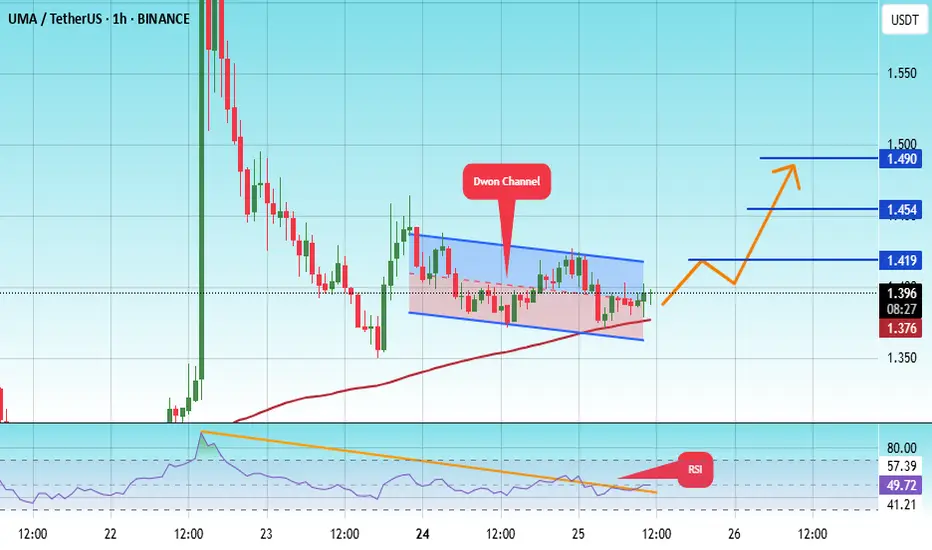
#UMA/USDT#UMA
The price is moving within a descending channel on the 1-hour frame, adhering well to it, and is heading for a strong breakout and retest.
We are seeing a bounce from the lower boundary of the descending channel, which is support at 1.36.
We have a downtrend on the RSI indicator that is about to break and retest, supporting the upward trend.
We are looking for stability above the 100 moving average.
Entry price: 1.39
First target: 1.42
Second target: 1.45
Third target: 1.49
UMAUSDT – Critical Level at 1.278!UMAUSDT – Critical Level at 1.278! 🚨
“If 1.278 breaks, we’re flipping bearish—and we won’t hesitate to short!”
🔥 Key Insights:
✅ 1.278 = Make-or-Break Level – Holding = bullish continuation, breaking = serious trouble.
✅ First Retest = High-Probability Short Zone – If we break, we wait for confirmation.
✅ Aggressive Approach? Direct Short on Breakdown – For those who love momentum plays.
💡 The Game Plan:
If 1.278 Holds – We Stay Bullish – No reason to fight the trend.
If 1.278 Breaks – Short on Retest or Directly – We trade what we see, not what we hope.
CDV & Volume Profile Must Confirm Weakness – If buyers disappear, we attack.
“Markets don’t lie—if this level gives way, we strike without hesitation!” 🚨🔥📉
A tiny part of my runners;
💼 STMXUSDT: 2 Buying Areas
🐢 TURBOUSDT: Buy Zones and Buyer Presence
🌍 ICPUSDT.P: Massive Upside Potential | Check the Trade Update For Seeing Results
🟠 IDEXUSDT: Spot Buy Area | %26 Profit if You Trade with MSB
📌 USUALUSDT: Buyers Are Active + %70 Profit in Total
🌟 FORTHUSDT: Sniper Entry +%26 Reaction
🐳 QKCUSDT: Sniper Entry +%57 Reaction

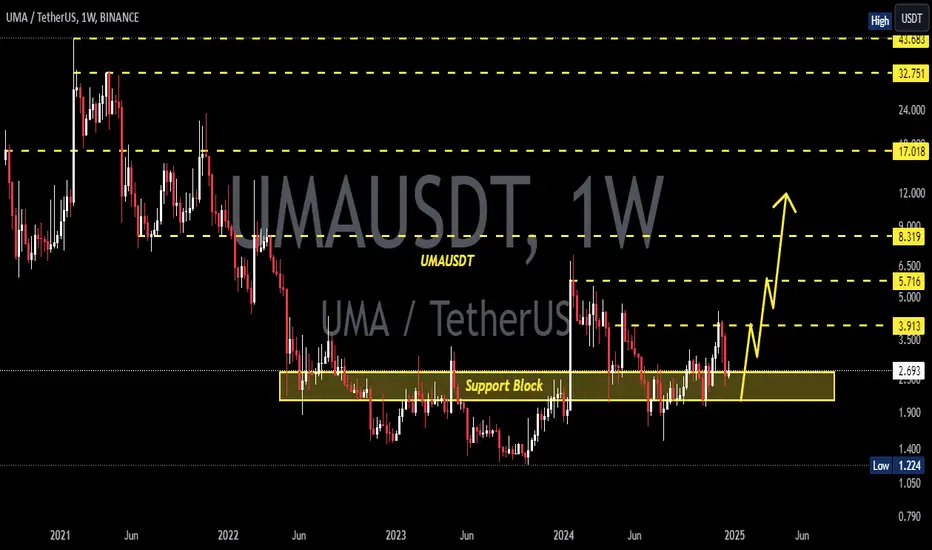
UMAUSDT 1WUMA ~ 1W Analysis
#UMA This is the lowest support for now. Buy from here if you still have a Conviction on this coin with a minimum target of 20+
UMAUSDT 1WUMA ~ 1W
#UMA retest this support block,. And still continues to maintain its bullish structure. If you still have Conviction on this coin,. This support block will be a good buying place for now.
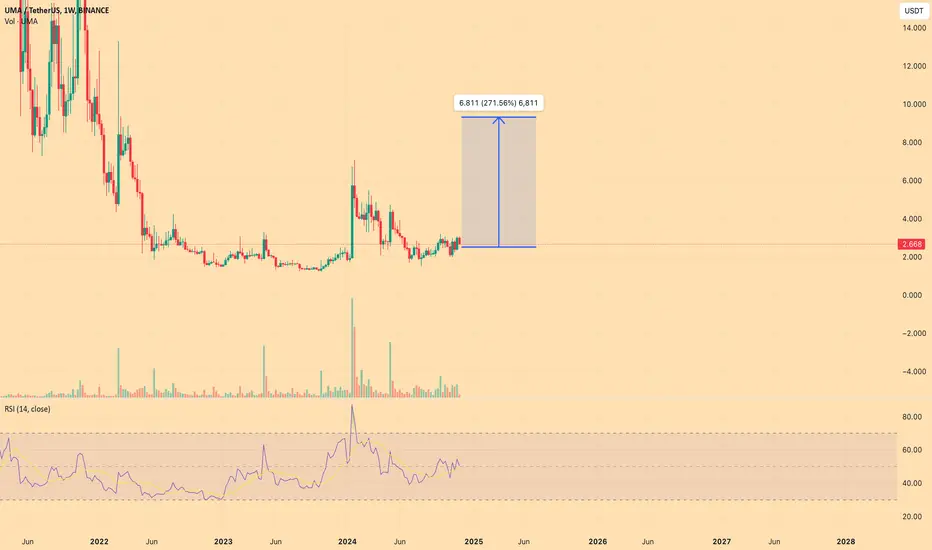
UMA USDT 300% potential UMA/USDT has a 300% potential upside if it sustains strong support levels and breaks significant resistance zones on the weekly timeframe. Growing adoption of the UMA protocol for decentralized financial contracts, coupled with bullish market sentiment, could drive such exponential growth.
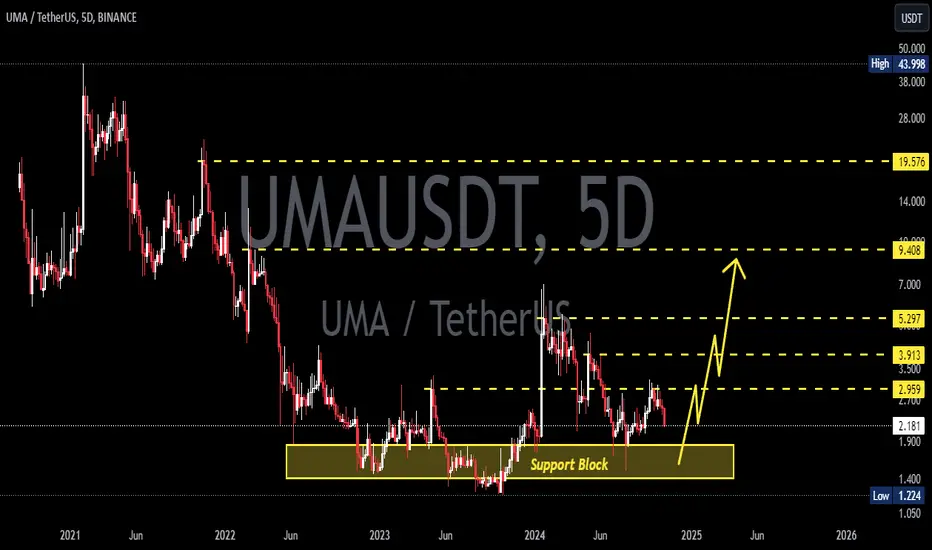
UMAUSDT 5DUMA ~ 5D
#UMA If you still have Conviction on the coin,. buy in stages from here. with a minimum target of 20%. It is only a matter of time until this resistance line is broken
UMAUSDTNSE:UMA ~ 5D
#UMA If you still have Conviction on this coin, buy gradually on this support block. Minimum target 20%++
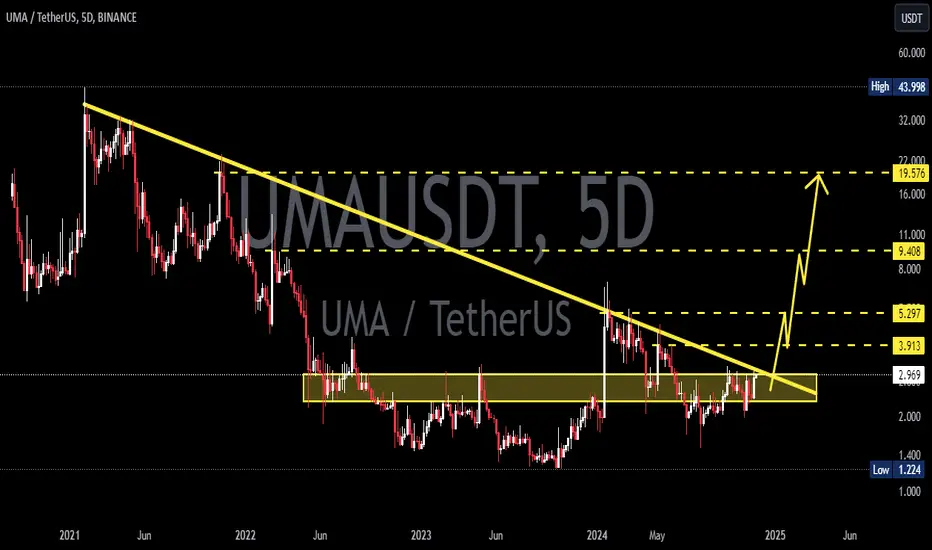
UMAUSDTUMA ~ 5D ✅
#UMA Make purchases gradually in this pattern. In our opinion, it is only a matter of time that this descending pattern is successfully broken.
UMA gold signal#UMA price is completing the ascending triangle pattern. When the price can break the resistance of the pattern, it can grow again to its previous ceiling.
The demand level of $3.100-$3.200 - is being consumed well. It is expected that the supply level of 3,800-3,600 dollars will be completely consumed soon, and the price will start to grow.
If the demand level is broken and the price falls below it, the trend will be downward.
thank you
UMA token completed a setup for upto 16.50% pumpHi dear members, hope you are well and welcome to the new trade setup of UMA token with US Dollar pair.
Previously we caught 33% pump of UMA as below:
Now on a 2-hr time frame, UMA has formed a bullish AB=CD move for next price reversal.
Note: Above idea is for educational purpose only. It is advised to diversify and strictly follow the stop loss, and don't get stuck with trade.

#UMA/USDT#UMA
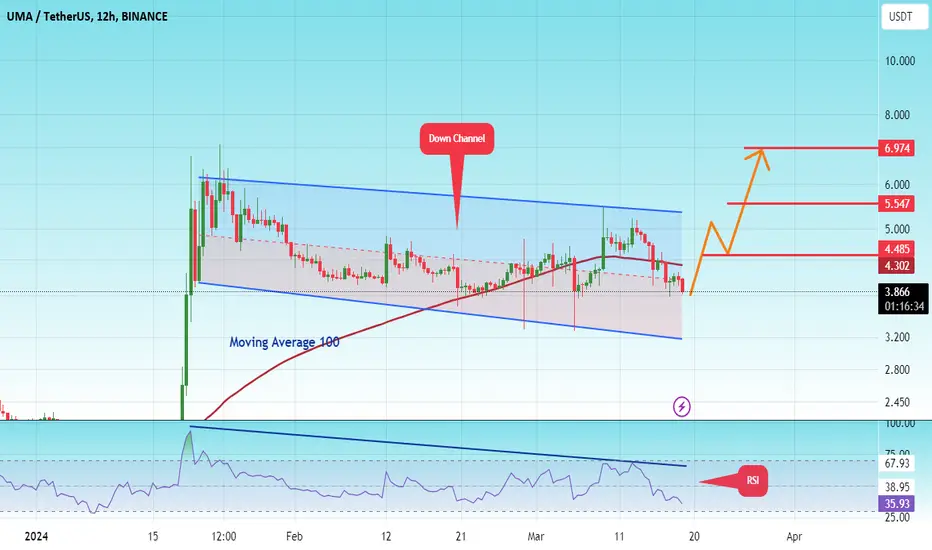
The price is moving in a bearish flag channel on a 12-hour frame and we have a support area in green at the level of the lower border of the channel at the price of 3.50.
We have a tendency to stabilize above the Moving Average 100
The RSI indicator has a downtrend that is about to break higher
Entry price 3.877
The first goal is 4.485
Second goal 5.54
Third goal 6.97
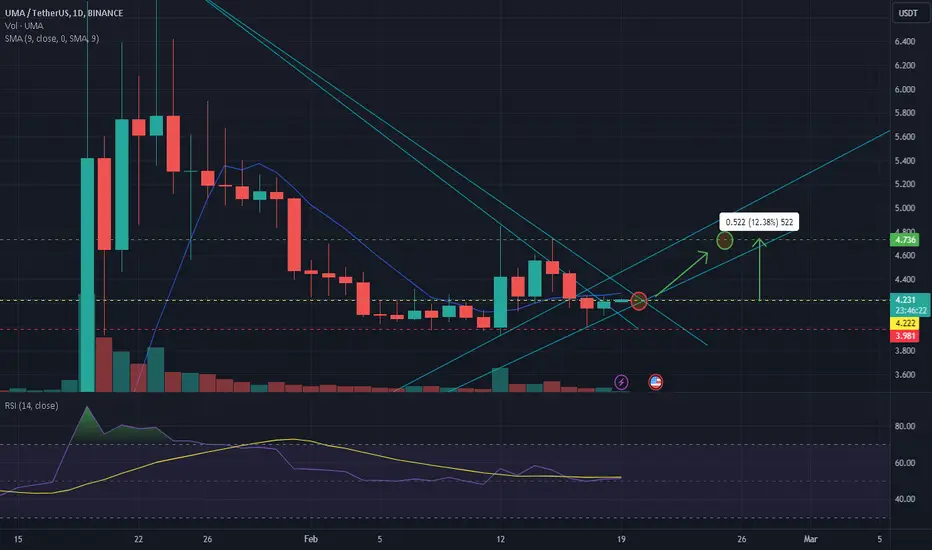
BULLISH MARKET UMAUSDT - GRAB A BAGEmissary over here. Bullish market. Grab a bag. Very early entry.
Yellow line entry limit order - 4.222
Green line take profit - 4.736
Red line stop loss - 3.981
Setup will resolve in 2-3 days, maybe 5. No leverage needed.
DYOR, greettings
Leave your support, comment, boost, follow and thank you beforehand.
UMA completing a setup for upto 19% pumpHi dear friends, hope you are well and welcome to the new trade setup of UMA token with US Dollar pair.
Recently we caught 12% pump of UMA as below:
Now on a daily time frame, UMA is about to complete a bullish Gartley move for next price reversal.
Note: Above idea is for educational purpose only. It is advised to diversify and strictly follow the stop loss, and don't get stuck with trade.

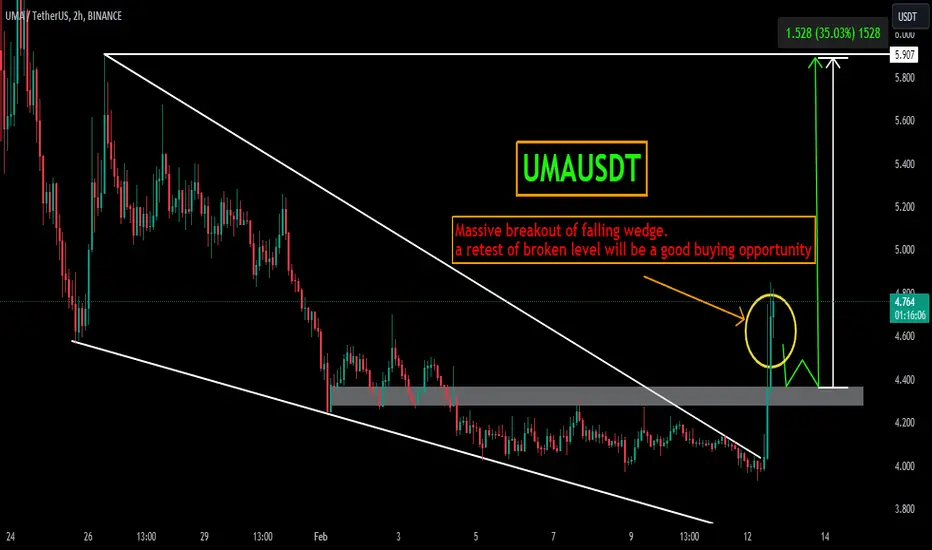
UMAUSDTUMAUSDT is trading in falling wedge pattern. The price was reacting well the support and resistance of wedge.
Currently the price has given the massive breakout from falling wedge and after successful retest of the level will be bullish signal and seems like the price may go for another leg higher.
If the breakout sustain to upside the optimum target could be 6
What you guys think of this idea
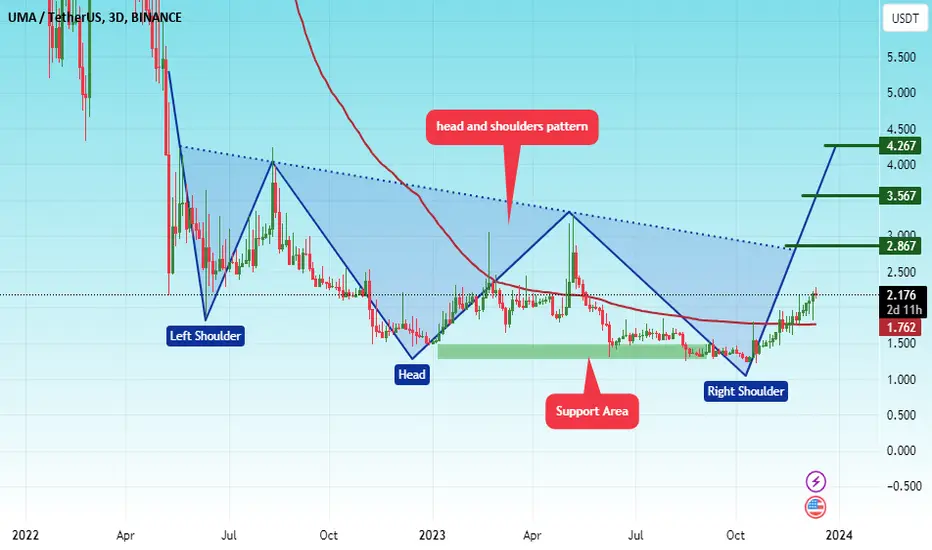
🚨#UMA/USDT lONG#UMA
The price has been moving in a head and shoulders pattern since July 2022
Moving average 100 was broken
We are now at the right shoulder of pattern
Current price 2.18
First goal 3.56
Second goal 4.26
Which represents 200% of the current price