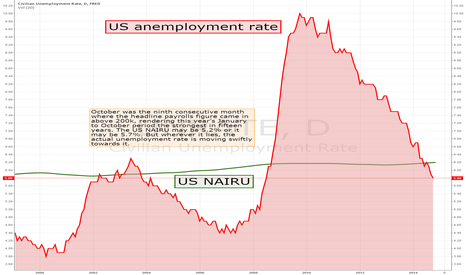
UNEMPLOYMENT RATE NOW WITHIN TOUCHING DISTANCE OF NAIRU ESTIMATEOctober was the ninth consecutive month where the headline payrolls figure came in above 200k, rendering this year’s January to October period the strongest in fifteen years. The US NAIRU may be 5.2% or it may be 5.7%. But wherever it lies, the actual unemployment rate is moving swiftly towards it.
Friday’s Employment Situation Report showed that the US economy added 214k jobs last month. Although weaker than most forecasters – Fathom included – had expected, it was nevertheless the ninth consecutive month where the headline payrolls figure came in above 200k, rendering this year’s January to October period was the strongest in fifteen years.
In its latest policy statement, the FOMC acknowledged that “underutilisation of labor market resources … … gradually diminishing”. Previously, underutilisation had been described repeatedly as “significant”. In our view, the US labour market is tightening rapidly. The four-week moving average of initial jobless claims fell to 279K in the week-ending November 1st – the lowest reading in more than fourteen years. The non-manufacturing ISM employment index can also be helpful in predicting payrolls from time to time, and this rose sharply in October to 59.6. It was the combination of weak initial claims and a strong reading on the ISM survey that had led us to expect a stronger payrolls figure this month; our own forecast was for an above-consensus rise of 300k.
The headline unemployment rate fell by 0.1 percentage points to 5.8% in October. According to the OECD, US unemployment is already below the non-accelerating inflation rate of unemployment, or NAIRU. It is just 0.1 percentage points above the Congressional Budget Office (CBO) estimate of the short-term NAIRU, although it remains 0.3 percentage points above the central tendency range of FOMC members’ forecasts of the longer-run unemployment rate.
The salient fact is that, wherever the precise value of the NAIRU might lie – and there will always be some uncertainty about this – the actual rate of unemployment is closing in on it rapidly. In fact, it is unprecedented for the gap between the actual unemployment rate and the NAIRU to diminish so rapidly while policy remains on hold.
If the labour market continues to tighten then this should soon feed through to stronger wage growth. Growth in average hourly earnings remained at 2.0% in the twelve months to October according to the Bureau of Labor Statistics. But the Employment Compensation Index for private industry workers – the measure that includes wages, benefits and bonuses – rose at its fastest pace in over five years in the four-quarters to Q3. One data point does not seal it, of course. However, the National Federation of Independent Business survey, which has good leading indicator properties, also shows that the net proportion of small firms planning to raise wages is the highest since December 2008.
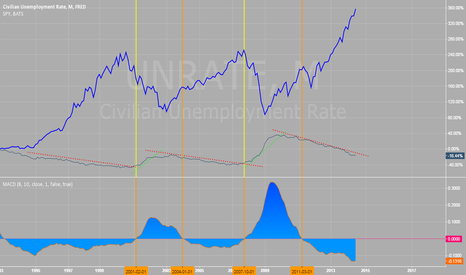
Unemployment
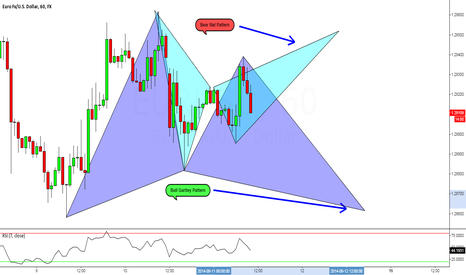
Bracketing The EuroIt's been a rough go around for pattern trades as of late (I'll talk more about that in my Weekend Review tonight www.youtube.com) But if the pattern is valid and meets you ROE's then you've got to pull the trigger.
I'm still holding the 2nd half of my position on a EURUSD short from earlier in the week, but today we've got both a bullish gartley and a bearish bat bracketing this pair.
For news today we want to keep an eye on 8:30am (ny) as our usual Unemployment Claims are released and then once again at 3:00pm (ny) as the ECB President Mario Draghi is set to speak.
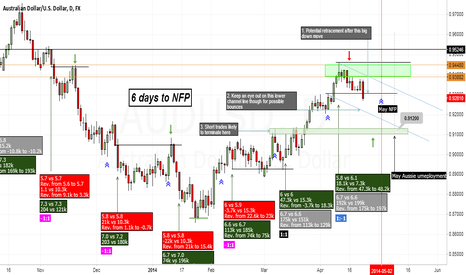
AUDUSD - CPI q/q AftermathQuarterly CPI came out soft and Aussie declined across the board + China Flash PMI despite an increase from 48 to 48.3 was still seen as weak. In line with this chart, next support is likely to come in around 0.912 - 0.92 levels. 6 days for NFP data before the next big move. Also on the same day (02/05) Aussie PPI will be released as well.
Note that on 01/05 we get China manufacturing PMI which is yet another risk to AUD.
A retracement to 0.93 is ideal to short or to add to the position, provided it comes in before this Friday or by next Tuesday at the latest. It will be more valid if AUDUSD declines more, bounces off the lower channel line and then continues its decline picking up from 0.93.
The next 6 days will be critical to the AUDUSD as in the past we see how this pair usually deviates from its direction only to pick up the original direction from the NFP release day.
The way I see it.. if Aussie retraces to 0.93 before NFP release then it comes in line with the overall view. A drop to 0.912 regions and then pick up from NFP day (unless NFP is 'Extremely' bullish, which includes bullish revision to the past, better than expected jobs and unemployment rate).
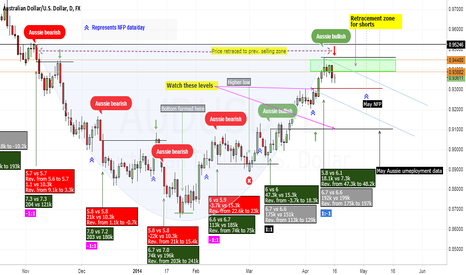
AUDUSD Fundamental & Technical Chart - April 2014So after a bullish unemployment data, the Aussie hit a high resistance level and is dropping lower. There are some important observations to bear in mind.
1. This could be a possible Cup & Handle formation we could be looking at. (Represented by the blue channel lines sloping down). Its still early, but this pattern is worth keeping an eye on.
2. Price quickly dropped from what looks like a retracement to Nov'13 unemployment day price action.
3. Downside moves likely to be supported near 0.93 (apprx) followed by 0.91.
4. 0.91 region to be watched closely as we can 'expect' price to find support here and then rally back up... but that comes later (closer to NFP release)
5. Notice that Aussie seems to set its direction after NFP release. So this warns us that the moves Aussie is making could be fake and NFP could set the real direction for AUDUSD. That said, if NFP comes out bullish (incl. upward revision to last month's numbers) we can expect price action to head lower.
