Natural Gas Bullish Reversal...Are the Lows in?U.S. natural gas inventories increased by 48 billion cubic feet last week to 3,123 Bcf, increasing the surplus over the five-year average.
Consensus / forecast was 37Billion Cubic feet.
Despite a much higher build than expected Nat gas saw positive price action.
This appears to simply be a dead cat bounce before we go lower.
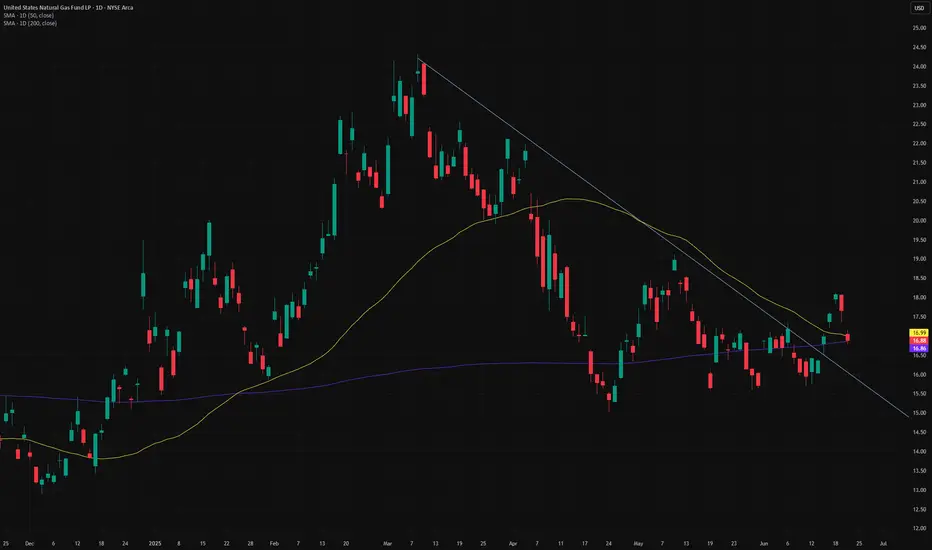
A death cross on the daily chart has occurred. This signal often results in a small bounce before going lower.
UNG

Natural Gas Crisis: Profits were made!Nat Gas plunged to a 1-week low Monday on the outlook for cooler US temperatures.
A report came out that Nat gas has heat peak demand which is scaring investors.
Nat GAs equities got demolished which could indicate that this breakdown is real.
We got rejected off the daily 50 MA & Knifed through the 200 Daily MA.
Some clear technical breakdowns are now in affect.
We banked on EQT put options that ran over 400%. This trade was called out free on our channel. You tube Short.

Gold | Oil | Dollar | Silver | Natural Gas July 2025 Forecast.Gold | Oil | Dollar | Silver | Natural Gas July 2025 Forecast.
NYMEX:NG1! COMEX:GC1! COMEX:SI1! NYMEX:CL1!

Natural Gas - The Epic Reversal? Natural gas had an astonishing move to the upside. Closing up over 5% today.
This volatility can make all tarders head spin if youre not used to it.
Why did Nat gas pop today?
Partly from being oversold and into really good technical support, Natural gas inventories were released today at 10:30am.
The inventories showed a smaller build than the market expected which implies stronger demand. 56B consensus vs 53B actual.
This could potentially be the start to a new bullish trend.
Names like EQT & AR hit some major support today. Some call options on these names have been accumulated.

Gold | Oil | Dollar | Silver | Natural Gas July 2025 Forecast.July 2025 Forecast.
Gold | Oil | Dollar | Silver | Natural Gas
NYMEX:NG1! COMEX:GC1! COMEX:SI1! AMEX:UNG

NATURAL GAS - Who can Predict this wild beast?Natural gas got demolished today, down over 8%.
The one headline we saw hitting the tape that is having some partial influence:
"Vessel Arrives at LNG Canada to Load First Cargo, Strengthening Global Supply Outlook – LNG Recap"
Today, we did hedge our core long UNG position with a short dated $56 put on EQT.
We are already green on that trade and looking for $56 level to come into play.
Natural gas volatility sure trades in a world of its own which is why it is key to size accordingly.

Natural Gas - Silver Lining!Natural gas is ending the day with a daily bottoming tail.
Potentially forming an inverse head and shoulder pattern that takes us above the key $3.83 level.
We took profits on our EQT put hedge! The put contract went up over 100%
Lets see if Nat gas can build some pressure.

Natural Gas plummets - Israel and Iran PeaceIran and Israel de escalation is causing nat gas to plummet.
Fear of the "Hormuz Strait" closing have slipped away!
Roughly 20% of global liquefied natural gas (LNG) trade flows through the Strait of Hormuz, primarily from Qatar (~9.3 Bcf/d) with smaller volumes from the UAE (~0.7 Bcf/d)
In 2024, approximately 83–84% of those LNG volumes were destined for Asian markets—China, India, South Korea

Give It The Gas
I've got a long Idea for the Henry Hub Natural Gas ETF, UNG.
After rising in late-2024/early-2025, UNG fell again (Mar-Jun), but recently (significantly) crossed above the trendline from that down move.
Time to look for a long position. But UNG is volatile - to reduce risk it's best to pick it up after a minor pullback. That seems to be happening now.
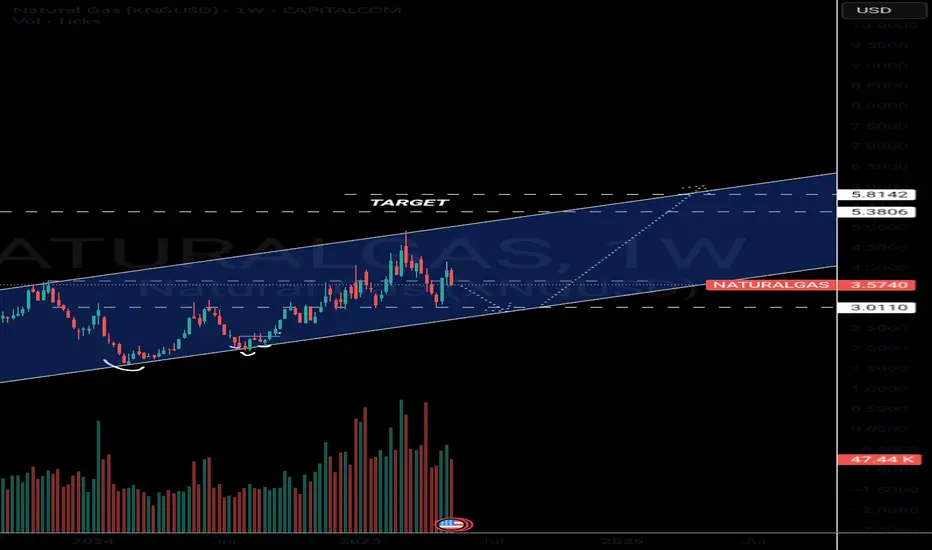
One thing I find useful when looking at an ETF backed by a commodity is to look at the chart for the underlying commodity future.
To be clear, I am NOT trading the future, only looking to it for (more) guidance.
In this case, for UNG, I chose the Aug Henry Hub Natural Gas contract (NGQ2025), which TradingView provides 10-minute delayed date for;
Here we see the trendline (light blue) is even stronger (i.e., more points of contact). In addition, the contract made a series of slightly higher lows (yellow line) before breaking through strong resistance at ~3.82 (a level which may now be providing support). Trendline breaks alone can be very flighty - they often don't work - so it helps to have other supporting factors (e.g., higher lows preceding, strong resistance breaks). And, not shown here but useful, UNG/NG is not overbought on the daily chart.
Now one could take a long position here, with a stop below the trendline, but I prefer my knives to at least slow down before I catch them.
Looking at the 4-hour chart for a reversal to enter;
A reversal and close above 3.92 would give a good entry point (using UNG), with a tighter stop at ~3.7 (or ~16.25 on UNG).
This is a "work in progress", so the actual trigger levels may change a bit. Or the whole setup could invalidate itself if the instrument(s) corrects back to at/below the trendline.
For targets, natural gas has resistance at 19.1 and again at 24.0 - best to trail a stop as UNG's price rises, bringing it up as each zone is hit.
For the long position, I anticipate an ITM option ~90 days out. I'm doing this in a taxable account, and for tax purposes UNG issues a K-1 to shareholders. I can do without the hassle. Option holders do not receive K-1's* (unless assigned), making tax reporting more routine.
Time to step on the gas?
*To the best of my knowledge - if any tax experts here know otherwise please drop a comment.
My ideas here on TradingView are for educational purposes only. It is NOT trading advice. I often lose money and you would be a fool to follow me blindly.
Natural Gas | Oil | Dollar | Silver | Gold Price Forecast.Natural Gas | Oil | Dollar | Silver | Gold Price Forecast.
NYMEX:NG1! NYMEX:CL1! COMEX:GC1! COMEX:SI1!

Navigating a Pullback in Natural GasNatural gas prices have been on a wild ride lately, with a recent pullback raising questions about the future of this energy source. This video provides insights into navigating this market volatility, offering actionable strategies for live trading in the midst of uncertainty.
Current weather forecasts for the U.S. show neither extreme heat nor cold—limiting heating or cooling demand. This typical spring-to-summer lull supports low prices .
Although rig counts in the U.S. are falling—the latest count shows an 8‑week decline—production remains ample. Storage levels remain healthy, and oversupply worries persist .
Natural gas rallied earlier today but faced resistance at the $4/mmBtu mark—a major psychological barrier. After hitting that ceiling, prices gave back gains, a typical sign of "rally exhaustion"

Natural Gas Explodes - Bullish Option ContractsTechnical Breakout Observed! Huge upside potential!
Inverse Head & Shoulders breakout on daily chart.
Weekly Bullish Cross 7/20 MA.
- Increased Demand: After a sluggish 2024, demand for natural gas is rebounding—especially for electricity generation in North America and Asia. This is tightening the market and pushing prices up.
- LNG Export Boom: New liquefied natural gas (LNG) export terminals, like the one coming online in British Columbia, are expanding shipping capacity. That’s opening up more international markets and driving up prices domestically.
- Geopolitical Tensions: Broader energy markets are reacting to instability in the Middle East, particularly between Iran and Israel. While this directly impacts oil, it also creates uncertainty across all energy commodities, including natural gas.
- Inventory and Supply Adjustments: After oversupply in 2024, producers are now recalibrating. But with inventories still low in some regions, prices are sensitive to even small disruptions

Natural Gas - Soaring Upside - Option Plays!Technical Breakout Observed! Huge upside potential
- Increased Demand: After a sluggish 2024, demand for natural gas is rebounding—especially for electricity generation in North America and Asia. This is tightening the market and pushing prices up.
- LNG Export Boom: New liquefied natural gas (LNG) export terminals, like the one coming online in British Columbia, are expanding shipping capacity. That’s opening up more international markets and driving up prices domestically.
- Geopolitical Tensions: Broader energy markets are reacting to instability in the Middle East, particularly between Iran and Israel. While this directly impacts oil, it also creates uncertainty across all energy commodities, including natural gas.
- Inventory and Supply Adjustments: After oversupply in 2024, producers are now recalibrating. But with inventories still low in some regions, prices are sensitive to even small disruptions

Natural Gas | Oil | Dollar | Silver | Gold Price Forecast.Natural Gas | Oil | Dollar | Silver | Gold Price Forecast.
COMEX:SI1! COMEX:GC1! NYMEX:CL1! AMEX:UNG

Do You Smell That...Natural Gas Burning!Recent Trends: The Energy Information Administration (EIA) reported the seventh consecutive weekly gain in inventories since late April, indicating a steady buildup ahead of summer demand.
Regional Highlights:
East: 340 Bcf
Midwest: 396 Bcf
Mountain: 166 Bcf
Pacific: 199 Bcf
South Central: 658 Bcf
Next inventory report is June 12 2025
June 5 - 122B Build
May 29 - 101B build
May 22 - 120B Build
These last builds have come in higher than consensus andd price is still holding.
A weekly Bullish cross of the 7 / 20 MA is about to occur. This indicates high provability of higher prices on the next few months if this can hold above the key MA's.

Natural Gas | Oil | Dollar | Silver | Gold Price Forecast.Natural Gas | Oil | Dollar | Silver | Gold Price Forecast.
OANDA:XAGUSD COMEX:SI1! NYMEX:NG1! COMEX:GC1!

Bullish Intraday Patterns Everywhere!SPX had a wonderful intraday hourly chart confirmed breakout. This pattern is bullish and likely will continue higher.
The bulls tomorrow would love to confirm the daily chart breakout and will try to push for that.
SPY/SPX is holding more relative strength than the Q's & IWM which is displaying broad participation.
There are many bullish charts showing accumulation, golden crosses and bullish MA crossovers.
The DXY appears to be wanting to break down to around $97.00 which should yield more upside.
We secured profits today on SPY 594 calls & NVDA 144 calls.
We still remain net long and see the S&P 500 over $6000
Apple, XYZ, AI - are bullish setups were continuing to manage.

Natural Gas Roaring & SoaringNat gas had an epi +8% rally today.
The question is do the bull have more gas left in the tank or do the bears start to take over and press price lower?
We had news across the energy sector that spiked most energy assets.
Typically news based pops of this nature don't last.
If we get back above 3.84/3.85 then there might be a convincing opportunity to press this long
As of now i still lean bearish but holding no Nat Gas position.

Natural Gas | Oil | Dollar | Silver | Gold Price ForecastNatural Gas | Oil | Dollar | Silver | Gold Price Forecast
NYMEX:NG1! NYMEX:CL1! COMEX:GC1! COMEX:SI1!

Natural Gas Rip or Dip?Natural Gas has had some choppy price action as of late. There has been no clear directional trend.
I remain bearish until we clear the $3.85 level.
If Natural gas rejects off this level we should test the $3.00
If natural gas gets above this $3.85 level bulls should try to retest the major high pivot.

Natural Gas - Are you buying the dip?Natural gas is going through some distribution and it looks like its going lower.
However there is a very strong base around $3 that can be a good risk to reward buy zone.
Remember this is one of the most volatile asset classes amd can overshoot key levels. Size accordingly and leave yourself maneuverabilty.
Natural Gas | Oil | Dollar | Silver | Gold Price ForecastNatural Gas NYMEX:NG1! | Oil | Dollar | Silver | Gold Price Forecast
OANDA:XAUUSD NYMEX:CL1!

Opening (IRA): UNG March 21st 18/June 20th 35 LPD*... for a 15.04 debit.
Comments: Fading this natural gas move here with a long put diagonal, buying the back month -90 delta put and selling the front month 25. The 35 long put is shown at the 21 strike due to the 35 being off the chart.
Metrics:
Max Profit: 1.96
Buying Power Effect: 15.04
ROC at Max: 13.03%
Break Even: 19.96 relative to 19.68 spot
Will generally look to take profit at 110% of what I put it on for, roll out the short put on approaching worthless.
* -- Long put diagonal.
