Natural Gas Daily About To Break Out Of Falling WedgeThe $NG daily has been doing battle with the 50dsma for 8 months. The falling wedge is about to explode to the upside.
UNG
Natural Gas Needs a Gap UpThe natural gas daily has been unsuccessfully trying to beat the 50dsma for 5 months now. A gap up may be needed to beat the 50 and the falling wedge.

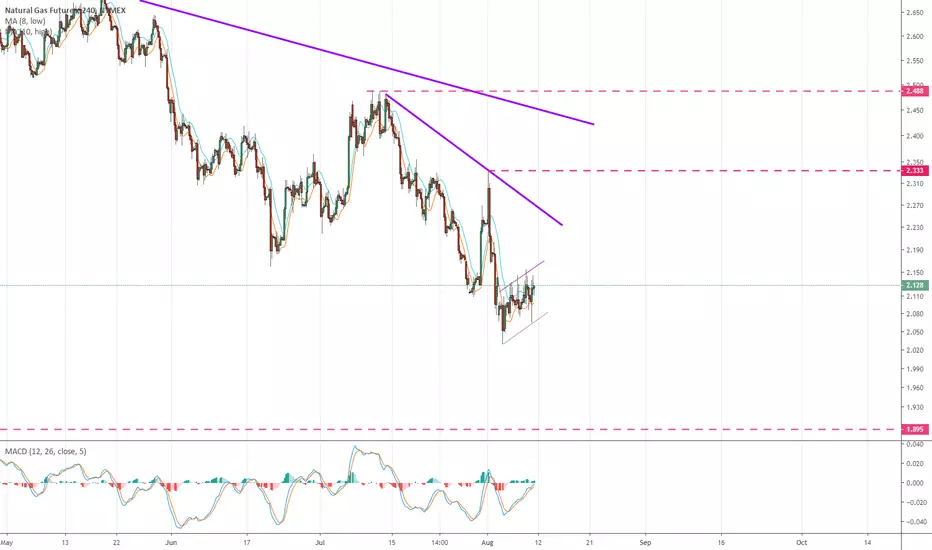
NG no signs of strength yetNG seems to be working a bear flag, I'm still looking for a tradeable bottom, until then I'll be staying on the sidelines until market finds a bottom and show (SOS) sign of strength. 1.9 seems likely at this point, if thats the case NG needs to bottom this month as bullish seasonality starts early Sep
TRADE IDEA: UNG JAN 22/24 LONG CALL VERTICALMetrics:
Max Profit: $164/contract
Max Loss: $36 (assuming mid price fill)
Break Even: 22.36
Delta/Theta: 9.03/-.07
Notes: A seasonality play put on at /NG lows ... . UNG's not my favorite instrument in the world, nor is it the most liquid that far out in time. It's also possible that /NG could trundle lower, since seasonal peak injection generally doesn't occur until later in the year on average.
The pictured setup prices out at .18 bid/.36 mid/.53 ask and would pay well if we get another Polar Vortex. If we don't, we'll you aren't out much ... .


Trumps Tweets? NAH! Charts. Volatility in the works!Here you can see how the seesaw may unfold. Geometry! Cheers
-Coach Reeves

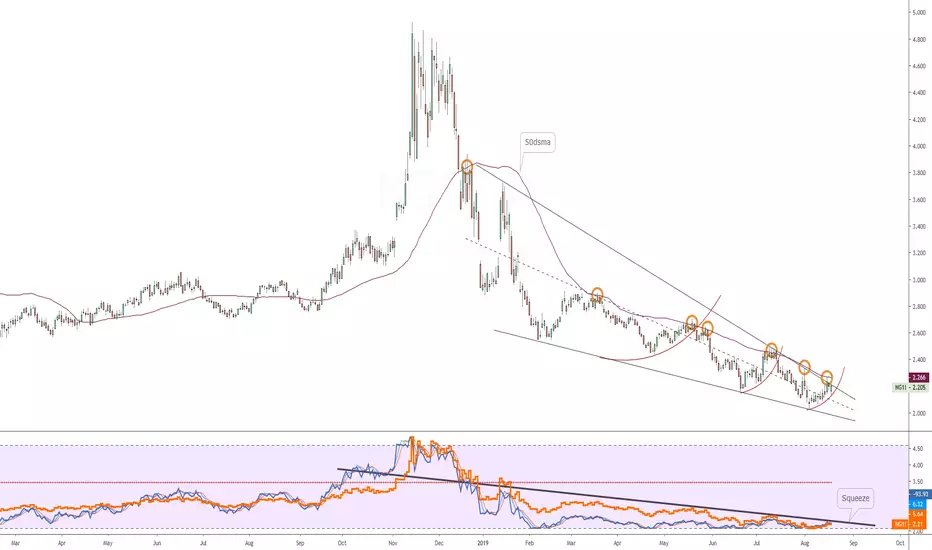
NG bottomed? The strong rally today suggests that NG low of the year might be in, bullish divergence in play, biggest hurdle would be a close above last swing high at 2.488
* seasonally NG bottoms in the last week of July, so looks good timing wise
** Just an idea NOT a forecast

NG more downside?I’m actually looking for a tradable low on NG, but charts suggest more near term weakness, a possible scenario would be up to 2.35 then resume the sell off to possibly 2.05-2.1
** Just an idea NOT a forecast
$UNG at multi-year support. #bullishTaking an entry here. Huge potential as we sit at multi-year support.


Ugaz possible EW counts update 05apr2019 @cryptoKneeTwas not a flat, so WTF! Many things pos IMO, many things say up for now, or a bit more down than up... 2 of an impulse, B on ZZ, X of a combo... that sweet wick on wick action in the a/1 is throwing me a bit...anyway some bull div. A bit up pos..or dumparoo $ugaz $dgaz $ung

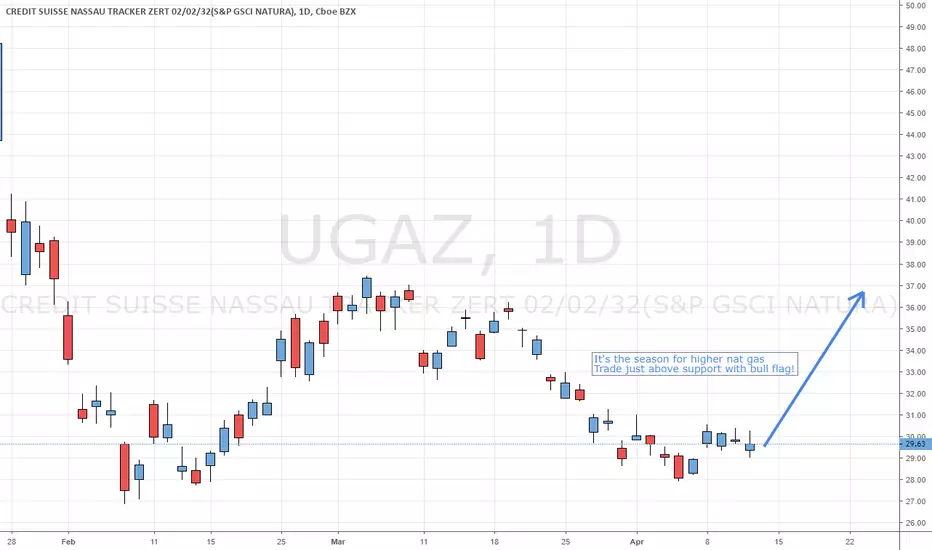
$ung $ugaz $boil $ng_f - Nat Gas has same setup as last FebruarySeasonality wise nat gas should rally towards $3.00 over the next few weeks.
Utilities, Natural Gas, and Small Caps Present Setups!This video shows a few simple and clear trade setups unfolding in the market for three very different sectors.
Take a look, and if you like be sure to follow me here on TradingView!

$ung $ugaz $boil - Nat gas setting up for yet another rallyRecently, we warned that Natural Gas may set up another opportunity for traders to buy into a support zone below $2.70 with a selling range near or above $3.00. Our upside target zone is between $3.25 and $3.45. The price of Natural Gas has recently fallen below $2.69 and we believe this could be the start of a setup for skilled traders to identify key buying opportunity in preparation for a quick +8% to +15% upside swing.
Historically, March and April have been pretty solid months for Natural Gas. Let’s go over the historical data using three different seasonality charts which all point to higher prices.
Taking a look at the data, above for both March and April it appears we should have a positive price outcome over the next 20+ trading sessions. Thus, we can determine that the likelihood of a positive price swing between now and the end of April is highly likely.
When we take a look at the chart data to see how our BUY and SELL zones are setting up, it becomes clear that any opportunity to BUY into the lower support channel, with a moderate degree of risk, could result in a very nice profit potential of between $0.35 to $0.70 on data that supports the Bullish potential as a 200%~220% advantage over downside potential.
Take a look at the data that we are presenting and try to understand that these types of historical price triggers are not foolproof, yet they do provide a clear advantage. They allow us to see if and when there is any type of advantage to our decision making and if we can identify any real opportunity for future success. We believe any further downside price activity in Natural Gas will result in additional opportunities for Long trades with $2.45 being our absolute low entry target. Our upside exit target would be any level above $2.95, or higher, and our ultimate target objective would be $3.15 or higher. Our last trade in natural gas (UGAZ) gave us 30% return in just two weeks in February!
This could be another opportunity for a trader to target a quick 8% to 15% swing trade in Natural Gas over the next 20+ days. Time to put Natural Gas on your radar again!
Are you ready for this next move? Want to know how we can help you find and execute better trades? Visit www.TheTechnicalTraders.com to get our, technical indicators, market analysis, daily videos and trade alerts.
Chris Vermeulen
Technical Traders Ltd.

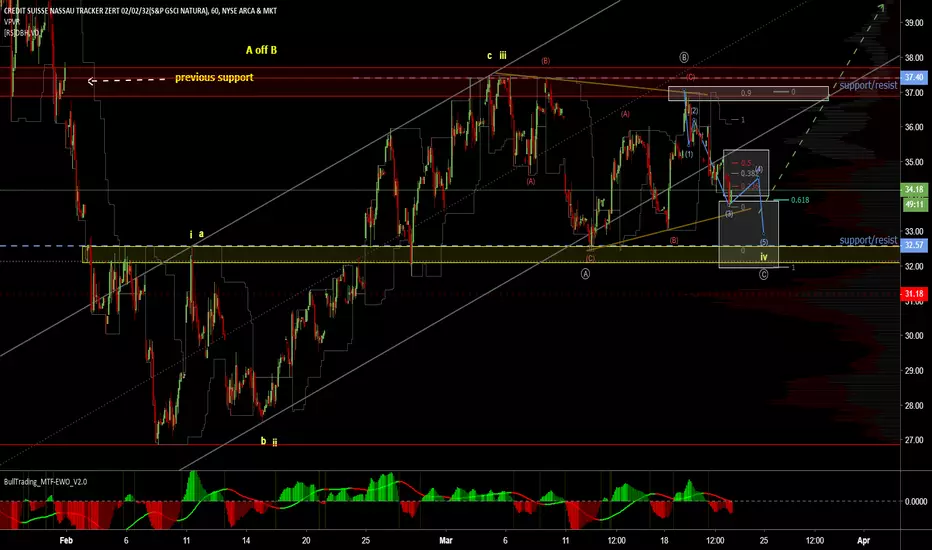
ugaz update 21mar2019 @CryptoKnee Last update Ugaz bounced off support all the way back near resistance...maybe again? It bounced to .9 of the previous swing, so im leaning flat and now it is on the 4 of the C potentially. Then Bang, Zoom, to the Moon!...potentially. The main channel has been broken and played off of, which can happen in a 4. If we break into the wave 1 territory at the orthodox end of this "4", may have to recount.
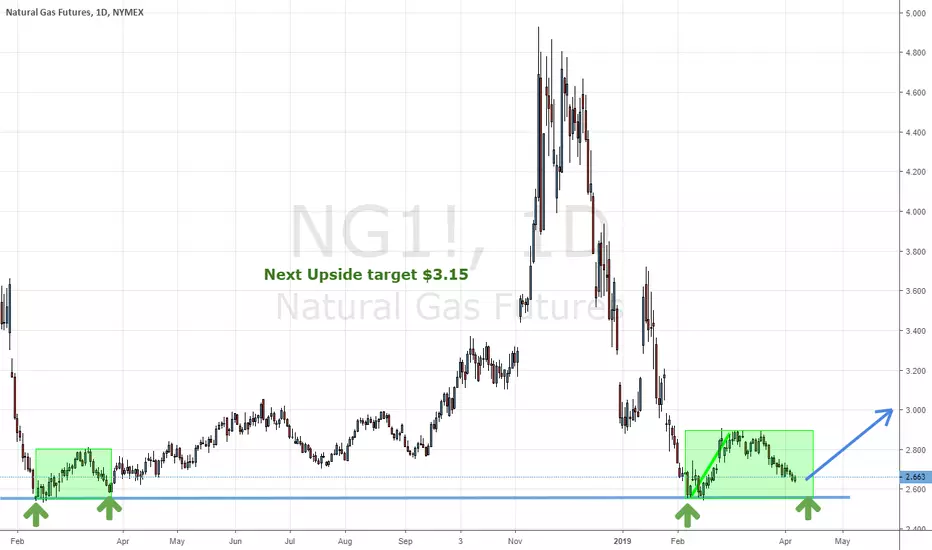
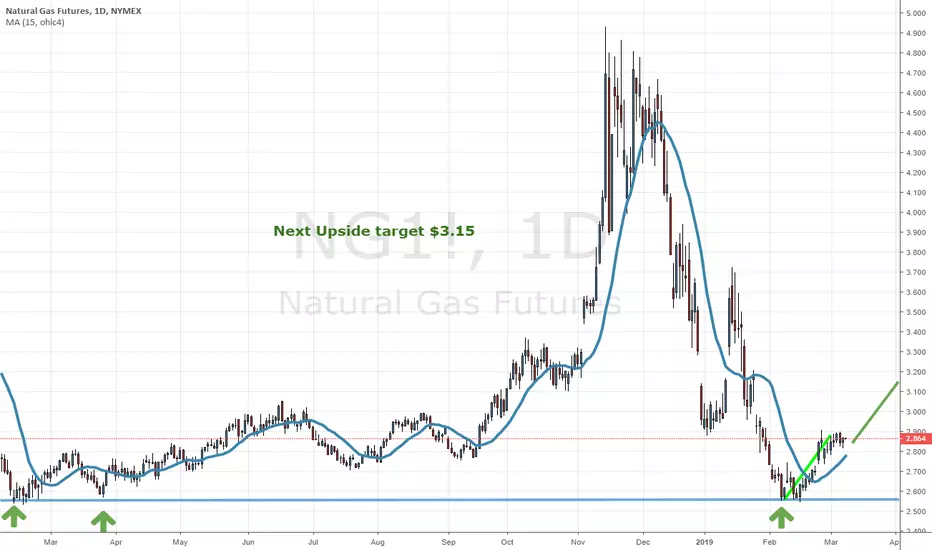
Next Upside target $3.15It's basic but seasonality, trend, and resistance all line up for this move. I do expect/want a pullback to $2.70 first.
More details here about the trade setup.
Falling Price Into Critical Support = Opportunity/BounceThese plays happen all the time if you are looking for them. The weekly charts provide amazing opportunities, the key is to find these standout support or resistance areas and wait for the price to fall fast and hard to them, or spike in price into resistance. The FIRST time price tags the level you should be entering a trade for at MINIMUM an intraday reversal, but with the weekly chart, setup expects a couple of weeks for the swing trade to play out.
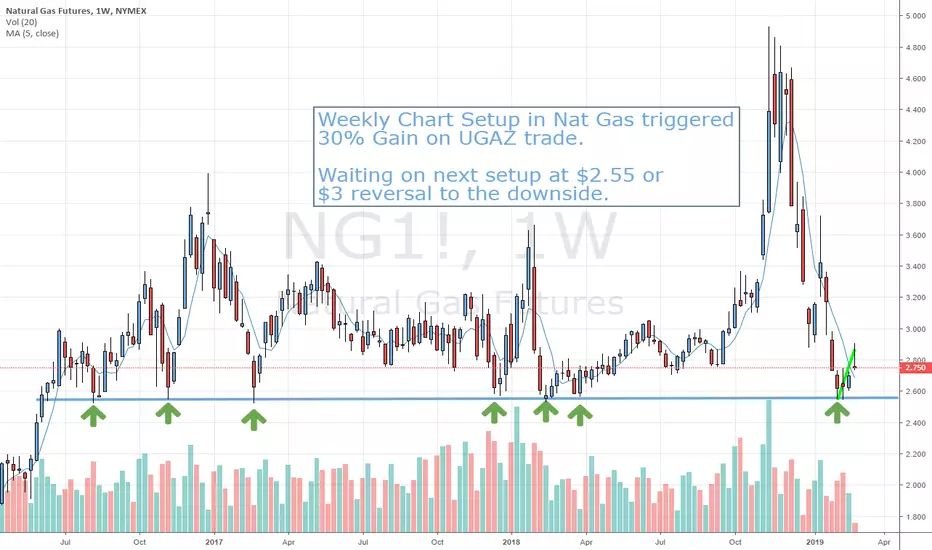
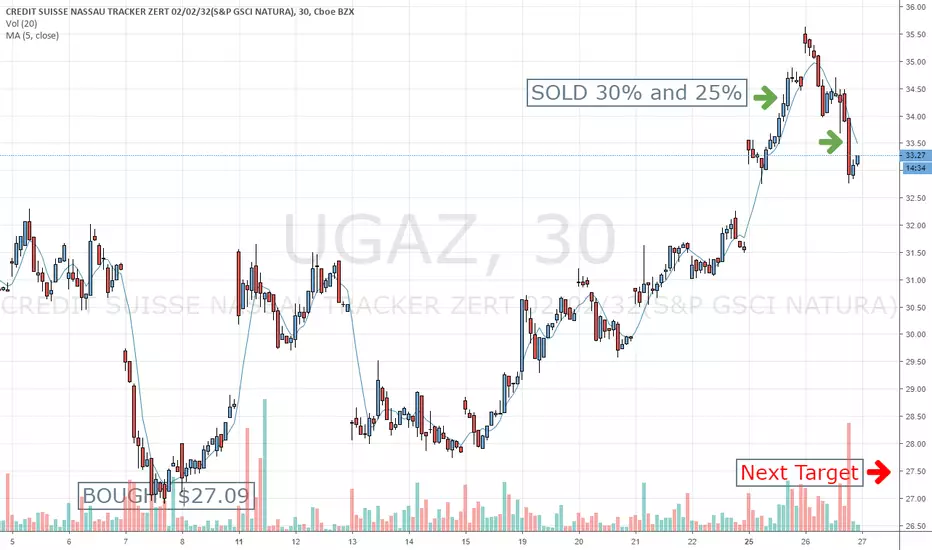
Natural Gas 2Yr Technical Setup Plays Out Again!Just take a look at the natural gas continuous futures contract WEEKLY chart , $2.55 level and draw a line, its a clear trade setup that just pocketed 25% and 30% this week!
This is the UGAZ chart 3x bull that allows us to trade the quick powerful moves in Natural Gas knowns at the Widow Maker... LOL
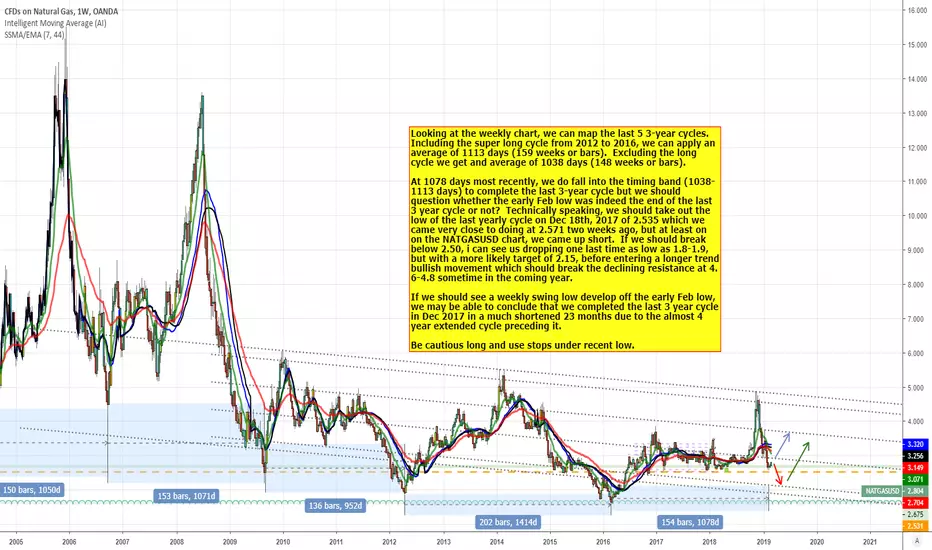
NATTY, is the decline over OR is one more drop imminent?read the box on the chart and see if you concur? I'd be interested to know whether people are moving more toward the bullish camp right now or not?