Nat Gas... Another Day Up... To Peak Feb 29th 2019Went long on Nat Gas (UNG - bought calls) - should go up and peak Feb 28th-ish 2019 per my hourly model.
brschultz aka markettimer777
UNG
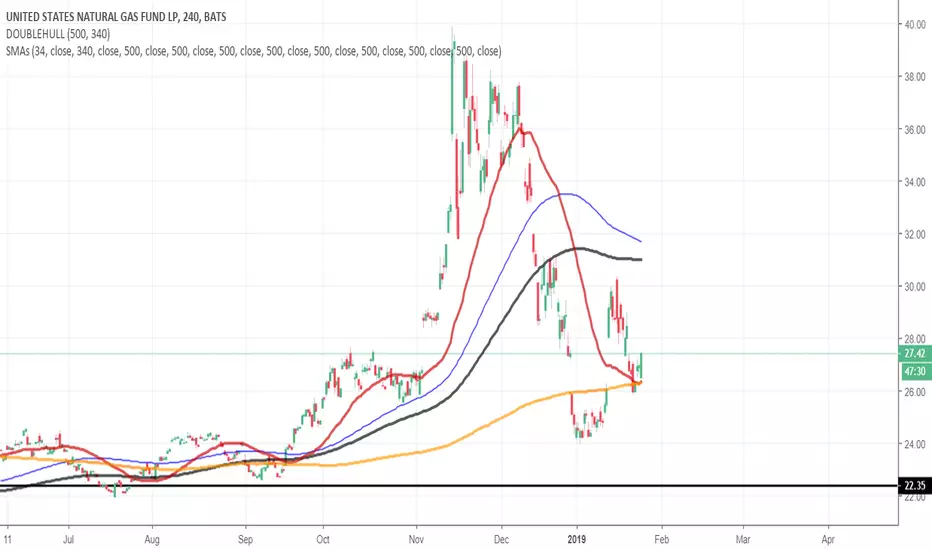
Natural Gas | Bought Calls Jan23 - Plan Exit Feb 28 ~ brschultzAs some of you know i bought nat gas UNG at end of Day Jan 23rd based on my own hourly models.
My models suggest a peak in natural gas or optimal sell date on Feb 28 2019
brschultz aka "markettimer777"

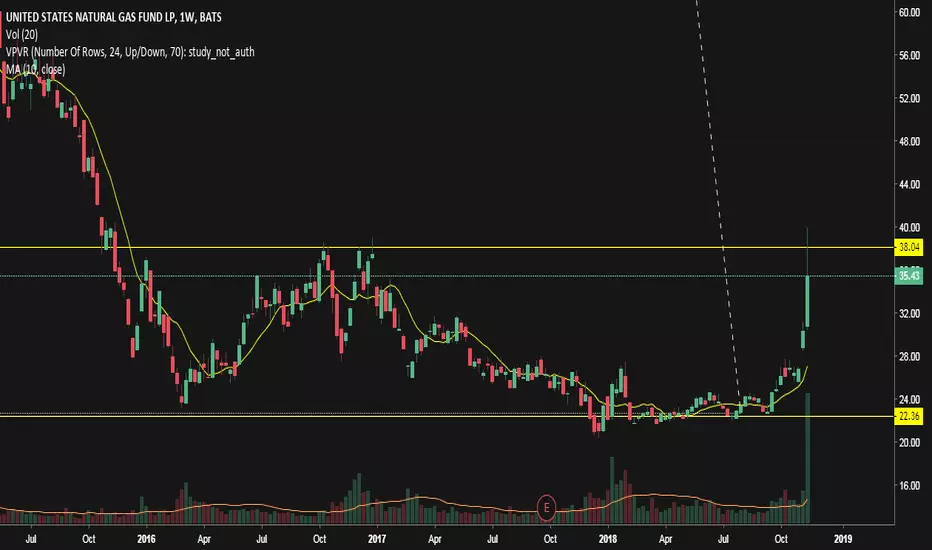
$UNGNat Gas just Steam Rolled peeps. Just posting this because that spike put Hedge funds out of business. Watching these funds to add to my portfolio with Energy being so low.
UNG - Bullish-neutral Iron CondorThe major activity in natural gas, especially over the past 2 weeks presented an opportunity to make a bullish-neutral bet.
31/32/42/43 JAN19 IRON CONDOR @ 0.73 CREDIT
General plan:
Roll if necessary & if possible to reduce risk.
Target maximum profit, unless significant profit appears early.
Comment or direct message for discussion, or on other interesting ideas!
Follow for updates.

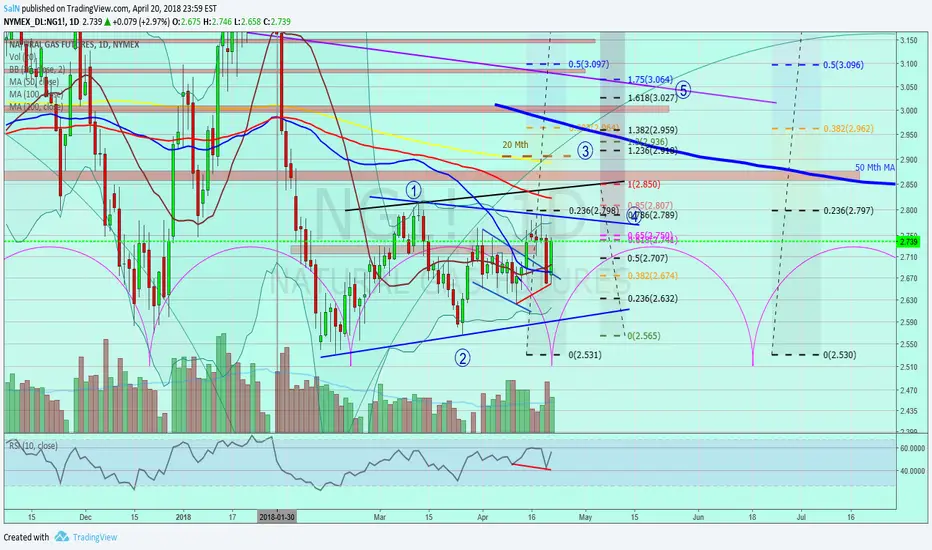
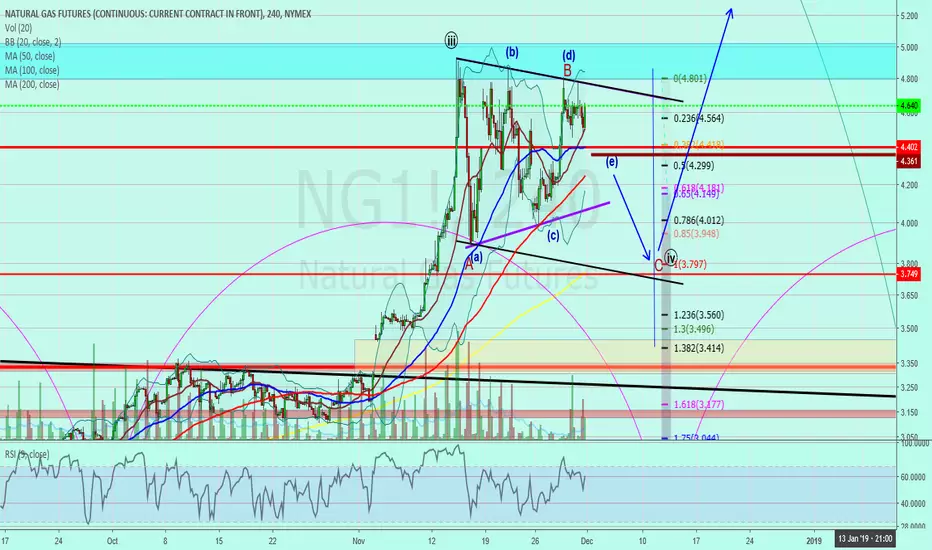
Natural GasNatural Gas Daily
I am watching for two potential patterns. The first (and the one I am not leaning in favor of) is a triangle pattern. If that is the case then we should break out next week. However, I am more inclined to believe that we are starting a drop into a minor C wave down to complete the flag pattern by mid December. Then one last strong push up to complete the larger B wave that Ill show below on the weekly chart. Not to mention that we are very over bought and I believe that the indicators need to settle down a bit before such a strong push higher.
GL on your trading decisions. I hope this helps.
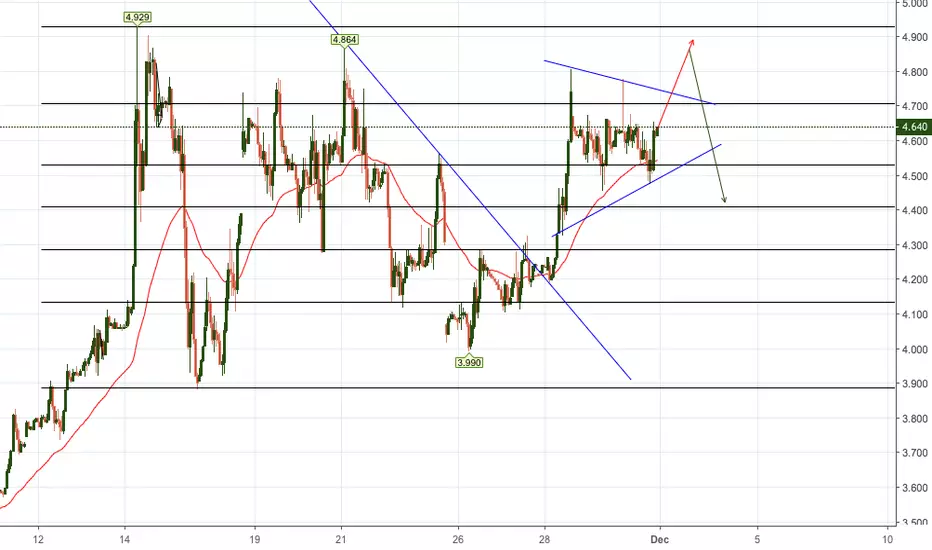
Natural GAS - Continuation Breakout - UNG UNG after incredible run has spent this past month in a very tight consolidation. the range started of wide but now has been getting tighter and tighter over the course of the last week. There are very few spots of momentum in this market right now.
Things I like about UNG right now.
Its seasonal
Volume Accumulation
One of the last spots of momentum in the markets

THE WEEK AHEAD: ADBE, COST EARNINGS; OIH, XOP, UNG DIRECTIONALSPersonally, I'm not doing a ton here beyond looking at cleaning up remaining December cycle setups and evaluating whether there are poo piles that should be looked at for the taking of tax loss in the margin account before year's end. Nevertheless, here's an outline of what's potentially playable in the coming week ... .
ADBE (81/49) announces earnings on Thursday the 13th after market close. The 20-delta, January 18th 210/270 short strangle is paying a whopping 8.05/contract at the mid price, with the 25-delta January 18th 215/220/265/270 paying greater than one-third the width of the wings at a mid price of 2.13. Markets are showing quite wide at the moment, particularly in the defined risk setup, however, so it may prove unattractive at New York open from a liquidity standpoint.
COST (76/31) also announces on Thursday after market close, but the background implied isn't generally what I'm looking for in an earnings-related volatility contraction play (generally, >50% is where I draw my "picky line").
On the exchange-traded fund front, petro leads the pack, with OIH rank/implied metrics coming in at 95/47, XOP at 79/44, and UNG at 72/86. With OPEC reaching an agreement late last week as to production cuts, I lean toward bullish assumption setups with time to work out/reduce cost basis, since it will take awhile for any cuts to appear in the pipeline. For example: an XOP June/Feb 25/34 upward call diagonal,* 6.55 debit/contract, break even at 31.55 versus 31.54 spot, max profit on setup of 2.45, 72.8% debit paid/spread width ratio. I'm already in a similar OIH bullish assumption setup, which is proving to be a "pulled the trigger" too soon type of thing. The back month in the OIH setup is in April, so I've still got time to reduce cost basis and for the trade to work out in some fashion, even though it's a bit of a rough sled here.
With UNG in particular, I continue to look at a bearish assumption seasonality play, but markets on any given setup have been ugly wide, no matter what type of setup I seem to look at, and lack of liquidity is not your friend when doing an options setup.
For broad market premium sellers: SPY (47/30), IWM (78/25), QQQ (69/27).
* -- Buy the June 25, sell the February 34.

THE WEEK AHEAD: XOP, OIH, USO, XLE, UNG, EEMEarnings With >70 Rank/>50 Implied:
No underlyings with highly liquid options with earnings announcements in the next week. With single names with earnings announcements in the rear view mirror, we're looking at earnings starting up again in the January cycle; I'd rather just play those closer to the announcement, rather than get caught up in a volatility expansion (e.g., CAT (84/40) with earnings in 53 vs. January opex 47 days until expiration).
Exchange-Traded Funds With >50 Rank/>35 Implied
XOP (81/44)
OIH (81/43)
USO (81/57)
XLE (75/27)
UNG (75/88)
Notes: As you can see by the pictured setup, XOP is at the bottom of its 52-week range. With OPEC talks right around the corner (and likely jawboning to ensue), I'm slightly enamored with a bullish assumption setup here as compared to a nondirectional premium selling play, even though there's premium to be had (the Jan 18th 29/37 short strangle's paying 1.09 with a 70% probability of profit). Last week, I entered into a similar setup in OIH, (See Post Below), since it's gotten the sledge hammer to a greater degree than the rest of the petro-sensitive exchange traded funds.
In any event, here are the metrics for the pictured play: Max Loss on Setup/Buying Power Effect: 4.02 debit/contract; Max Profit on Setup: 1.98/contract; Break Even on Setup: 33.02 vs. for a 6-wide, BE at 33.02 vs. 32.81 spot; Debit Paid/Spread Width Ratio: 67%. Look to roll the short call aspect out on significant loss of value (usually 50% max) and to take profit at 50% max (.99/$99 per contract).
UNG has been pesky. I've looked at getting into a bearish assumption, seasonality-related short setup, but every time I look, the markets are stupid-wide, making it unattractive from an entry/exit perspective. Given its high rank/implied, however, it might be amenable to a bearishly skewed oppositional setup if you're willing to do a bit of price discovery and not settle for sub-mid price nonsense: the Jan 18th 27/46 short strangle is paying 2.92 at the mid with a net delta metric of =25.44 and break evens at 24.08 and 48.92, which covers a fairly huge swath of the 52-week range. If you're willing to spend a little more time in the trade, the April 18th 26/46 pays 4.91 at the mid, is =29.44 delta, and has break evens of 21.09 and 50.91, although I could see the reluctance to hang yourself out there undefined given the movement it's experienced over the last several weeks.
Broad Market Exchange-Traded Funds Ranked By 30-Day Implied
EEM 26
QQQ 24
IWM 20
SPY 18
EFA 18
Notes: The EEM Jan 18th 41 short straddle is paying 2.69; the ~30 delta, 39/43 short strangle pays 1.15. I've been working it via double diagonal with a short straddle body, just so I don't have to leg into and out of the long strangle aspect and to budget buying power devoted to the trade. (See Post Below).

UNG ShortUNG has made significant move up over the past few days and is currently overbought. Im getting short right here at $36.40 1/2 position, I will be adding second half at $38.25 if we get there.

Natural Gas - Out of Gas?Blow off top marks the high for me. This chart is performing very technically as the B wave went right to the .886 fib today to trap as many bulls as possible. If we don't get higher above 4.77 again, I expect a rather long bleed out to the main trendline or support, whichever comes first.
You can buy DGAZ if you want to trade against it but beware as it is a 3x inverse ETF so please set appropriate stops. This could also be a Wave 3 which means after some consolidation/pullback we may see an even higher Wave 5 past 5 dollars. Please be careful in this market.
Good Luck!

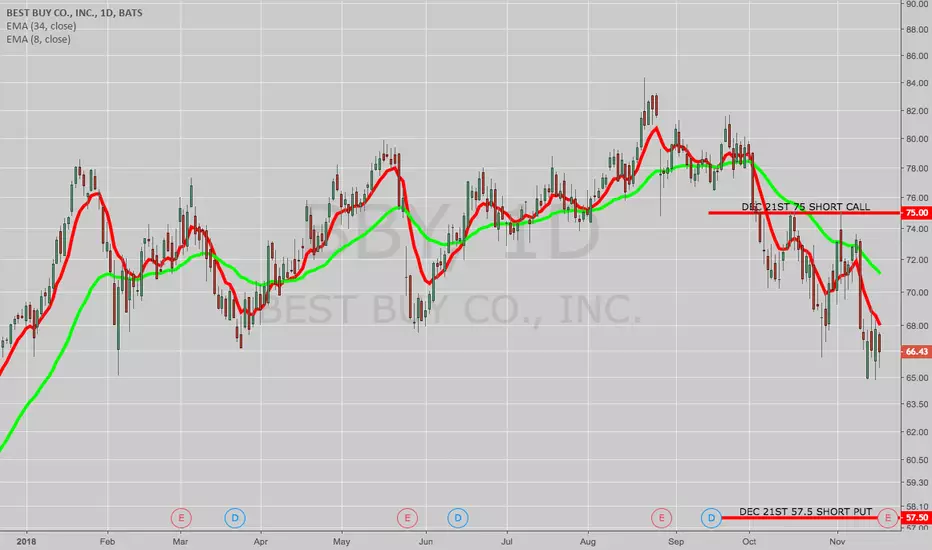
THE WEEK AHEAD: BBY, DE, GPS, LOW EARNINGS; UNG, XOP, NFLXIn spite of the shortened trading week due to the Thanksgiving holiday, there are balls to hit out there ... .
Earnings:
BBY (95/57) (announcing Tuesday before market open): The December 21st 57.5/75 short strangle shown here is paying 2.42 with break evens near the one standard deviation line. I tried pricing out a defined risk iron condor, but it looks like some strikes need to populate post-November opex in order for me to price a setup where I'd want to set up my tent (i.e., short strikes between the 20 and 30 deltas, longs 3-5 strikes out with the setup paying at least one-third the width of the wings).
LOW (78/40) (announcing Tuesday before market open): As with the DE play, I'm able to price out a short strangle -- the 80% probability of profit December 21st 80/105 pays 1.35, but not an iron condor due to the population of strikes around where I'd like to set up. I'll just have to wait until NY open to price a defined risk setup.
GPS (87/54) (announcing Tuesday after market close): To me, it's small enough to short straddle, with the December 21st 26 short straddle paying 3.17, but I could also see going with the 23/29 (paying 1.05) to give yourself a little more flexibility with defense if you're not a fan of defending the straddle via inversion (which is generally what you have to do with a short straddle where the move is greater than the expected). Alternatively, the December 21st 21/26/26/31 iron fly pays 2.71 with a buying power effect of 2.29, which are the metrics I'm looking for out of an iron fly (risk one to make one or better; credit received at least one-fourth the number of strikes between the longs).
DE (81/48) (announcing Wednesday before market open): The December 21st 135/160 is paying 4.53 with near one standard deviation break evens; the 130/135/160/165 iron condor in the same expiry pays 1.75.
Non-Earnings Single Name:
NFLX (69/54) still has some juice in it post-earnings. The December 21st 240/245/325/330 is paying 1.56 -- not quite one-third the width, but you're only working with 33 days until expiry.
Exchange-Traded Funds:
The top symbols: SLV (100/24), UNG (100/97), EEM (63/27), OIH (77/41), and XOP (77/42). Unless you've been living under a rock, UNG, OIH, and XOP "friskiness" are understandable here, with oil prices taking a header from more than $75/bbl. to a low $20 below that since the beginning of October. Conversely, a fire got lit under natty's ass due to seasonally early weather-related pressure, shooting up from a less than a 3.50 print at the start of November to 4.93 mid-month. It's eased back to 4.39 since then, but yeesh ... . Were it not natural gas, I'd be inclined to sell premium in UNG given the rank/implied metrics, but I'm patiently waiting for my standard seasonality play -- a downward put diagonal with the front month in Jan, the back month mid year. Since we're only in November with plenty of winter in front of us, I'm satisfied with waiting on more potential upside before pulling the trigger on that setup.
With XOP and related products, I've been selling nondirectional premium, although I could see potentially skewing things bullishly, adding some petro underlying long delta to existing setups, or just taking an outright bullish assumption shot (e.g., /CL short puts, XOP/OIH/XLE short puts, upward call diagonals, etc.), since oil has been totally crushed here.
Majors:
SPY (31/21); QQQ (53/25); IWM (54/23); DIA (37/19). Temporarily, it looks like QQQ is where the broad market premium is at, followed by IWM.
Natgas short?It looks like natgas is diverging from WTI crude. As well, on a monthly chart the RSI is hitting the same level as previous pullbacks. Would not chase natgas higher and would wait for a second candle to hit the trendline then short using DGAZ.
Thoughts?

Natty to 4.20Directional Bias: Long
Price Target:4.20
Good Entry:3.61-3.66
Risk/Reward: Max Risk of 50 points/Potential Reward of 500-600 points
Closing below 3.55 hourly candles invalidates.
Long that Natty ZoneDirectional Bias: Long
Price Target: 3.3+
Good Entry: 3.065-3.115
Risk/Reward: Max of 40 tick risk / Potential Reward of 200 ticks.

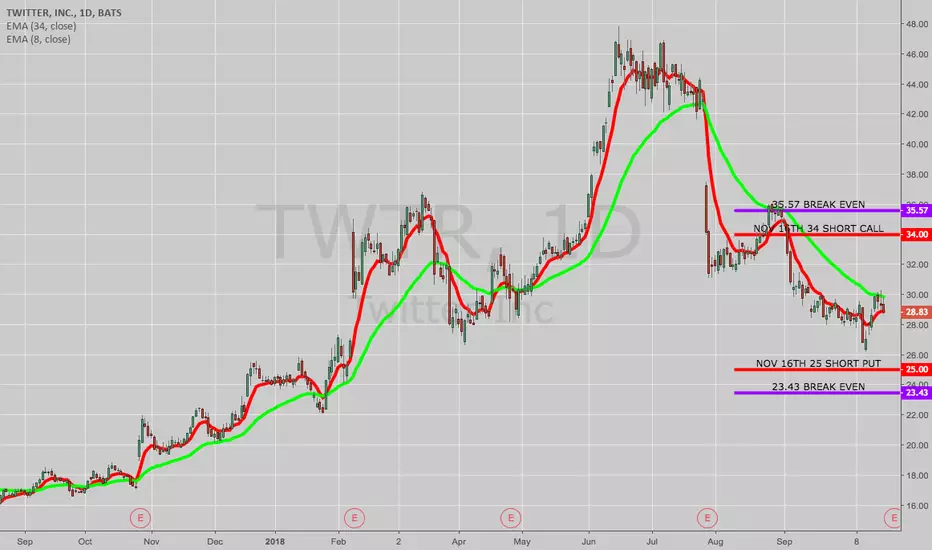
THE WEEK AHEAD: TWTR EARNINGS; USO, EEM, IWM, UNG, XOPTWTR announces earnings on Thursday before market open, and with a rank of 92 and a 30-day implied of 70, it presents ideal metrics for a earnings announcement volatility contraction play.
As of Friday close, the November 16th 25/34 short strangle is paying 1.57 (.79 profit at 50% max), with a net delta of .39 and a theta of 6.45, and break evens of 23.43/35.57 (wide of the expected move).
For those willing to bet a little more strongly on its not moving much more than the expected move: the November 16th 29 short straddle is paying 4.47 (1.12 profit at 25% max), with break evens of 24.26/33.74.
On the exchange-traded fund front: USO (73/30), EEM (67/25), and IWM (66/22) round out the top three underlyings when sorted by rank. UNG (42/41); EWZ (56/38); and XOP (53/32) are the top three when sorted by 30-day implied.
Possible Trades:
A USO December 21st 14.5/15 skinny short strangle* is paying 1.10 at the mid price with break evens of 13.40/16.10. Given the fact that this is basically a short straddle setup where I would shoot for 25% max, 1.10 isn't exactly compelling on a 1-contract basis (.28 at 25% max), but its small size makes it ideal for layering on setups over time in order to generate a worthwhile, multiple contract position that has some juice in it.
An EEM, December 21st 39/40 skinny short strangle is paying 2.68 at the mid price with break evens of 36.32/42.68. Go 25-delta short strangle -- the 37/42, and you bring in 1.24 in credit with 35.76/43.23 break evens. For defined risk, there's the double diagonal, (See Post Below). The December 21st 35/37/41/43 iron condor pays .70; going three-wide won't pay at least one-third unless you bring in the wings to a 35/38/41/44, which is paying 1.33.
An IWM December 21st, 16 delta, 139/165 short strangle is paying 2.43 with break evens of 136.57/167.43, which encompasses much of the last 52 week's range between 142.50 and 173.39. A delta neutral 141/145/162/165 iron condor pays 1.40; the slightly narrower 142/145/162/164 pays 1.05.
With UNG, I've had my eye on a short setup, (See Post Below), but don't want to pull the trigger too early. We're winding into winter, after all, which generally means increased natural gas usage and draw downs of current supplies. That being said, the notion behind the setup is that even if my timing is slightly off, a setup with a long-dated back month will eventually benefit as we emerge from winter, so I'm looking at putting the back month out in time and in an expiry when seasonality favors natty weakness. Unfortunately, the only available post-winter expiry is April, and I'd rather have an early to mid summer back month, so I'm fine with being patient here.
XOP has been double whammered with broad market weakness on top of oil weakness and is now at the bottom of the range between 40 and 45.50 it's been in since mid-April and a bit above the middle of its 52-week range between 31 and 45.50 with the low set in the early February sell-off. To me, that suggests "directionally neutral": the December 21st 40 short straddle pays 4.16 with break evens at 35.84 and 44.16; the 36/44 short strangle in the same expiry pays 1.40 with break evens at 34.60/45.40.
* -- The reason I would go with a skinny short strangle here instead of a short straddle is because price was 14.72 as of Friday close, which is in between the 14.5 and 15 strikes.
TRADE IDEA: UNG JAN/APRIL 23/32 PUT DIAGONALMetrics:
Max Profit on Setup: 3.00
Max Loss/Buying Power Effect on Setup: 6.00
Break Even: 26 versus 26.06 spot
Debit Paid to Spread Width Ratio: 67%
Delta: -48.42 (bearish assumption)
Theta: .28
Notes: In an ideal world, there would be a December expiry currently available for the front month leg (there will be one after October drops off) and a price in the 28 area to put this on, but I wanted to get a preliminary idea of whether it would pay and what the metrics were, with the focus being on the debit paid/spread width ratio (<75% is bueno). I'll look at pulling the trigger on this if price gets back to 28, adjusting the strikes if necessary to accommodate ... .

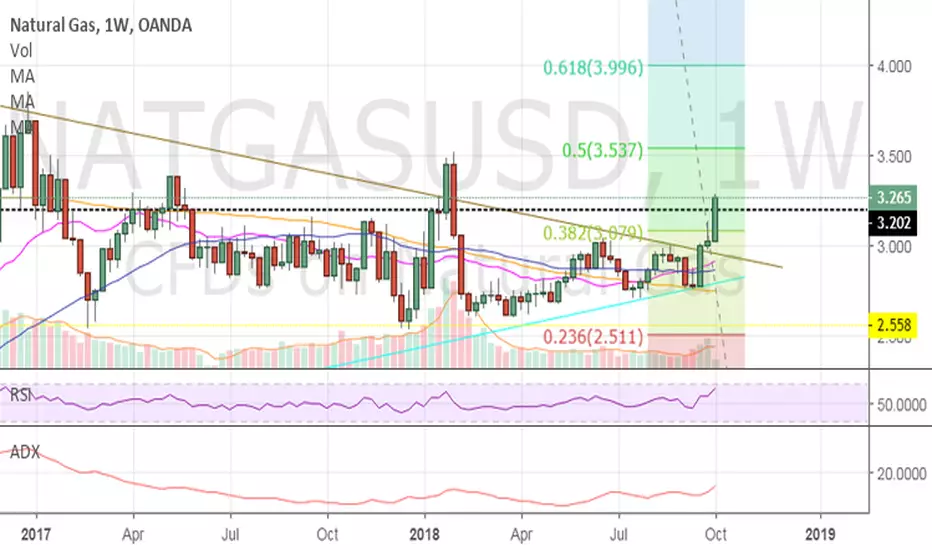
Nat Gas - Daily RSI overbought, Weekly has some room to runNat Gas - Daily RSI overbought, Weekly has some room to run. Fib levels - .382 support = $3.08, Fib .5 resistance = $3.53. EIA nat gas report thursday should determine NG direction. $HNU 2x ETF for canadians or $ugaz 3x ETF for USA
F/U on Natural Gas My last posting suggested natural gas may turn up and it has ( see link below from 2.12). It’s corrected some the last few days. Is the up trend now over? I favor it is not. I remain long. If get bullish action I will add to my position. Notice positive reversal in 4 hour RSI.
If you go long could use a close <than the 4 hour up trend line as a stop. Process your way. Feedback welcome.

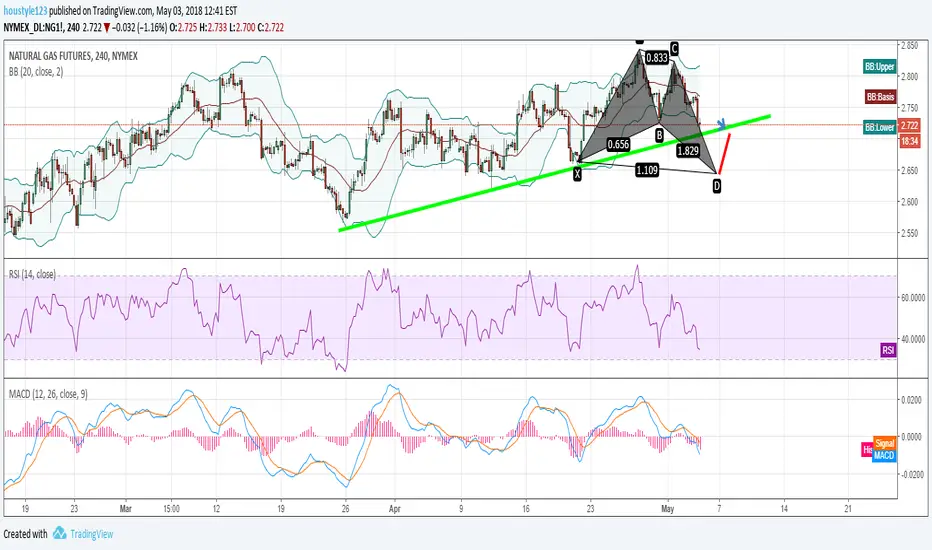
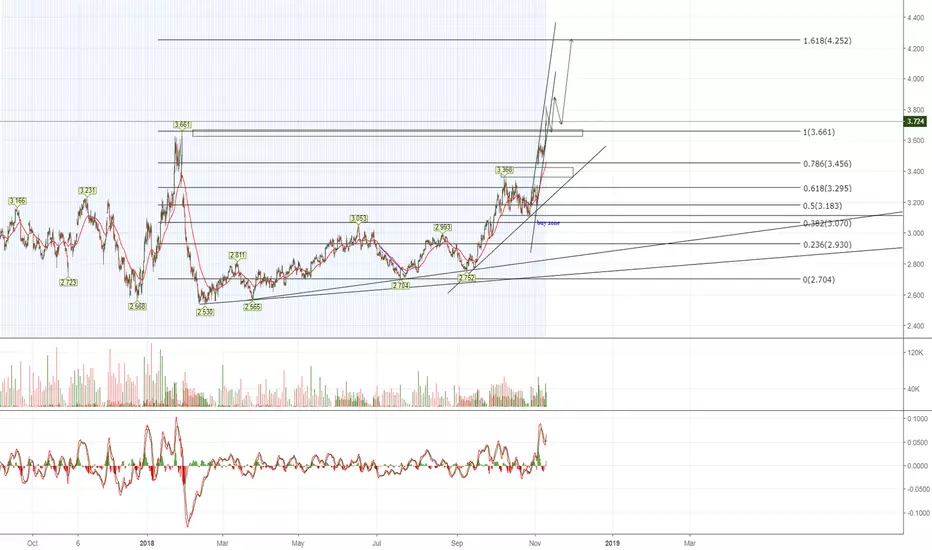
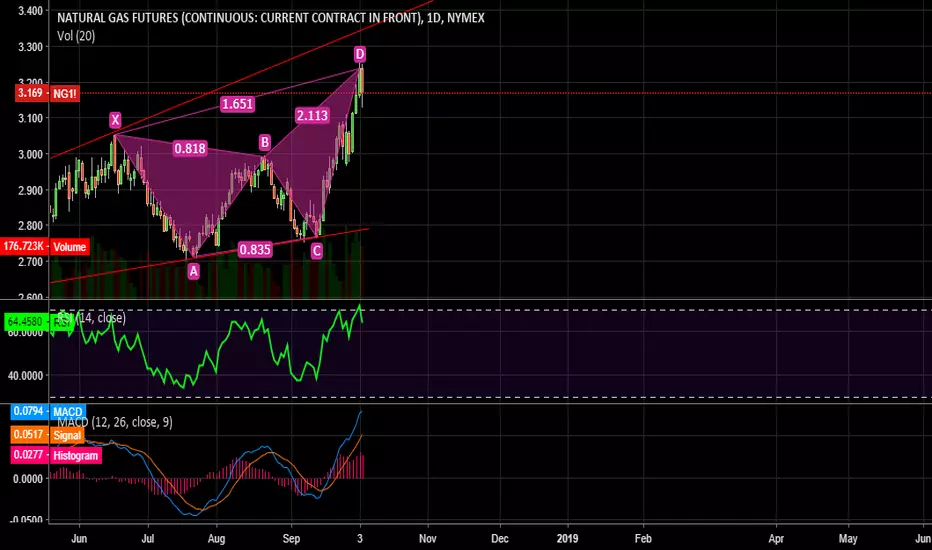
natural gasI have been trading these larger swing over the last few weeks and have been pretty accurate. Todays reversal was a happy site. But this pattern is anything but simple. I don't think we are in a typical short term, ABC due to the pattern. And there was a bullish divergence that appears to be starting to play out. The BBands on the daily are very very tight. Big move coming!
And this monthly chart below is showing a very large bullish divergence. From this long term view...this looking like a typical B wave pattern that we are working through. I really feel that we are close to making a move. With the BBands showing that we are about to make a very big move...I am biased with a move up to break out of this flag and complete the B wave.
GL