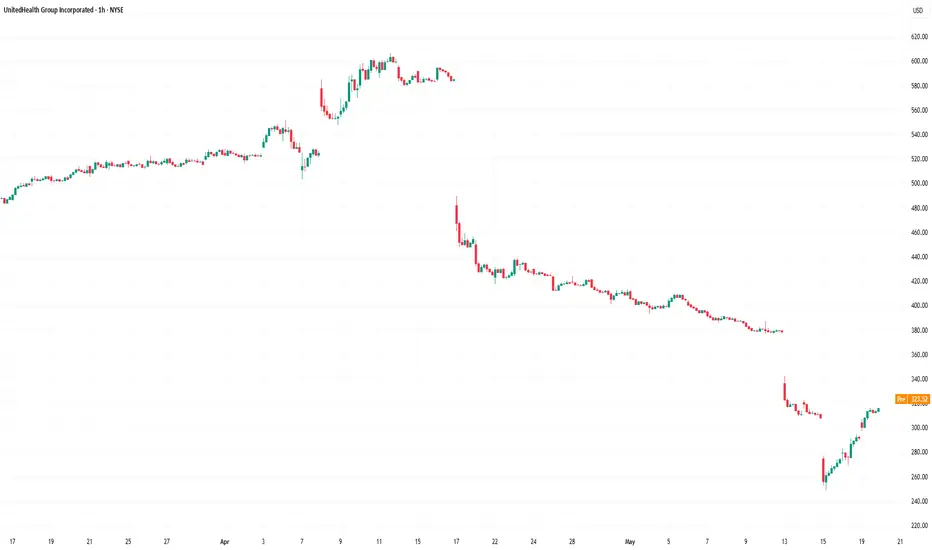
Waiting for $243 United HealthUNH has obviously taken a beating. It's managed to get so close to support many a few times now, yet hasn't hit yet. So if $243 does hit, then plan on targeting $410.
Good luck!
UNH
$90 in next 6-12 months?I am buying this dip and expected it to hit 90 in 6-12 months based on tech analysis. All the best. Not a financial advise.

$UNH BEARISH SETUP – WEEK OF AUG 1
🔻 **\ NYSE:UNH BEARISH SETUP – WEEK OF AUG 1** 🔻
**UnitedHealth Group (UNH)** is showing classic breakdown signs. Here’s what the data says:
📉 **RSI Breakdown**
• Daily RSI: **20.6**
• Weekly RSI: **19.3**
→ Deeply oversold + no bounce = 🚨 momentum flush risk
📊 **Volume Surge**
• Weekly Volume: **145M** (1.9x avg)
→ Heavy **institutional selling**, NOT dip buying
🧠 **Options Insight**
• Call/Put Ratio: **1.17** = Slight bullish noise
• But... Expiry Gamma is 🚨HIGH = IV Crush incoming
• VIX: **20.7** = Volatility tailwinds intact
💣 **TRADE IDEA (PUT PLAY)**
• Direction: **BUY PUTS**
• Strike: **\$230**
• Expiry: **08/08/2025**
• Entry: **Monday Open**
• Target Premium: **\$0.10**
• 🎯 PT: \$0.30 | 🛑 SL: \$0.03
• Confidence: **70%**
📌 **Narrative**:
Oversold + High Volume Dump + No support bounce = Perfect storm for continuation dump. This is a high gamma play, time-sensitive, low-cost lotto setup. Risk small. Aim big.
---
💥 **Watchlist Tag**: ` NYSE:UNH AMEX:SPY AMEX:XLV `
🧠 **Strategy Tag**: #OversoldFlush #PutPlay #0DTETrap
🚀 Follow for more weekly earnings & options breakdowns!

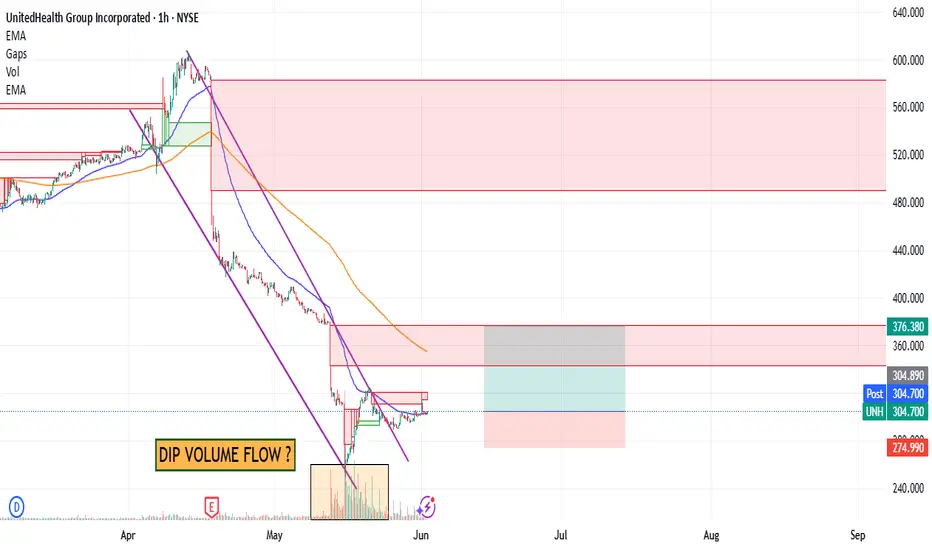
UNH : Are Bad Days Over ? (Cautious)UNH shares have moved above the 50-period moving average but are trading below the 200-period moving average.
For now, since the 200-period moving average is very high, a small trade can be tried by keeping the stop-loss level a little tight.
A few weak movements may pull the average down and the price may break the average.
Therefore, small position sizes are ideal.
NOTE : If we can maintain persistence on 376(Which will take a few days),
then we will look at the other gaps.
Risk/Reward Ratio : 2.39
Stop-Loss : 274.99
Take- Profit Level : 376.38
Regards.
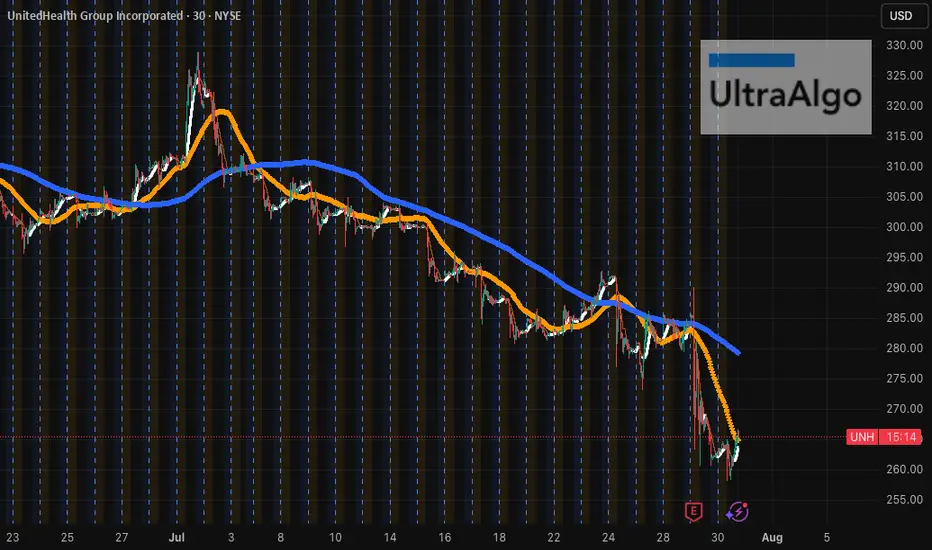
$UNH Fighting Back After Sharp DropCurrently at $265.46, NYSE:UNH is trading below both its 50-period SMA (~$270.00) and 200-period SMA (~$285.00) on the 30-minute chart. The stock found support at $260.00, where it staged a small bounce, but it remains under pressure with clear resistance at $312.29. The trend remains bearish until a stronger reversal emerges. Awaiting UltraBuy signal — charting tomorrow's giants with UltraAlgo.
UnitedHealth (UNH) Shares Plunge Following Earnings ReportUnitedHealth (UNH) Shares Plunge Following Earnings Report
Yesterday, prior to the opening of the main trading session, UnitedHealth released its quarterly results along with forward guidance. As a result, UNH shares dropped by over 7%, signalling deep disappointment among market participants. According to media reports:
→ Earnings per share came in at $4.08, missing analysts’ expectations of $4.48.
→ Revenue guidance was set at $445.5–448 billion, falling short of the anticipated $449.07 billion.
→ Concerns were further fuelled by rising costs and declining profitability, which the company attributed to the continued impact of Medicare funding cuts.
Consequently, the UNH share price dropped to its lowest level of 2025, last seen on 15 May.
Technical Analysis of UNH Stock Chart
In our end-of-May analysis, we updated the descending channel on the UNH stock chart and highlighted that following the recovery from the May low (marked by arrow 1), sellers could regain control. Since then:
→ Throughout June, the share price exhibited signs of supply-demand equilibrium around the psychological $300 level.
→ However, after an unsuccessful rally that formed peak A (which now resembles a bull trap), the balance shifted in favour of the bears. The price began to slide lower along the median line of the descending channel (illustrated by arrow 2).
This pattern was a red flag, particularly against the backdrop of a broadly rising equity market since the beginning of summer. Even if the bulls had hope, yesterday's candle could have completely extinguished it:
→ The session opened with a wide bearish gap.
→ During the day, bulls attempted a recovery, but failed — the candlestick closed at the daily low, leaving a long upper wick, a classic sign of selling pressure.
In this context, we could assume that:
→ Bears may seek to extend their advantage and test the year’s low;
→ The bearish gap area (highlighted in purple), reinforced by the descending channel’s median line, could act as resistance during any potential recovery.
At the same time, the $250 psychological level appears to be a strong support zone. This is backed by the 15 May bullish pin bar formed on record trading volumes — a potential sign of institutional interest in accumulating shares of this healthcare giant in anticipation of a long-term recovery.
This article represents the opinion of the Companies operating under the FXOpen brand only. It is not to be construed as an offer, solicitation, or recommendation with respect to products and services provided by the Companies operating under the FXOpen brand, nor is it to be considered financial advice.

United Health - The perfect time to buy!⛑️United Health ( NYSE:UNH ) finished its massive drop:
🔎Analysis summary:
Over the past couple of months, United Health managed to drop an incredible -60%. This drop however was not unexpected and just the result of a retest of a massive resistance trendline. Considering the confluence of support though, a bullish reversal will emerge quite soon.
📝Levels to watch:
$250
SwingTraderPhil
SwingTrading.Simplified. | Investing.Simplified. | #LONGTERMVISION

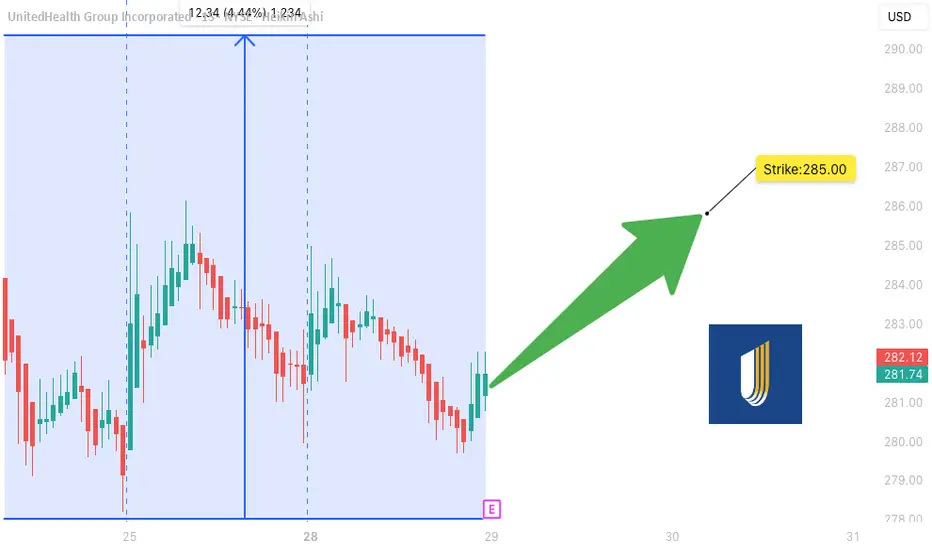
UNH Earnings Lotto Setup** (2025-07-28)
📊 **UNH Earnings Lotto Setup** (2025-07-28)
🎯 **Targeting a 2x return on post-earnings upside move**
---
### 💡 Trade Thesis:
**UnitedHealth (UNH)** is primed for a potential bounce on earnings:
* ✅ **Revenue Growth**: +9.8% YoY
* 🔥 **EPS Beat Rate**: 88% over last 8 quarters
* ⚠️ Margin compression risk from increased utilization
* 🧠 **Analyst Upgrades** trending positive
* 📉 RSI = **30.06** → Oversold territory
---
### 🔎 Options Flow & Technicals
* 🧲 Max Pain: **\$290**
* 🟢 Bullish call OI stacking at **\$285**
* ⚖️ IV Rank: **0.75** → Still has juice
* 🔻 Trading below 20D/50D MAs → Room for reversal
---
### 💰 Trade Setup
```json
{
"Instrument": "UNH",
"Direction": "Call (Long)",
"Strike": "$285",
"Entry Price": "$10.30",
"Profit Target": "$20.60 (2x)",
"Stop Loss": "$5.15 (50%)",
"Size": "1 contract",
"Expiry": "2025-08-01",
"Entry Timing": "Pre-Earnings Close (July 28)",
"Earnings Date": "2025-07-29 BMO",
"Expected Move": "±5%",
"Confidence": "70%"
}
```
---
### ⚖️ Risk/Reward
* Max Risk: 💸 \$1,030
* Max Gain: 🚀 \$1,030
* R/R Ratio: **1:2**
* Lotto-style with tight SL post-ER
---
### 🧭 Execution Plan
* 📅 Buy before close on **July 28**
* ⏰ Close same-day post ER **if target or SL hits**
* ❌ Exit manually if theta crush hits hard
---
### 🗣️ Final Note:
> “Oversold + Strong fundamentals + Positive consensus = Earnings bounce in the making.”
---
📌 Tag your UNH trades
💬 Drop your lotto setups
❤️ Like & repost if you're playing UNH this week!
\#UNH #EarningsPlay #OptionsTrading #TradingView #UNHEarnings #LottoTrade #CallOptions #HealthcareStocks #SwingTrade #RSI #IVRank #MaxPain
My UNH Thesis: Betting on a Healthcare Giant's Come BackThe healthcare sector has been in decline, which creates interesting opportunities. I recently talked about a few pharma plays - Eli Lilly, Novo Nordisk, and Pfizer.
Here's why I'm investing in NYSE:UNH :
UnitedHealth Group (UNH) has tanked ~50% in the past year, but the July 29 (VERY SOON) earnings could flip the script. As a historically dominant player, UNH is now undervalued amid sector weakness, offering massive upside if regulatory fears ease.
Here's my full bull case. 👇 FUNDAMENTAL ANALYSIS
Why the Sell-Off? A Perfect Storm of Bad News
UNH crushed the market for 15 straight years (2009-2023) with positive returns, predictable EPS growth, and 134% gains over the last decade.
But 2024 brought chaos:
Feb: Massive cyber attack caused a one-time EPS hit (non-recurring).
Ongoing: DOJ antitrust probe, criminal fraud investigation, rising Medicare costs, and Optum losses.
April: Disastrous Q1 earnings miss + lowered guidance.
Leadership drama: CEO death.
This erased gains (down 7% over 5 years), amplified by healthcare sector outflows—the biggest since 2020. But is this overblown? Signs point to yes. The markets almost always overreact to bad news.
Bullish Signals: Insiders Betting Big
The tide is turning:
Insider Buying Boom: $32M+ in 2024 (vs. $6.6M in 2019), including new CEO/CFO—highest in 15 years.
Congress Buying: Q2 2024 saw net purchases for the first time in 5 years (vs. historical selling).
DOJ Shift: Probe refocusing on pharmacy benefits (PBM) unit, dropping acquisition/monopoly scrutiny—implies no major findings. Great news!
Sector Tailwinds: Healthcare is one of 3 S&P sectors below historical valuations. Super investors (usually tech-obsessed) are piling in, despite the sector's -10% YTD vs. S&P's +13%.
Plus, UNH's dividend yield is at a record ~3% (vs. 1.5% avg), with 16%+ historical growth and 100%+ free cash flow conversion. Rare combo of yield + growth!
Valuation: Screaming Buy?
UNH trades at PE ~11.9 (vs. 10-year avg 23)—a steal.
Analysts project 16.7% EPS CAGR through 2029.
Conservative Scenario: 16.5% EPS growth + PE to 16.5 = $780/share by 2030 (173% total return, 18% CAGR ex-dividends).
Optimistic: PE back to 23 = $1,084/share (280% return).
Models confirm:
DCF (8% FCF growth): ~$484/share (70% upside).
DDM (7% div growth): ~$607/share (112% upside).
Blended Fair Value: ~$545/share (75-90% upside from ~$300). Buy below $436 for 20% safety margin.
Still, there is fear of DOJ uncertainty—investors hate unpredictability and that's why the stock is so low.
Key Catalyst: July 29 Earnings
This could be UNH's "most important report ever." Watch for:
Regulatory/legal updates (DOJ progress).
Full-year guidance revisions.
Metrics like medical loss ratio and PBM performance.
Positive news = potential rocket 🚀. Expectations are low (20 bearish EPS revisions vs. 0 bullish), so a beat could spark volatility... upward.
Risks: Not Without Bumps
Regulatory escalation (e.g., PBM issues) could tank it further.
Short-term headwinds: Medicare costs, sector selling.
Mitigants: DOJ de-risking, strong FCF buffer, insider confidence. Enter cautiously—size positions small.
TECHNICAL ANALYSIS
I also did a little technical analysis:
UNH price is at a resistance level
My EVaR indicator tells me we are in a low-risk area
RSI says the stock is oversold
I added the different price targets for better visualization
THE PLAN
My plan:
Later today, I will allocate 1% to 1.5% of my portfolio to the stock. If it drops, I will continue to DCA. The stock is already really beaten down, and I think a company this large cannot drop much more.
Quick note: I'm just sharing my journey - not financial advice! 😊

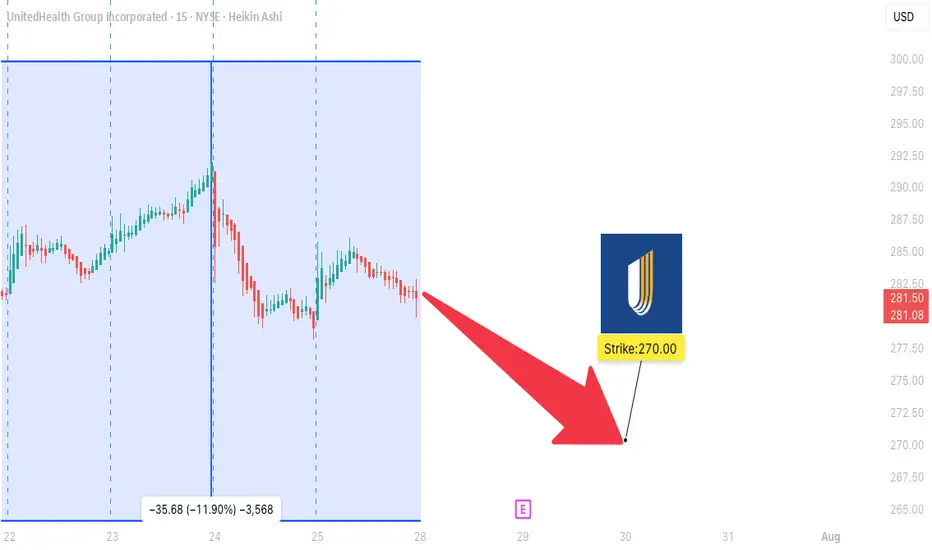
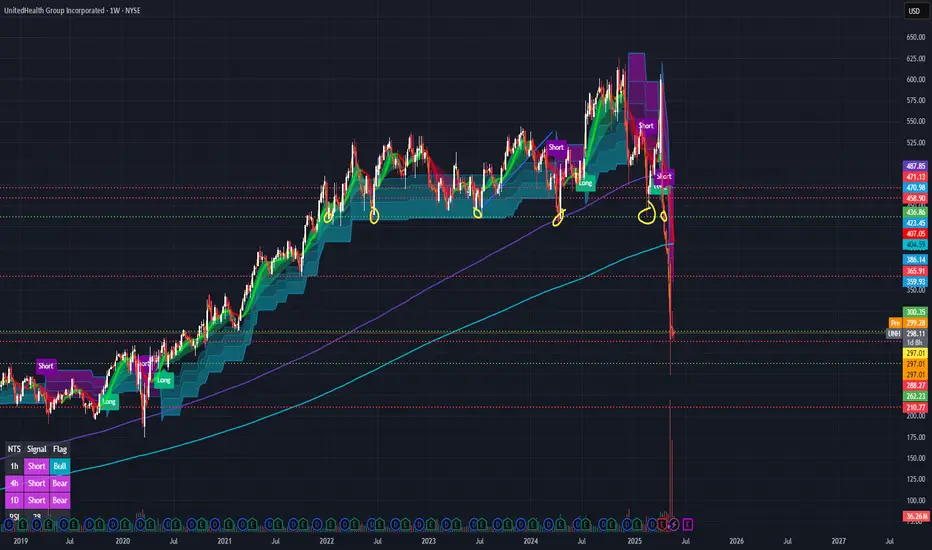
UNH WEEKLY TRADE IDEA (07/27/2025)
**🚨 UNH WEEKLY TRADE IDEA (07/27/2025) 🚨**
**Trend: Bearish Bias with Contrarian Options Flow**
🟥 **Technical Breakdown** + 🟩 **Bullish Flow Confusion** = Strategic Put Play
---
📊 **Key Technicals**
🧭 **Daily RSI:** 37.0 ⬇️
📉 **Weekly RSI:** 27.9 ⬇️ = *EXTREME BEARISH MOMENTUM*
📊 **Volume:** 1.2x prior week = *Institutional activity confirmed*
---
📈 **Options Flow Snapshot**
🟢 **Call/Put Ratio:** 1.64 → Normally bullish…
❗BUT in a falling market = **Contrarian noise** (per Gemini & Claude)
---
🔍 **Model Consensus Recap**
✅ All 5 models confirm BEARISH MOMENTUM
📉 Volume confirms downward pressure
❗ Disagreement only on *interpretation* of bullish call flow
📌 **Conclusion:** Put trade favored, but watch for surprise reversals
---
💥 **RECOMMENDED TRADE SETUP (Confidence: 65%)**
🎯 **Play:** Buy-to-Open PUT
* **Strike**: \$270
* **Expiry**: Aug 1, 2025
* **Entry Price**: \~6.10
* **Profit Target**: \$12.00 (🔁 2x Gain)
* **Stop Loss**: \$3.00 (🔻\~50%)
📆 **Entry Timing:** Market Open Monday
📦 **Size:** 1 Contract
---
⚠️ **Key Risks to Monitor:**
* 📈 If UNH moves above \$290 (Max Pain), bearish thesis invalidates
* ⚡ Gamma risk increases mid-week — *manage actively!*
* 📉 Unexpected volume dry-up could stall momentum
---
📌 **JSON FORMAT TRADE DETAILS (For Scripts/Alerts):**
```json
{
"instrument": "UNH",
"direction": "put",
"strike": 270.0,
"expiry": "2025-08-01",
"confidence": 0.65,
"profit_target": 12.00,
"stop_loss": 3.00,
"size": 1,
"entry_price": 6.10,
"entry_timing": "open",
"signal_publish_time": "2025-07-27 20:30:45 EDT"
}
```
---
💡 Summary:
Bearish momentum confirmed across models.
Flow confusion ≠ fade setup — it’s a **calculated put play**.
Trade smart, stay sharp.
🎯 Watch \$290.
💬 Tag fellow traders → \ NYSE:UNH bears unite!
\#UNH #OptionsTrading #BearishSetup #UnusualOptions #GammaRisk #MaxPain #TradingView #StockMarket
UNH Weekly Options Play – Bearish Setup (7/21/2025)
📉 UNH Weekly Options Play – Bearish Setup (7/21/2025)
RSI Breakdown 📊 | Institutional Hedging? 🤔 | Bearish Trend Confirmed 🚨
⸻
🧠 Multi-Model Analysis Summary
🔻 RSI Trends: Falling daily + weekly RSI → strong bearish momentum
📉 Volume: Consistently negative across models → confirms selling pressure
🧠 Options Flow: High Call/Put ratio (3.01) — debated as bullish hedge vs short cover
📌 Outcome: Consensus bearish, with minor short-term upside risk due to calls
⸻
🎯 TRADE IDEA – UNH $280 PUT
💥 Direction: Bearish
🧾 Strike: $280 Put
📆 Expiry: July 25, 2025
💵 Entry: $2.35
🛑 Stop: $1.18 (≈50% loss cap)
🎯 Target: $4.70 (≈100% gain)
📈 Confidence: 70%
⏰ Entry Time: Market Open
⸻
📎 Why Take This Trade?
✅ RSI + volume = bearish momentum confirmed
✅ Volatility is favorable for option premium expansion
❗️ Watch for gamma near expiry & unexpected institutional sentiment shifts
⸻
📊 TRADE_DETAILS JSON
{
"instrument": "UNH",
"direction": "put",
"strike": 280.0,
"expiry": "2025-07-25",
"confidence": 0.70,
"profit_target": 4.70,
"stop_loss": 1.18,
"size": 1,
"entry_price": 2.35,
"entry_timing": "open",
"signal_publish_time": "2025-07-21 12:49:28 EDT"
}
⸻
🔥 #UNH #OptionsTrade #BearishSetup #WeeklyTrade #PutOptions #InstitutionalFlow #MarketMomentum #VolatilityPlay

Buying when others are fearful! - Technical breakdown looks ugly but biting the bullet with a strong conviction that bad news are priced in.
- Risk is to the upside. Even if it goes down, I'm mentally ready to buy more of NYSE:UNH and let it compound for years to come.
- I believe that we should close the gap above @ $376 so we have around 35-40% upside by the year end.

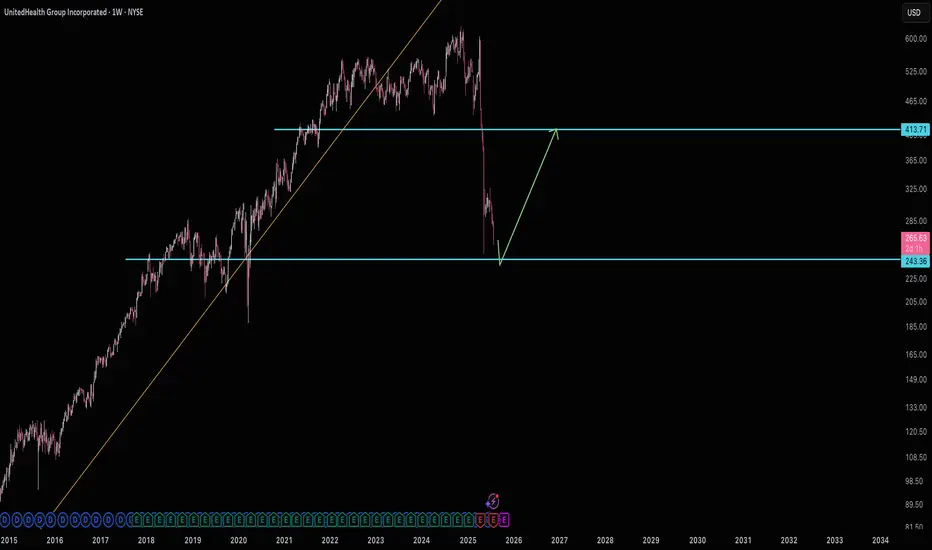
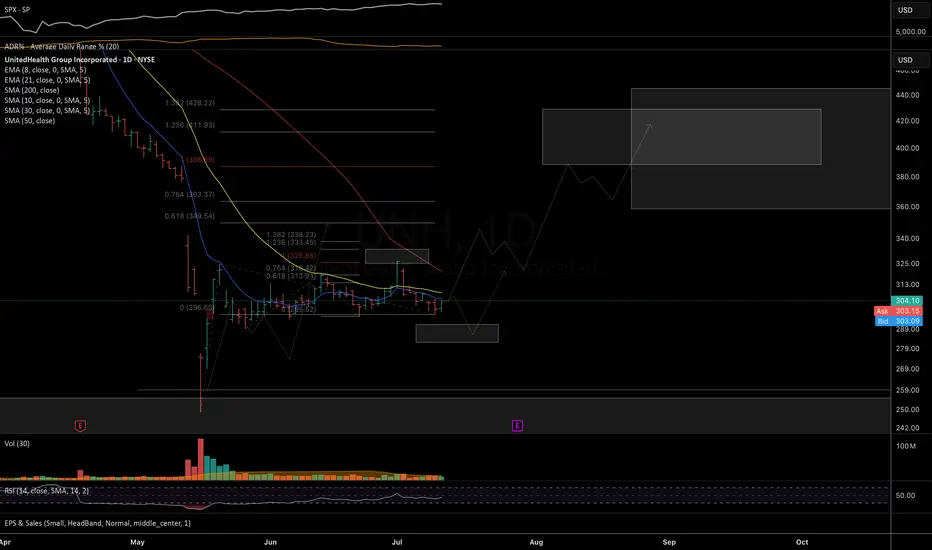
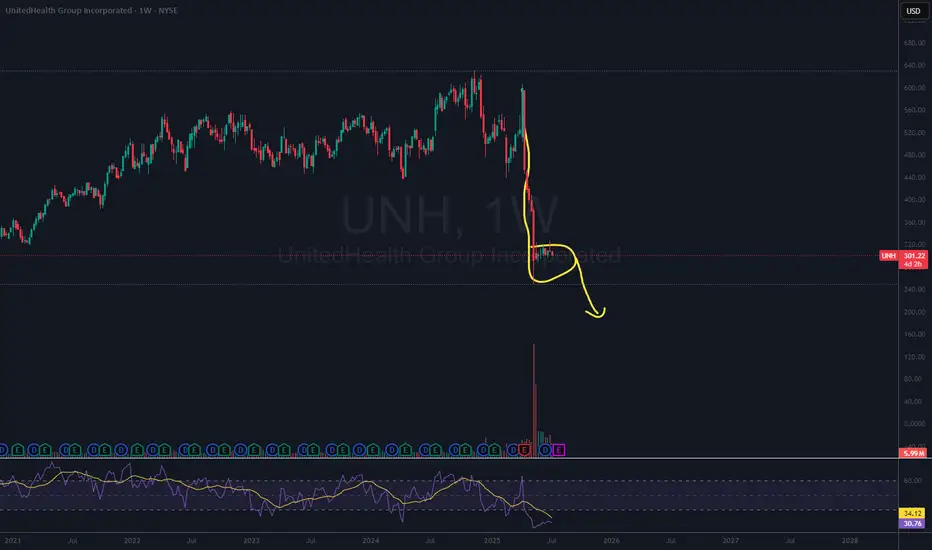
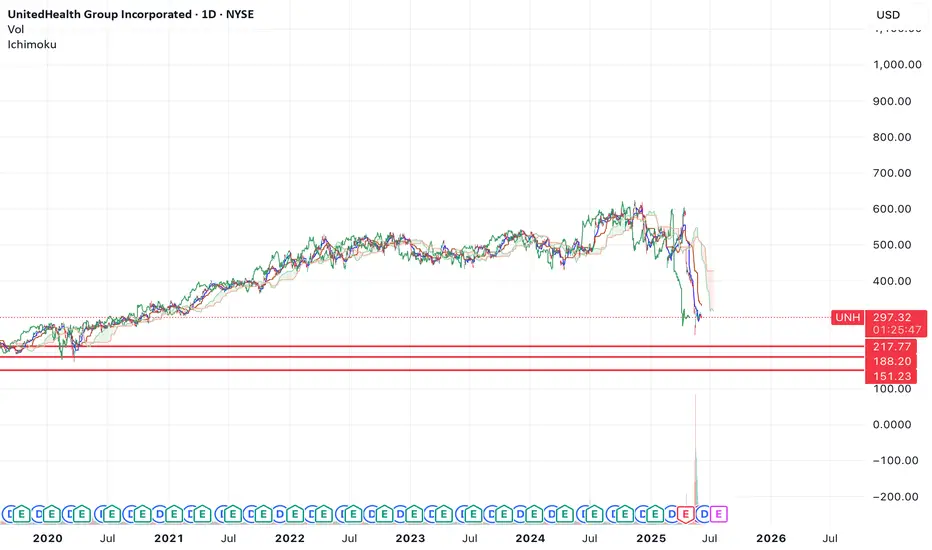
$UNH – Macro Outlook UpdateBack in April, I suggested the long-term uptrend from 2008 may have topped, shifting into a multi-year correction toward the 260–150 support zone. The decline unfolded faster than expected, with news-driven selling hitting the upper edge of that macro support — followed by a strong rebound.
Apr mind tradingview.sweetlogin.com
Currently, price is consolidating constructively. As long as 282 holds, I favor a continuation higher into the 360–430 resistance zone where we’ll reassess the broader structure.
Daily chart
Macro chart
Thank you for your attention and I wish you successful trading and investing decisions!
UNH How Far Down Are We Going $32 ? Based on the current class action lawsuit sentiment is negative and if it continues we can see levels of 258 being hit again. However if we break that level down then 163-150 level can possibly get hit followed by the 32-49 dollar range.
However despite all the negative news which does affect the market, if for whatever reasons we can break the high of 326 be prepared for a run up to 535 low probability but it is possible.
Trade Smarter Live Better
Kris/ Mindbloome Exchange

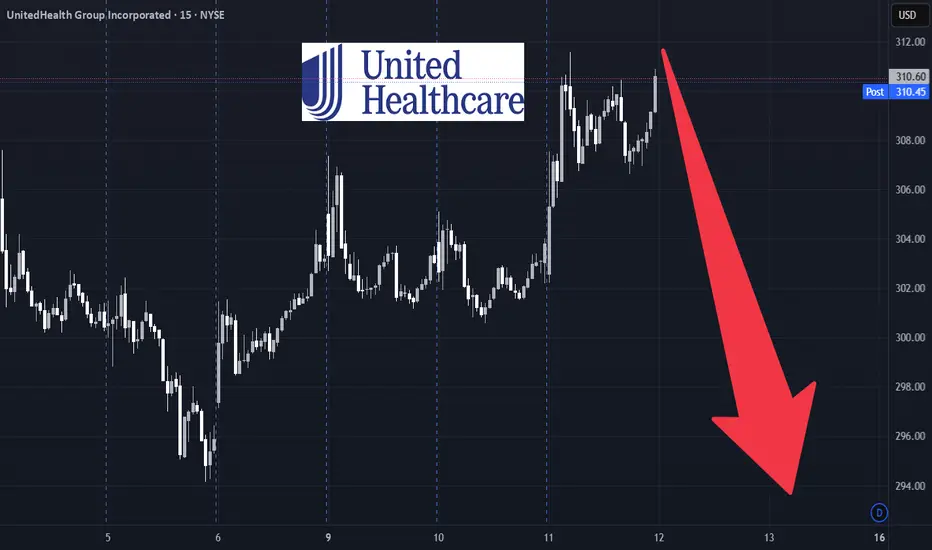
UNH Weekly Options Setup – Short-Term Pullback Risk (2025-06-11)📉 UNH Weekly Options Setup – Short-Term Pullback Risk (2025-06-11)
Ticker: NYSE:UNH (UnitedHealth Group)
Bias: Short-Term Bearish
Setup Timing: Market Open | Confidence: 70%
🔍 AI Model Consensus Overview
📍 Price: ~$310.56
📈 Momentum: Strong intraday bullish momentum — price above 10, 50, and 200 EMAs
📉 RSI: 5-min RSI ~79 → overbought
🎯 Max Pain: $300 → potential gravitational pull
🧠 Sentiment Split:
Bullish Models: Grok/xAI & DeepSeek
→ Focus on short-term momentum and trend continuation
Bearish Models: Llama/Meta & Gemini/Google
→ Emphasize overbought conditions & option pressure to steer price toward $300
⚖️ Strategic Summary
All models agree that:
• UNH is technically strong, but very overbought
• Max pain at $300 presents a downside magnet
• Both call and put options have tradable liquidity
Disagreement:
• Bulls see trend continuation
• Bears expect short-term correction before any continuation
✅ Recommended Trade
🎯 Direction: PUT
🛒 Strike: $300
📅 Expiry: 2025-06-13
💵 Entry Price: $0.60
🎯 Profit Target: $0.90 (+50%)
🛑 Stop Loss: $0.30 (–50%)
📈 Confidence: 70%
⏰ Entry Timing: Market open
⚠️ Risk Factors
• Continuation of bullish breakout can kill put value fast
• Sharp intraday whipsaws common near RSI extremes
• Price staying pinned above $310 would weaken max pain magnet effect
• Use tight stop-losses and limited position sizing
📣 Do you fade overbought RSI or ride momentum on NYSE:UNH ?
💬 Drop your setup 👇 & follow for more AI-backed trade ideas.
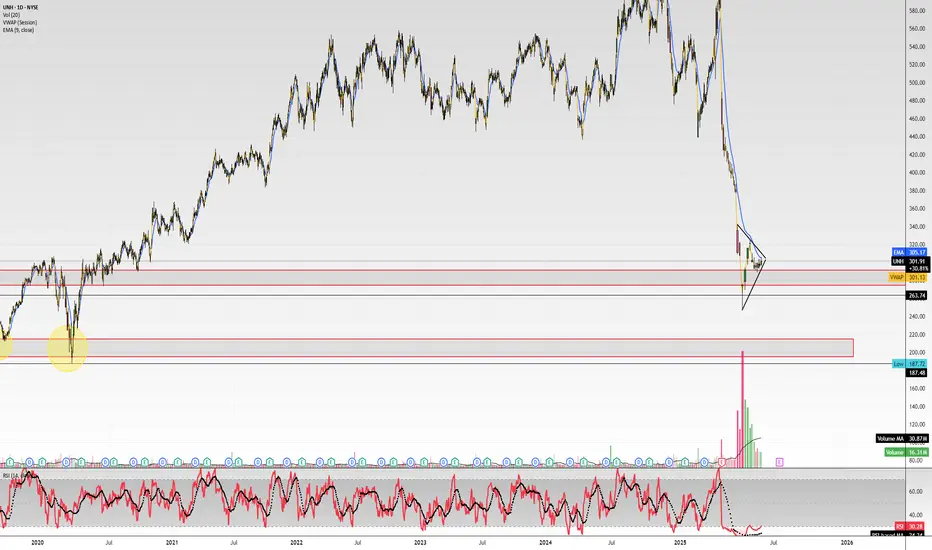
$UNH sub $200?After the last fall, I thought that we'd see a more significant bounce, however the lack of follow through on any bounce attempt has me now looking for more downside.
I think it's very likely that UNH continues lower here and falls to one of the lower support levels.
I think the two lower supports are the most likely levels for a good long-term buy.
Let's see how it plays out.
UNH Weekly Trade Summary — Bearish Setup into June 6 Expiry📉 UNH Weekly Trade Summary — Bearish Setup into June 6 Expiry
📊 AI Model Snapshot
Model Bias Strike Direction Premium PT / SL Confidence
Grok Moderately Bullish $317.5 CALL $0.71 +50% / −20% 65%
Claude Moderately Bullish $305 CALL $3.15 +100–150% / −40% 72%
Llama Moderately Bearish $287.5 PUT $0.80 +50% / −50% 70%
Gemini Moderately Bearish $290 PUT $0.95 +50% / −50% 65%
DeepSeek Moderately Bearish $287.5 PUT $0.80 +50% / −50% 65%
✅ Consensus Summary
🟥 3 of 5 models lean bearish based on price below EMAs, weak MACD, and bearish news.
🧲 Max Pain at $305 could cause a bounce but unlikely to reverse trend.
📰 Piper Sandler’s target cut adds downside weight.
💡 Recommended Trade
🔻 Strategy: Weekly Naked Put Play
📌 Ticker: UNH
🎯 Strike: $287.50 PUT
💵 Entry Price: $0.80
🎯 Profit Target: $1.20 (+50%)
🛑 Stop Loss: $0.40 (−50%)
📏 Size: 1 contract
📅 Expiry: 2025-06-06
⏰ Entry Timing: Market Open
📈 Confidence: 65%
⚠️ Risks to Monitor
🔄 Short-covering bounce could push UNH toward $305 and reduce put premiums fast.
⏳ Time decay (theta) speeds up mid-week — early action preferred.
🔍 Support zone around $300 – if it holds, consider cutting early.
📉 Broad market relief rally could neutralize this bearish edge.

$UNH contrarian idea ..Hello, this seems to be the "BUY THE DIP!" name definitely on the retail side. A guy once told me, if everyone is talking about getting into something, buying something, it might be a good time to sell and get out of that something. Example: I have been buying Bitcoin for five years, the price has risen and now everybody is talking about Bitcoin, that might be a clear indicator to sell some of that position and take profits; contrarian. So, something is telling me this name isn't ready to just ride to the upside like everybody is imagining. A big zone is down around $200, a 7 year demand. This name is in turmoil, randomness happens. I believe the name would have kept going down if the insider buy did not come in and bring some momentum. I can see this name retracing back to $275 and below. Will be interesting to see. On watch is $275p 6/20.
WSL
UNH: Why I Believe This Is a Dead Cat Bounce(Late posting)We’ve seen a quite the abounce in the market as of lately, but I believe it’s not a real recovery. To me, this looks like a classic dead cat bounce; a quick move up that happens during a downtrend before prices drop again. I’ll explain why I think this is the case, kind of a simple one.
First of all, the grand picture in the economy still looks fairly negative, especially respecting the TRUMP TARIFF new. Inflation hasn’t fully gone away, interest rates are still high, and consumer confidence is weak. There’s no major change in the news or the fundamentals that would support a strong comeback. It feels like people are just hoping things will improve, but the facts don’t really support that yet.
Second, the volume on this bounce has been low. In trading, volume tells you how strong a move is. If the price goes up but not many people are trading, it usually means there’s not much real buying happening. This bounce seems to be driven more by short sellers covering their positions, not by confident investors jumping in.
Third, we’re hitting key resistance levels—areas where the price dropped before—and we’re starting to see signs of rejection again. These levels are often hard to break through unless the market has strong momentum, and right now it doesn’t look like that’s the case.
Fourth, if you look at indicators like the RSI and MACD, they show that the price is already overbought. That means the recent move up may have gone too far, too fast. These kinds of readings usually lead to a pullback, especially when the bigger trend is still down.
Finally, the overall structure of the chart hasn’t changed. We’re still making lower highs and lower lows, which is what a downtrend looks like. Just because we’ve had a few green candles doesn’t mean the trend has reversed. Until we see the market start building a base and making new highs with strong support, I don’t think this bounce will last.
I n my opinion, this is one of those moments where people might get too excited too quickly. A lot of traders jump in thinking the bottom is in, only to get caught when the price turns back down. That’s why I’m staying cautious and watching for signs that the bounce is
failing.
I could be wrong, but right now, this feels more like a trap than a turning point.

$UNH still looks very uglyI'm still bearish on NYSE:UNH until 335-340 area gets taken out. The chart is so ugly. We've seen many "too big to fail" companies die out eventually. Will NYSE:UNH survive all this bad publicity? Insider action, options flow suggest this isn't going "parabolic" anytime soon lol sorry bulls
The technicals just don't align YET to the upside.
This is still so far from major moving averages on the higher time frames... the volume dried out after those huge moves and consumers hate them right now lol.. this is feeling like NYSE:GME apes versus wall street bullies. Except its NYSE:UNH versus the insured consumers finance.yahoo.com
20EMA on the daily = 342 still not even close
Also FYI - NYSE:UNH is not the type of stock that goes parabolic, nothing sexy on the options flow either
Below 290, I've got 275, 260, and 210 gap down. Good luck bulls and bears
$UNH the bounce continues higherI think it's likely that we continue higher from here. I could see us finding a short term top somewhere between the 3 resistances above.
Let's see how high we go.
$396 is the target I will likely taking profits.

UnitedHealth (UNH) Share Price ReboundsUnitedHealth (UNH) Share Price Rebounds
A month ago, in our analysis of the UNH chart, we:
→ highlighted that UnitedHealth shares had lost nearly 23% in value;
→ drew a descending channel and suggested that bearish pressure could continue, threatening the support level around $450, which had held since early 2022.
Since then, UNH’s stock price decisively broke below that level (as marked by the arrow), falling to around $250 — its lowest point since spring 2020 — before staging a sharp rebound. This steep price movement was driven by a series of fundamental developments, including:
→ the resignation of the CEO and news of a Department of Justice investigation into potential Medicare fraud;
→ UnitedHealth withdrawing its earnings guidance for the coming year;
→ political debates over the Medicaid programme as part of the 2025 budget negotiations;
→ President Trump’s directive to cut prescription drug prices.
Recent news that the new CEO and several top executives have bought tens of millions of dollars’ worth of UNH shares appears to have renewed investor confidence — the share price rose above the $300 mark yesterday.
Technical Analysis of UNH Share Chart
These latest developments justify an update to the descending channel configuration. Of particular note is the gradual decline with limited volatility — a sign that the price is moving along the channel's median line (highlighted on the chart).
In this setup:
→ the bounce from the $250 level points to the lower boundary of the channel;
→ traders may consider a scenario where the current recovery pushes UnitedHealth stock towards the median, after which supply pressure may return and offset the recent dominance of demand.
It’s also possible that the key psychological level of $300 could now act as support.
This article represents the opinion of the Companies operating under the FXOpen brand only. It is not to be construed as an offer, solicitation, or recommendation with respect to products and services provided by the Companies operating under the FXOpen brand, nor is it to be considered financial advice.