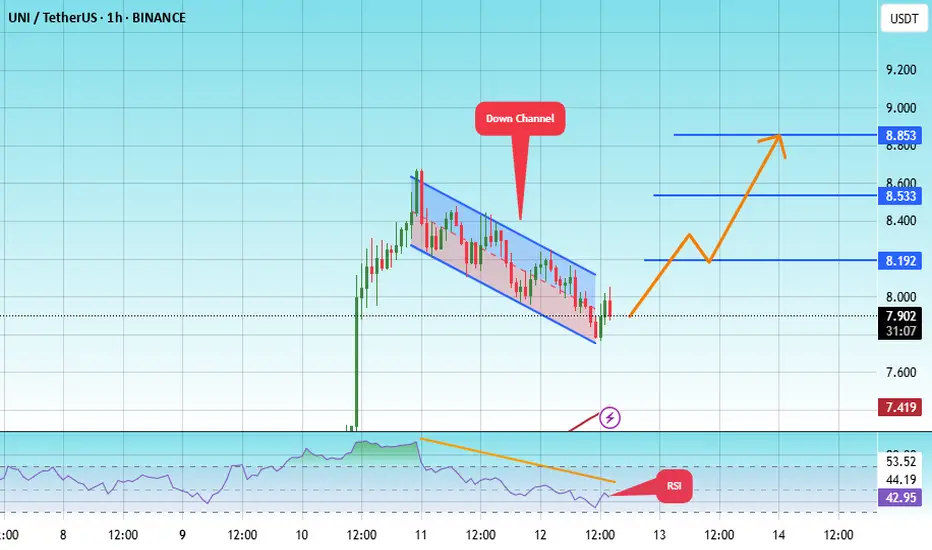
#UNI/USDT#UNI
The price is moving within a descending channel on the 1-hour frame, adhering well to it, and is heading toward a strong breakout and retest.
We are experiencing a rebound from the lower boundary of the descending channel, which is support at 7.78.
We are experiencing a downtrend on the RSI indicator that is about to be broken and retested, supporting the upward trend.
We are looking for stability above the 100 Moving Average.
Entry price: 7.85
First target: 8.19
Second target: 8.53
Third target: 8.85
Unibtc
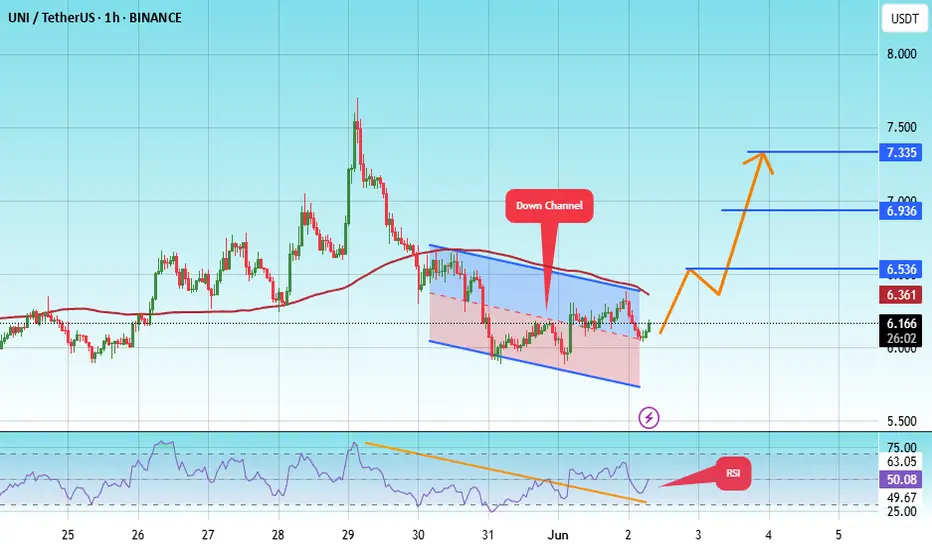
#UNI/USDT#UNI
The price is moving within a descending channel on the 1-hour frame, adhering well to it, and is heading for a strong breakout and retest.
We are experiencing a rebound from the lower boundary of the descending channel, which is support at 5.82.
We are experiencing a downtrend on the RSI indicator, which is about to break and retest, supporting the upward trend.
We are looking for stability above the 100 Moving Average.
Entry price: 6.15
First target: 6.53
Second target: 6.93
Third target: 7.33
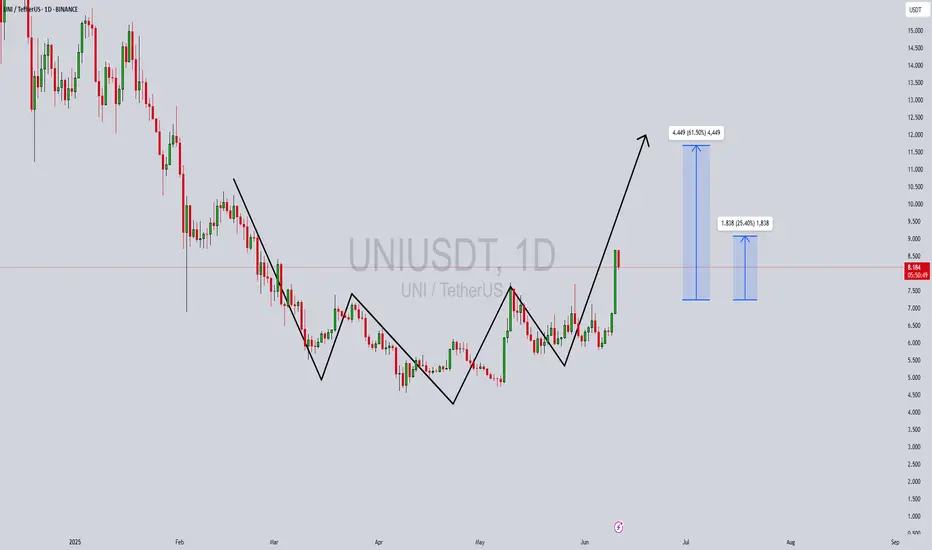
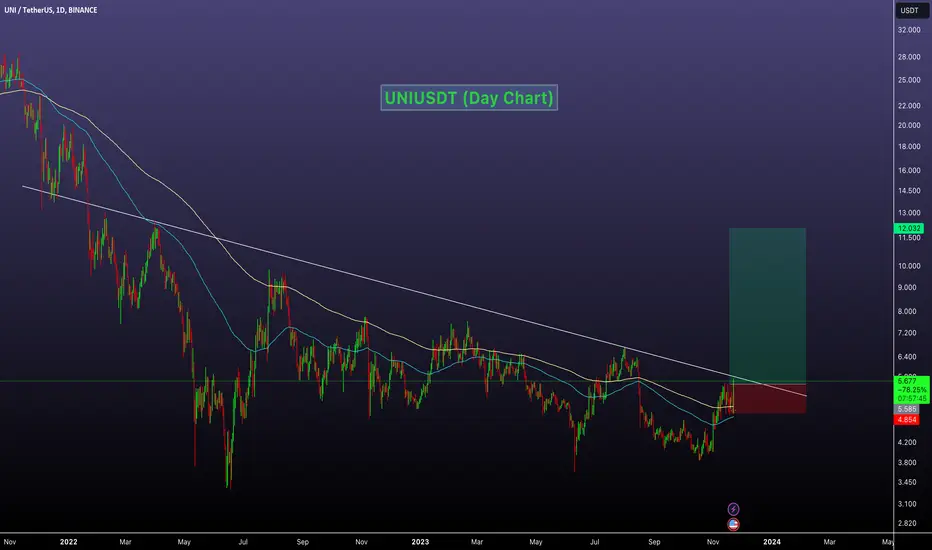
UNIUSDT Forming Bullish ReversalUNIUSDT is showing a classic bullish reversal pattern, marked by a clear W-shaped recovery, which is often a strong signal for trend reversal in crypto markets. The recent breakout has come with good volume support, further validating the strength of this move. The price action suggests a clean structure of higher highs and higher lows, indicating the start of a potential upward leg. Based on the pattern and momentum, we can expect a price gain in the range of 50% to 60% in the coming sessions.
From a technical perspective, this bullish formation aligns with an inverse head-and-shoulders structure, often seen at the end of prolonged downtrends. The price has reclaimed key resistance levels and is now consolidating above them, a sign that buyers are stepping in with confidence. The clear breakout candle and measured move projection both support the potential target range of $12 to $13 in the near term.
Fundamentally, UNI continues to be one of the most recognized names in the DeFi space, and growing ecosystem updates have attracted renewed interest from both retail and institutional investors. The recent uptick in trading volume and social media chatter surrounding UNI indicates rising momentum and strong investor sentiment. As the market rotates back into high-utility tokens, UNI is likely to remain in the spotlight.
For traders, keeping an eye on short-term pullbacks or consolidation zones around $8.00–$8.50 could offer ideal entries before the next breakout leg begins. Overall, UNIUSDT stands poised for a major bullish continuation if current market conditions persist and broader crypto sentiment remains positive.
✅ Show your support by hitting the like button and
✅ Leaving a comment below! (What is You opinion about this Coin)
Your feedback and engagement keep me inspired to share more insightful market analysis with you!
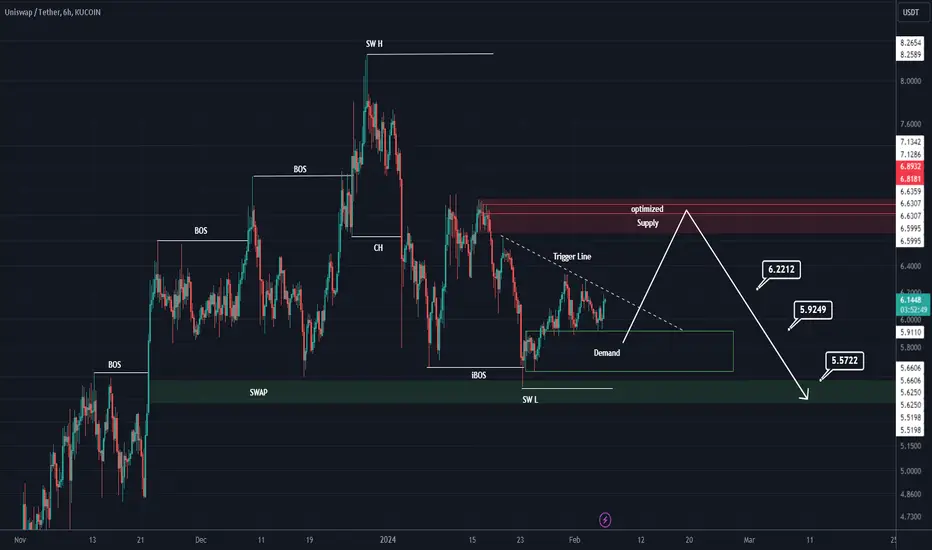
UNI Sell/Short Setup (4H)The overall structure in UNI is bearish, considering the recent CH (Change of Character) observed in the swing.
The price is currently below the resistance line, and if it approaches the premium zone of the previous minor wave, we can look for sell/short positions based on UNI’s overall outlook. The zone where we are interested in entering a position is marked with a red circle.
The target can be the green box.
A daily candle close above the invalidation level would invalidate this analysis.
For risk management, please don't forget stop loss and capital management
When we reach the first target, save some profit and then change the stop to entry
Comment if you have any questions
Thank You

#UNI/USDT Ready to launch upwards#UNI
The price is moving in a descending channel on the 4-hour frame and is adhering to it well and is heading to break it strongly upwards
We have a bounce from the lower limit of the descending channel, this support is at a price of 10.23
We have a downtrend on the RSI indicator that is about to be broken, which supports the rise
We have a trend to stabilize above the moving average 100
Entry price 11.80
First target 12.78
Second target 14.11
Third target 15.75

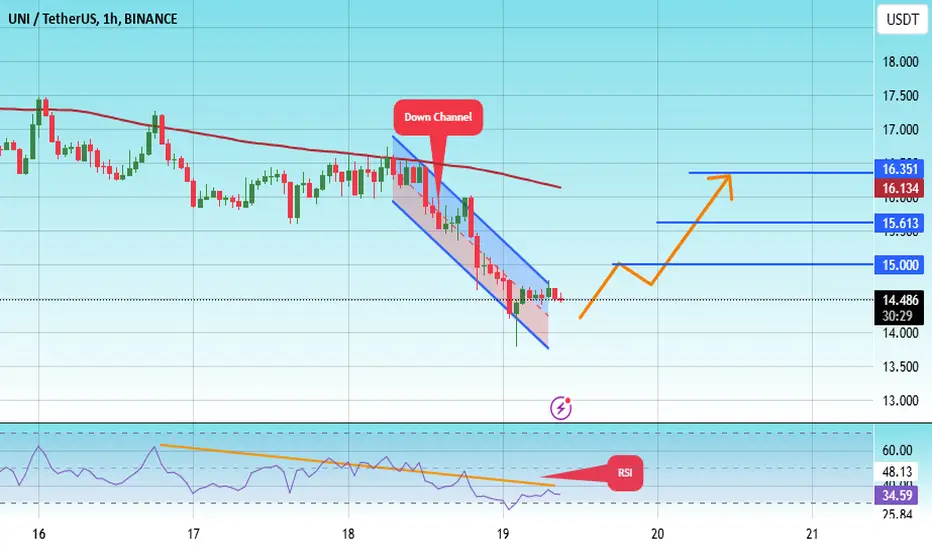
#UNI/USDT Ready to go higher#UNI
The price is moving in a descending channel on the 1-hour frame and sticking to it well
We have a bounce from the lower limit of the descending channel, this support is at 14.00
We have a downtrend on the RSI indicator that is about to be broken, which supports the rise
We have a trend to stabilize above the 100 moving average
Entry price 14.50
First target 15.00
Second target 15.61
Third target 16.35
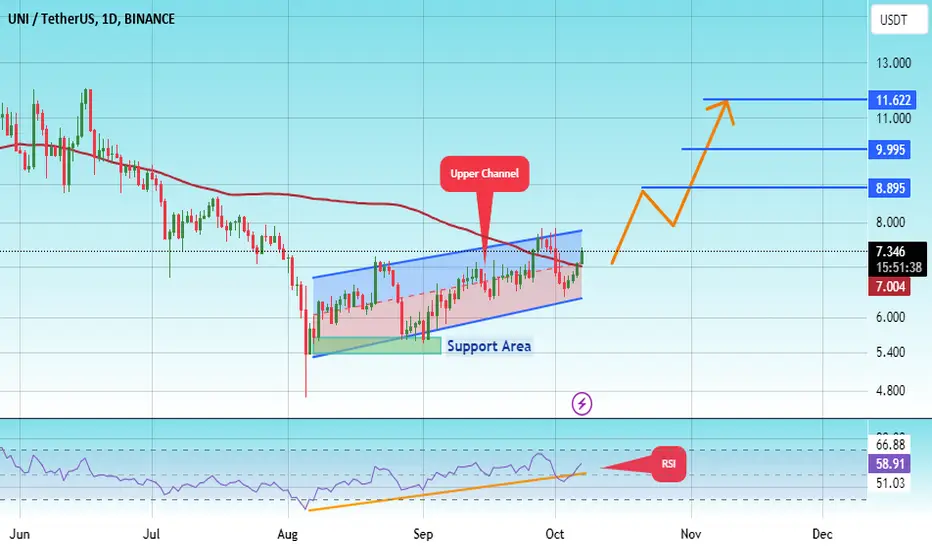
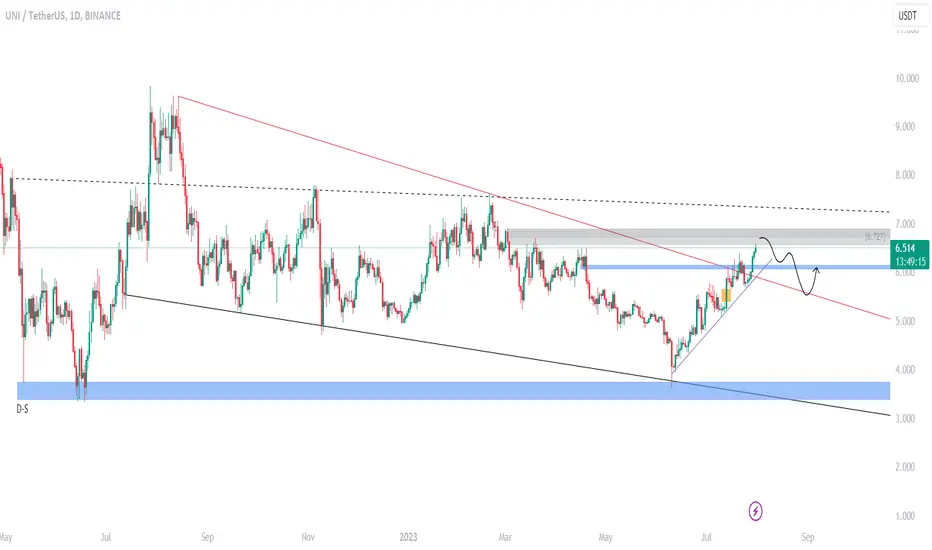
#UNI/USDT#UNI
The price is moving in an ascending channel on the 1-day frame and is sticking to it very well and is about to break higher
We have a bounce from the lower limit of the channel at 6.37
We have an ascending trend on the RSI indicator that is about to break, which supports the rise
We have a trend to stabilize above the 100 moving average
Entry price 7.16
First target 8.90
Second target 10.00
Third target 11.62
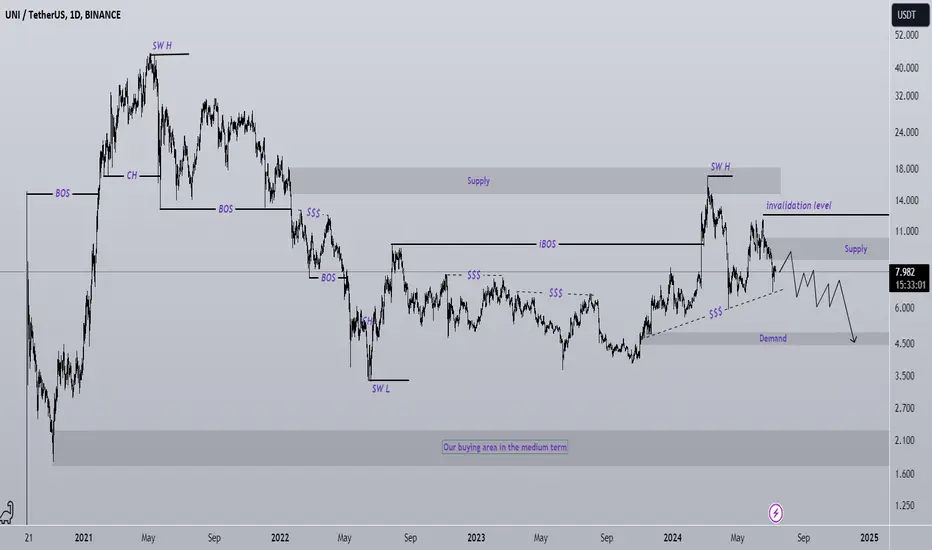
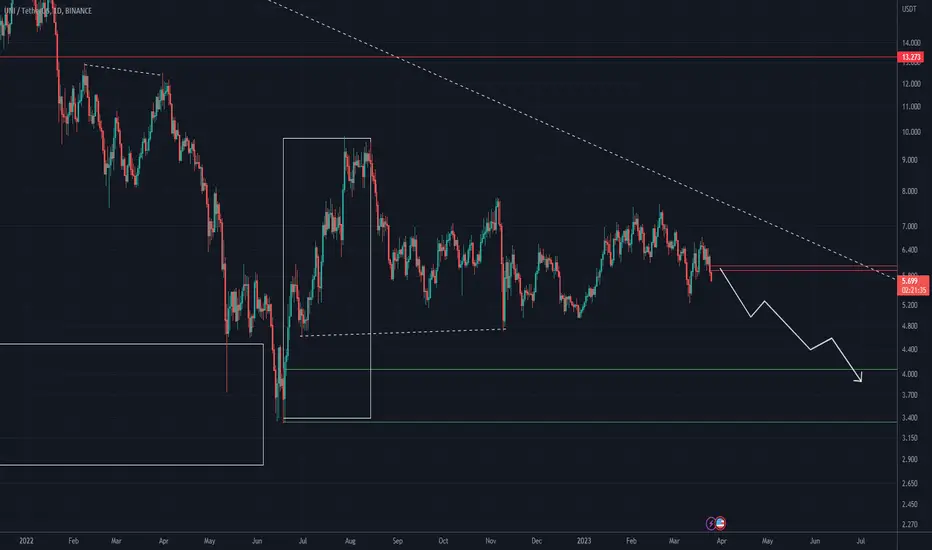
UNI is bearishThe structure is bearish on large time frames.
The liquidity pools in the upper part of the chart have been swept and now the price is going to move towards the liquidity pools in the lower part of the chart.
The short-term target is the demand range.
In the long term, our buy position is the place we specified at the bottom of the chart.
Closing a daily candle above the invalidation level will violate the analysis
Note that the financial market is risky, so:
Do not enter a position without setting a stop and capital management and confirmation and trigger.
When we reach the first TP, save some profit and try to move the stop continuously in the direction of your profit.
If you have any comments please post them, comments will help us improve our performance
Thanks
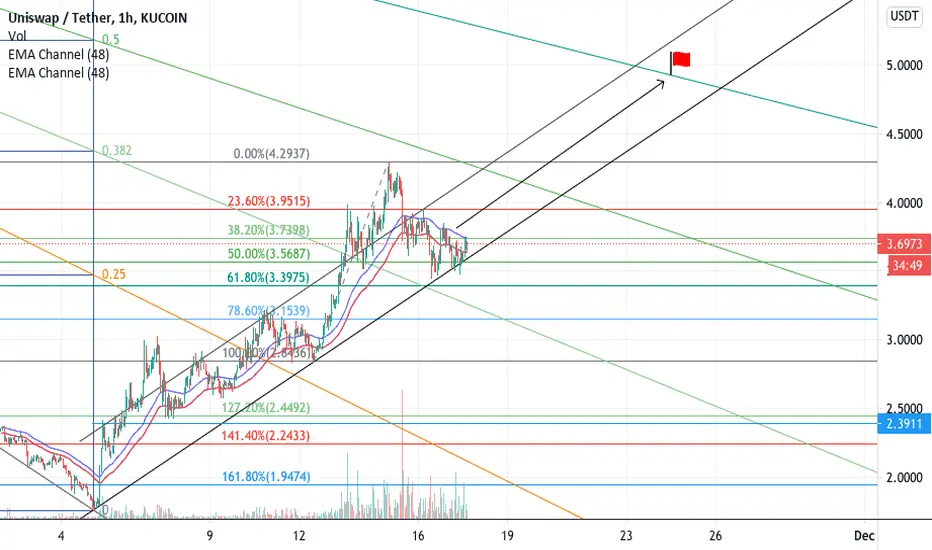
🦄 UNI Long 🦄if everything remains the same, there is a high probability that UNI will continue in the bullish channel .
It passed the 38.2 Fib Fan level, I would expect it to reach 61.8 at least
What do you think?
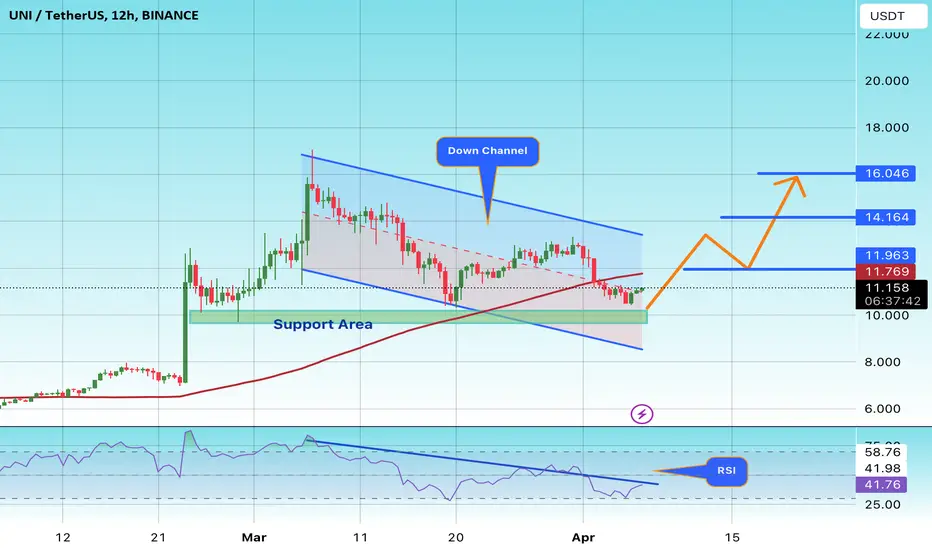
#UNI/USDT#UNI
We have a bearish channel on a 4-hour frame, the price moves within it and adheres to its borders well at this price.
We have a fundamental support area at $10
We have a higher stability moving average of 100
We have a downtrend on the RSI that is about to break higher
Entry price is 11.16
The first goal is 11.96
Second goal 14.16
Third goal 16.00
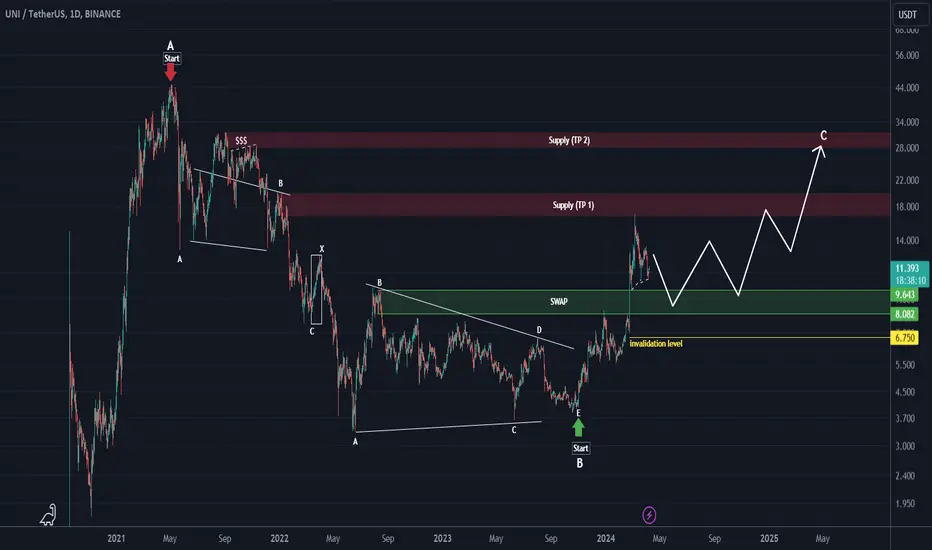
UNI looks bullishUNI looks to be inside the bullish wave C. The degree of this wave is big and it is expected that this wave will continue for months.
The SWAP range is the right place for buy/long positions.
The targets are clear on the chart. Note that these targets are medium term.
Closing a daily candle below the invalidation level will violate the analysis
For risk management, please don't forget stop loss and capital management
When we reach the first target, save some profit and then change the stop to entry
Comment if you have any questions
Thank You
UNI is moving along the channelUNI is moving along the channel.
🔵Entry Zone 12.230 - 12.467
🔴SL 11.291
🟢TP1 13.387
🟢TP2 14.798
Risk Warning
Trading Forex, CFDs, Crypto, Futures, and Stocks involve a risk of loss. Please consider carefully if such trading is appropriate for you. Past performance is not indicative of future results.
If you liked our ideas, please support us with your likes 👍 and comments.

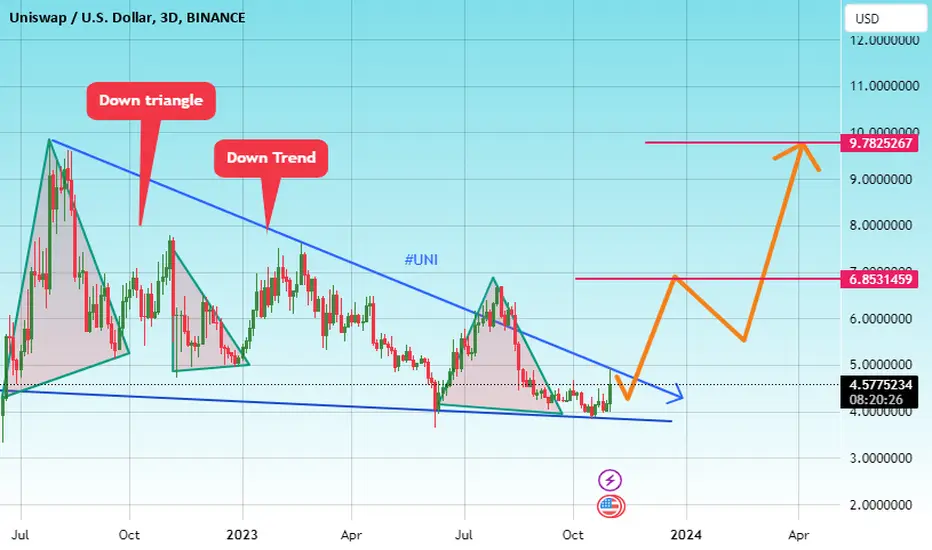
#UNI/USDT#UNI
The pair has recently witnessed noticeable price movement
After falling for a long time
The price recently touched the downtrend, from which a price correction is expected
Current price 4.57
First goal 6.85
Second goal 9.78
Please note that the price is on its way to the targets and may be exposed to ups and downs at intervals that are expected to take time to reach the targets.
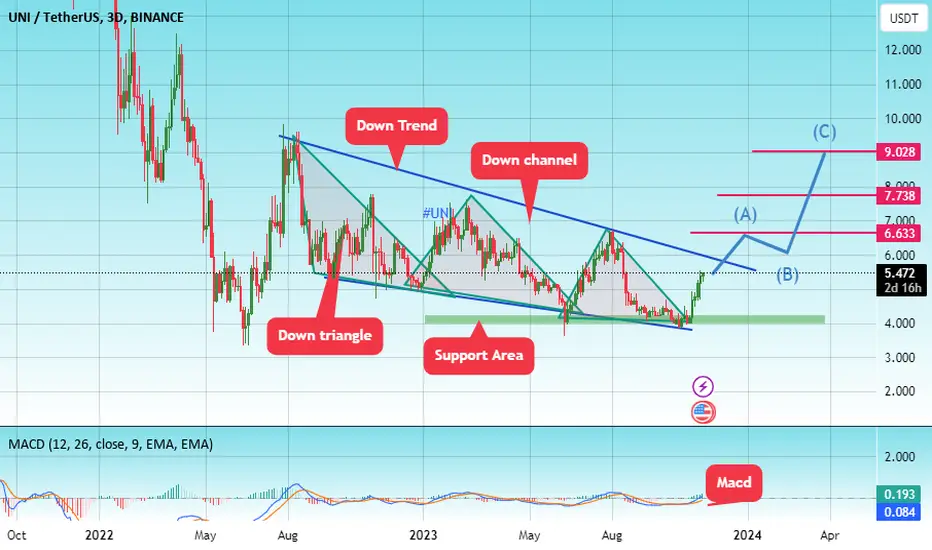
#UNI/USDT#UNI
The price has been moving in a downward channel since August 2022
The price is now on its way to a downward trend
The price now is 5.47 $
First goal 6.63 $
Second goal 7.73 $
Third goal 9.0 $
Which represents 210 % of the current price
With significant oversold and upward momentum
We also find that the MACD indicator is highly oversold
All of this supports the falling channel pattern, whose upper trend we are about to reach
We have a big support area on the chart at the price of 4.5 $
UNI ANALYSIS (4H)structure according to bearish CH And iBOS is bearish.
The previous lows have all been cleared and the price has hit a support.
Now we need a range where there is a significant sell order to continue the decline.
We have marked the good area where there is a sell order on the chart. It is expected that the price will reach this range with fluctuations and then we will see a drop
For risk management, please don't forget stop loss and capital management
When we reach the first target, save some profit and then change the stop to entry
Comment if you have any questions
Thank You
UNI ANALYSIS (1D)We seem to be in a big wave B which consists of 3 ABC waves. Wave B of B looks like a diametric, now we are inside the g wave of this diametric. In the red box, the rise of this coin can end and enter the falling wave C.
For risk management, please don't forget stop loss and capital management
Comment if you have any questions
Thank You

UNIUSDT Good Bullish!UNIUSDT Technical Analysis Update
The price of UNIUSDT is about to break its trend resistance line, and the volume is increasing on the daily chart. I am expecting a bullish move in UNIUSDT in the coming days.
Buy zone : Below $5.65
Stop loss : $4.80
Swing Trade
Regards:
Hexa
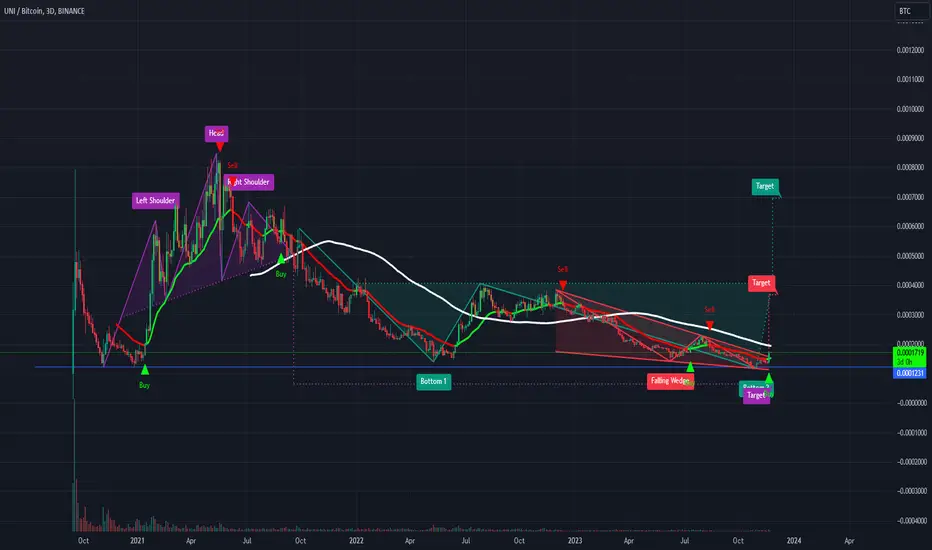
UNIBTC just getting started!?The market is waking up finally
UNI against USDT has had a strong move recently but its good to keep in mind that this move is just a tiny blip against the BTC pair. I believe UNI will moon v the BTC pair eventually.
This move is nothing in the grand scheme
Uni is still relatively small market cap for its wide spread users and fees generated. This move does only a little to change that undervaluation proposition.
As Crypto Centralised Exchanges come under more pressure there is market share to be won for the Decentralised Exchanges
Before CZ left us he was an avid believer in decentralised exchanges eating market share. This is likely to be true. Currently Uniswap is the clear dominant player and is almost the equivalent to Ethereum's position last time in its space. People are using Uniswap. Fees are being generated. Growth is continuing and will explode in bull market. Uni should see value increase due to the networks value increasing.
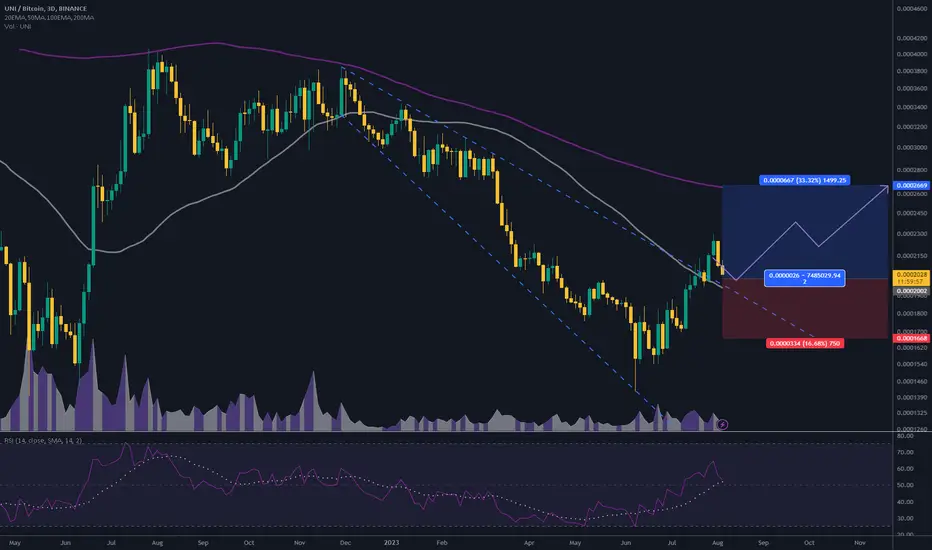
#UNI/BTC 3D (Binance) Broadening wedge breakout and retestUniswap is pulling back to 50MA support and seems likely to bounce towards 200MA resistance.
⚡️⚡️ #UNI/BTC ⚡️⚡️
Exchanges: Binance
Signal Type: Regular (Long)
Amount: 6.0%
Current Price:
0.0002028
Entry Targets:
1) 0.0002002
Take-Profit Targets:
1) 0.0002669
Stop Targets:
1) 0.0001668
Published By: @Zblaba
CRYPTOCAP:UNI #UNIBTC #Uniswap #DeFi
Risk/Reward= 1:2
Expected Profit= +33.3%
Possible Loss= -16.7%
Estimated Gaintime= 3 months
uniswap.org
UNIUSDTThe conditions of the BINANCE:UNIUSDT are as follows:
Over the past 50 days, we have witnessed an uninterrupted 85% price growth.
Most of the resistance lines we assumed for UNI turned out to be weak, and the price easily surpassed them.
However, now we are approaching the 0.786 Fibonacci retracement level, which is located at a price of $6.75. In my opinion, this point, or $7, could potentially lead the price back to $6, and then $5.30.
At the $6 price point, we have strong support. However, between $5.80 and $5.35, there is a fear value gap(FVG), which could guide the price to those points and cause a price drop.
Also, in the 4-hour timeframe, we are witnessing a divergence in the RSI (Relative Strength Index) indicator, which can be an initial signal of a trend reversal.
But we need to wait and see how the market reacts to the $6.75 price level.
Ultimately, everything depends on the overall market conditions.
UNI’s Downward Trend and Potential Bullish ReversalDue to ongoing sales pressure in the market, UNI experienced a downward trend and reached the support level of $3.62. This support level coincides with the 0.5 Fibonacci level on the monthly time frame, indicating a strong demand area. Additionally, there is a potential formation of a double bottom pattern on the monthly chart.
If more than 50% of last week's bearish candlestick is recovered and a strong bullish candlestick forms this week, it suggests the possibility of changing the trend to a bullish state. Currently, the price is back within the descending channel, but with the emergence of demand, it could potentially rise towards the first target, the midline. However, breaking the resistance at $5 is crucial to escape the descending channel. Such a rapid turnaround may influence the trend for a period of time.

UNI CAN DROP MOREHi, dear traders. how are you ? Today we have a viewpoint to SELL/SHORT the UNI symbol.
For risk management, please don't forget stop loss and capital management
When we reach the first target, save some profit and then change the stop to entry
Comment if you have any questions
Thank You
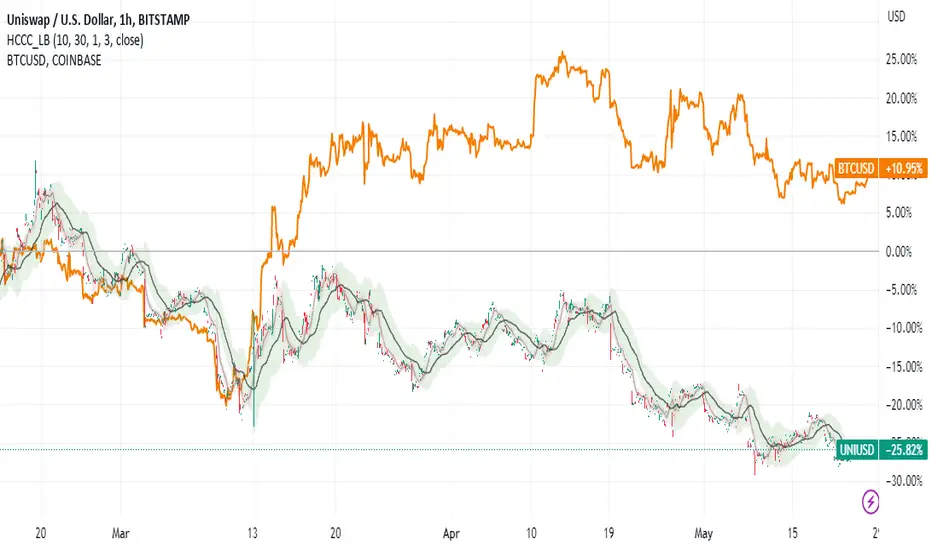
UNIUSD Underperformance: Why You Should Sell NowToday, I want to talk to you about UNIUSD and why it's underperforming despite having a DEX as big as Coinbase.
It's no secret that UNIUSD has been struggling to keep up with other cryptocurrencies in the market. While their DEX is as big as Coinbase, their token price has consistently dropped. So, what's the reason behind this?
The truth is that UNIUSD has been facing a lot of competition from other decentralized exchanges. With so many options available, it's becoming increasingly tricky for UNIUSD to stand out. The recent market volatility has also played a role in the token's underperformance.
So, what should you do about it? My advice is to sell your UNIUSD tokens now while you still can. With the token's value continuing to drop, it's only a matter of time before it hits rock bottom. So, please don't wait until it's too late to get out.
In conclusion, UNIUSD is underperforming for various reasons, and it's time to cut your losses and move on. Sell your UNIUSD tokens now and invest in a cryptocurrency that has a more promising future.