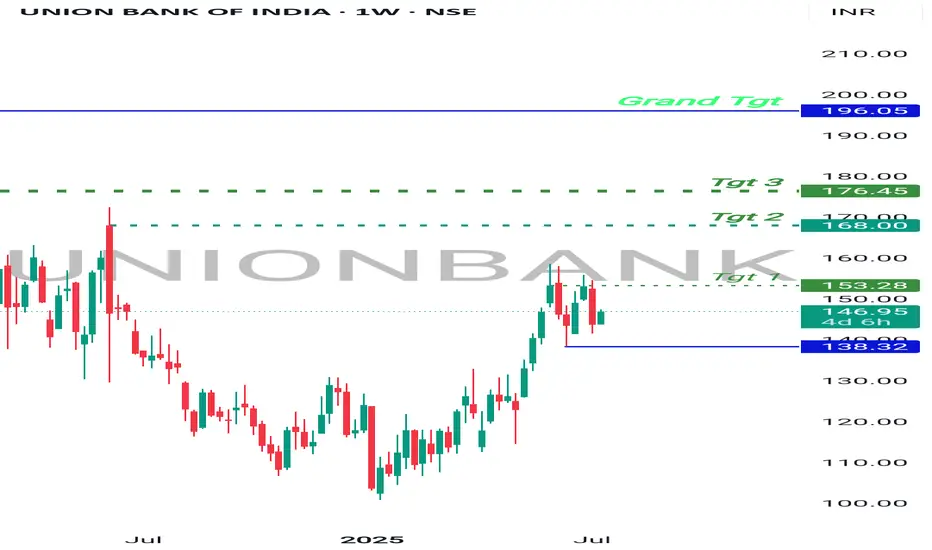
Bullish Bet , UnionBankBanknifty at support.
UnionBank on recent high making sideways moves, which means consolidation.
Once Banknifty Bounce back, UnionBank will break the resistance on weekly and monthly Basis and will start moving higher.
It has higher targets on a short and long term investment.
Good to hold for short term.
Unionbankofindia
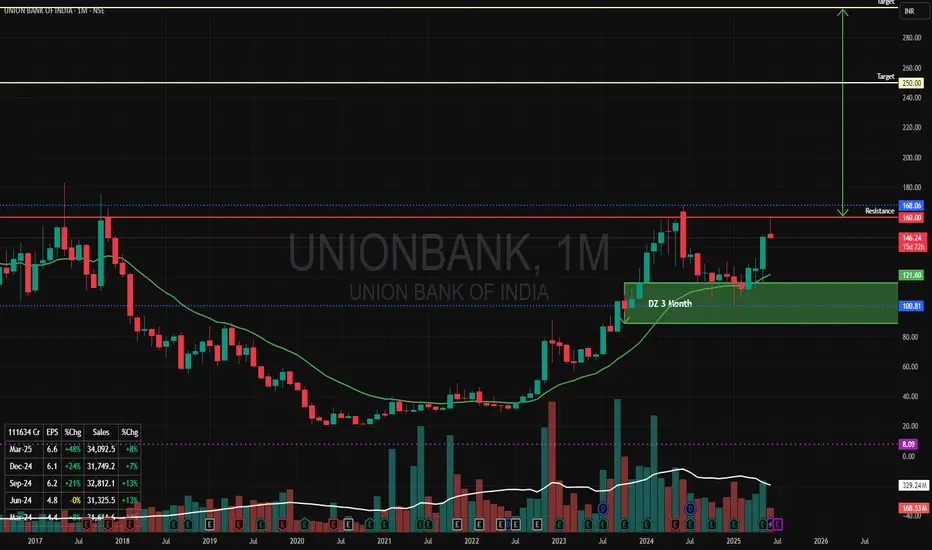
"Union Bank of India" Cup & Handle PatternI can see a Cup & Handle Pattern in Union Bank of India in Monthly Time Frame. Price is also coming from Monthly Demand Zone.
Rs 160 is a a Resistance line to break this Pattern.
Once we see a breakout of this level of Rs 160 Upside with a Good Volume (Increased from Previous Months) the Price can double from here to Rs 300 in next 12 months time.
first Target Rs 250/-
Second Target RS 300/-
Lets Hope for the Best!
UNIONBANK go long ifit crosses 116
enter @ 116.10
stop loss: 112.70 (if stop loss is hit then loss is 11.5% so take entry if you are capable to take the loss of 11.5%)
target: 141.70 ( if worked then the profit will be 22% with risk from buying level is 11.50%)
NOT SEBI registered , so do your own analysis to take the entry , this is my analysis according to which i may trade.

UNION BANK OF INDIA BREAKOUTUNION BANK OF INDIA HAS GIVEN A FRESH WEEKOUT
heading towards the 200/225 levels
its a holding trade
levels marked on chart

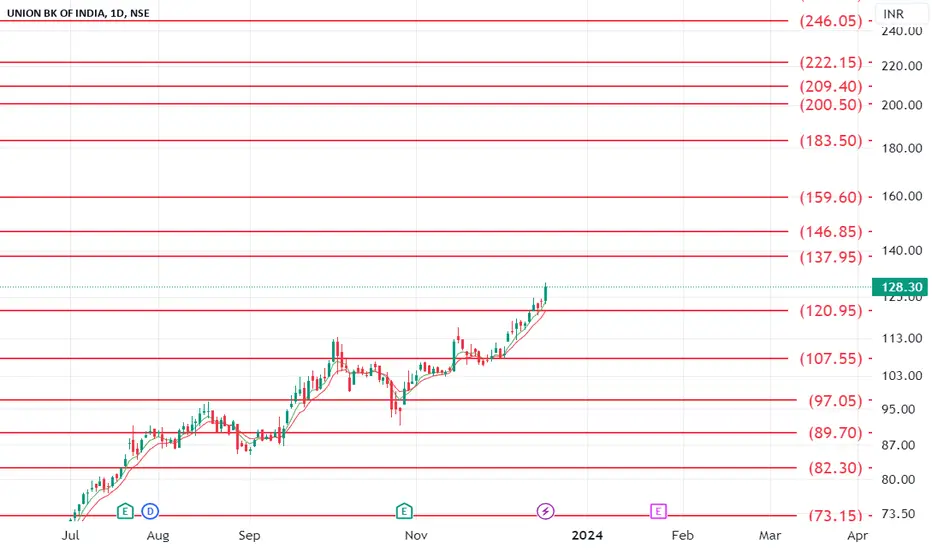
UNION BANK OF INDIA UPCOMING LEVELSHi,
Here I am sharing NSE:UNIONBANK upcoming support and resistance.
Note: This is my personal analysis, only to learn stock market behavior. Thanks.
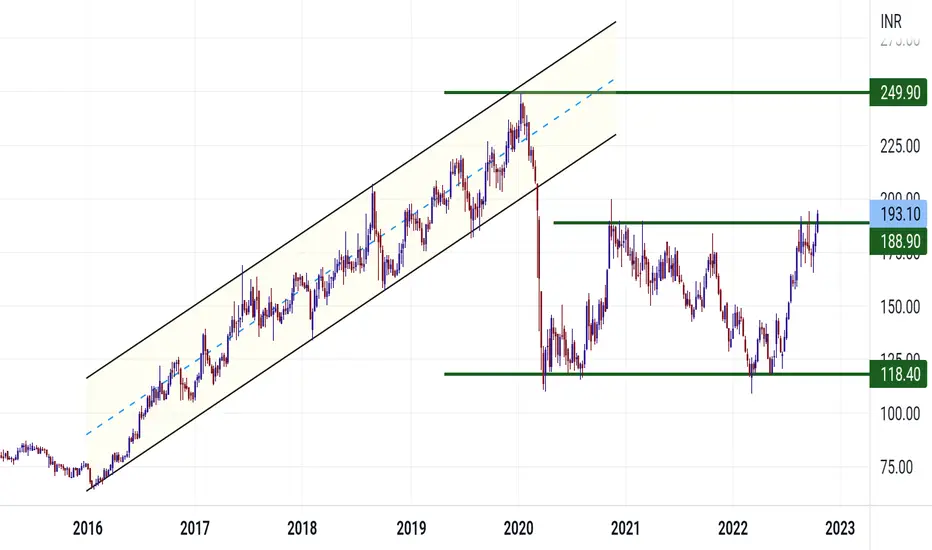
Union Bank of India (Swing):Union Bank of India (Swing):
Stakes are high for a 75-100% up move via swing.
Keep adding in chunks at the current level and if possible on any dips.
Appropriate resistances are highlighted.
Time to attain the target can be over 6 months.
Note: Do your own due diligence before taking any action.
I would be posting updates for this chart in the comments sections as time progresses.
Queries are welcome.

Union Bank of India (Swing):Union Bank of India (Swing):
A 20-30% up move is possible on the cards.
Note: Do your own due diligence before taking any action.

City Union Bank Breakout TradeA recent Breakout has been observed on the weekly timeframe of City Union Bank.
And as per the setup a 32% upside can been seen in near future in the stock , so don't miss the train.
Disclaimer: above trade is for educational purpose only, please consult your financial advisor before any trade...
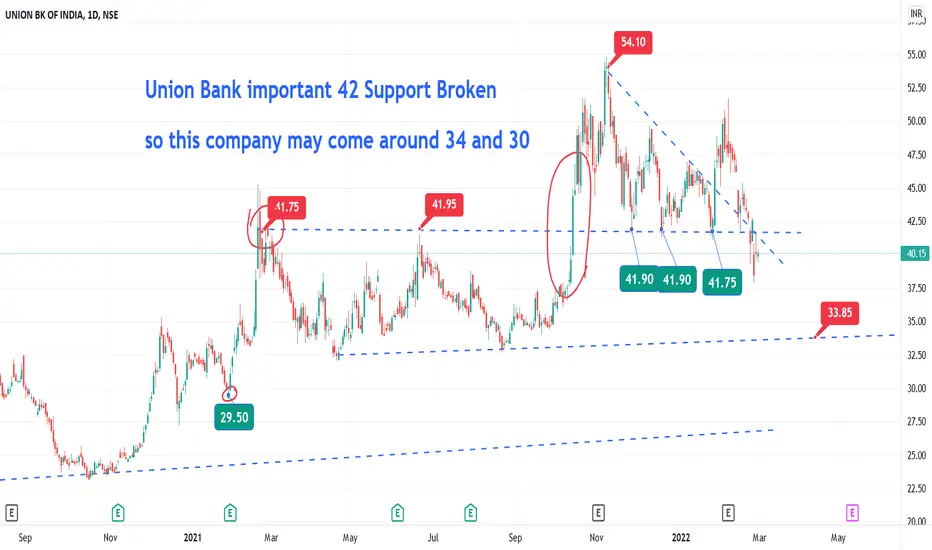
Union Bank Technical ViewUnion Bank important 42 Support Broken
so this company may come around 34 and 30
Union Bank Trade IdeaUnion Bank is making a broadening wedge pattern in daily time frame.
We have closed above the pivot(orange line) with good volume which is a bullish sign now we need to stay above it for next few days for further trend continuation.
and there is beautiful relation which is found out to be with price and time, so just being bullish biased upcoming rally can take 27 days.
Entry- 58.35
Targets- 65-67-70
Stoploss- 55.90
Trend invalidation- Any daily close below 53.20
