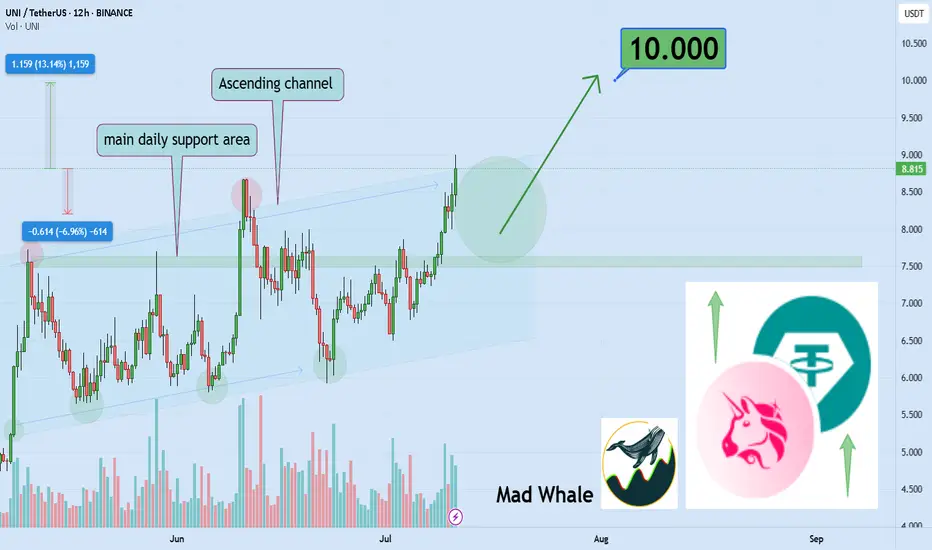
UNI up 13% – is $10 the next stop?Hello✌
let’s dive into a full analysis of the upcoming price potential for Uniswap 📈.
BINANCE:UNIUSDT has maintained solid bullish structure within a well-formed ascending channel and is now approaching a key daily support zone. Recent volume spikes and a 13% price increase indicate growing buying interest. A breakout above the channel resistance could open the way toward the psychological target at $10, a level watched by many traders. Monitoring price action and volume confirmation here is essential for potential trend continuation. 📈🧠
✨ Need a little love!
We pour love into every post your support keeps us inspired! 💛 Don’t be shy, we’d love to hear from you on comments. Big thanks , Mad Whale 🐋
Uniswap
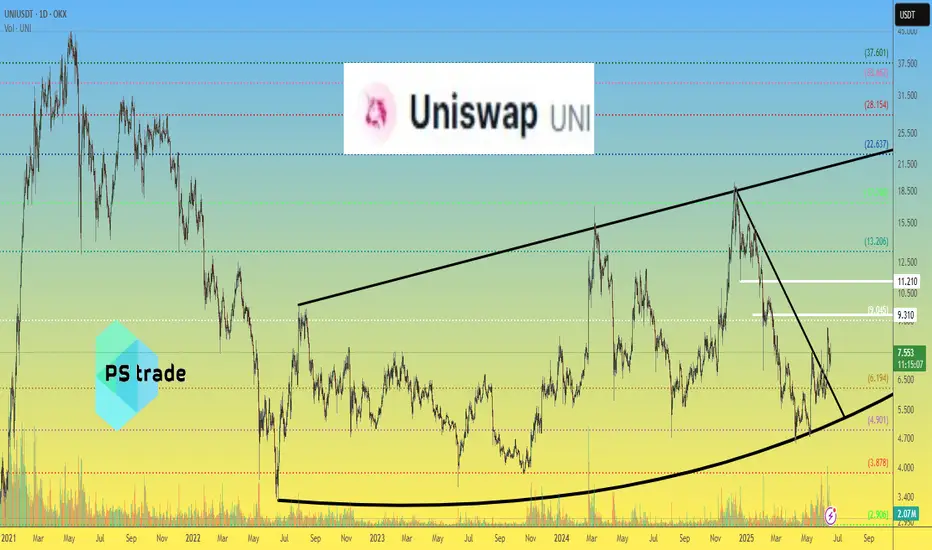
Uniswap Exits Opportunity Buy Zone · $73 & $118 2025 ATH TargetUniswap is finally out of its long-term opportunity buy zone, a trading range that was activated first in 2022 and remained valid for a long time.
After October 2023, UNIUSDT produced two bullish moves but each time fell back into this zone. Orange/brown on the chart. Notice how this zone matches price action happening below EMA89, EMA55, MA200, EMA144 and EMA233. As Uniswap turned bullish and fully confirmed, it broke above all this major levels.
Last week, it managed to close above the really long EMA233 and this week the action is staying above. Currently $10.30.
Notice waves "1" and "2" these are relatively small waves. Something will happen with #3. The market evolves exponentially. Instead of another similar wave going a bit higher, it will be something like 2021. Not like 2021 in the sense that it will reach similar price levels, but in the sense that it will be completely out of proportion with what you saw in the last several years. Prices will go off-the chart.
We can think of resistance as a new all-time high being found around $73 and $118, but this time I only want to call your attention to this moment now. The fact that market conditions are changing and it is still early when we focus on the long-term.
I just realized that I might be seeing things differently and it is hard to visualize, for someone without the actual experience, what is about to happen. But despair not because that is the one reason why I am here and why you are reading this. I am here to alert you, remind you and prepare you for an event before it happens. In this way, you can profit and achieve your financial goals. I want to give you value in exchange for your trust. Will you trust? Uniswap is going up. Crypto is going up and it will be the best since 2021. Possibly the best bull market in the history of Crypto, the new regulatory framework and global adoption is saying so.
Thanks a lot for your continued support.
Namaste.

$UNI - $10 from here?Hi guys! 👋🏻
🔔I'll be trying this setup for Uniswap
🔔 We have bounced from the strong support at $4.80, which we retested in April 25 and May 7 forming a pattern impersonating a double bottom
🔔 With the current chart pattern and levels, I'll be expecting a jump with a target on $10.
🔔 Might drop to $5.70 before another move upwards.
✊🏻 Good luck with your trades! ✊🏻
If you like the idea hit the 👍🏻 button, follow me for more ideas.
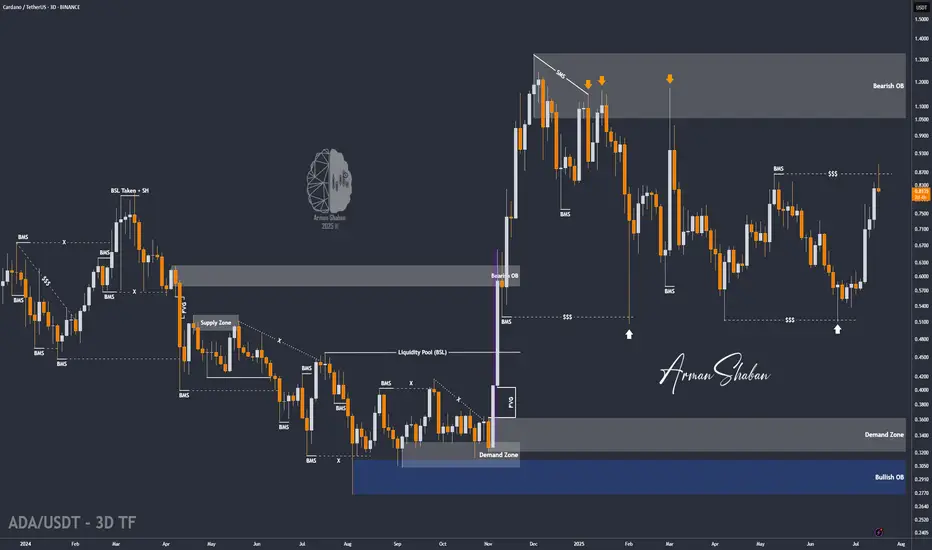
ADA/USDT | BIG Bullish Move Ahead! (READ THE CAPTION)By analyzing the Cardano chart on the 3-day timeframe, we can see that, as expected, the price continued its rally, reaching $0.89 before collecting liquidity above the $0.86 level and then facing a correction. Currently trading around $0.81, we expect the bullish trend to continue after this minor pullback. Key demand zones are at $0.78, $0.69, and $0.61. Based on the previous analysis, the next short- to mid-term bullish targets are $0.93, $1.05, and $1.33.
Please support me with your likes and comments to motivate me to share more analysis with you and share your opinion about the possible trend of this chart with me !
Best Regards , Arman Shaban
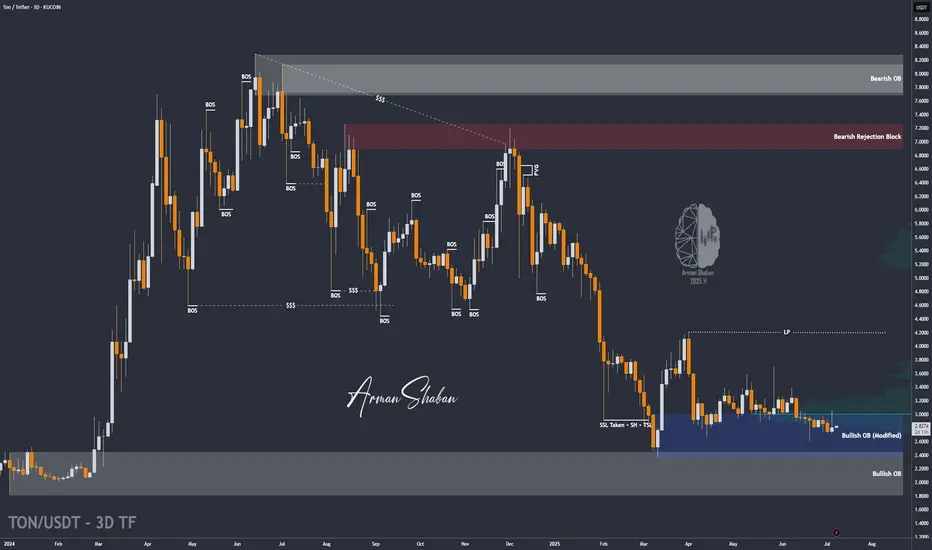
TON/USDT : TON at a Key Breakout Level – Will $3 Hold or Break?By analyzing the TON Coin chart on the 3-day timeframe, we can see that after climbing back to the $3 level, this zone has now turned into a key resistance area. The most important condition for further bullish movement is a strong breakout and confirmation above $3. If that scenario plays out, the next potential upside targets are $3.15, $3.63, $4.20, and $4.68.
⚠️ (A deeper and more detailed analysis is recommended for long-term investment considerations.)
Please support me with your likes and comments to motivate me to share more analysis with you and share your opinion about the possible trend of this chart with me !
Best Regards , Arman Shaban
TradeCityPro | UNI Builds Pressure Below Key Resistance Zone👋 Welcome to TradeCity Pro!
In this analysis, I’ll be reviewing the UNI coin — one of the notable DeFi tokens, currently ranked 27th on CoinMarketCap with a market cap of $254 million.
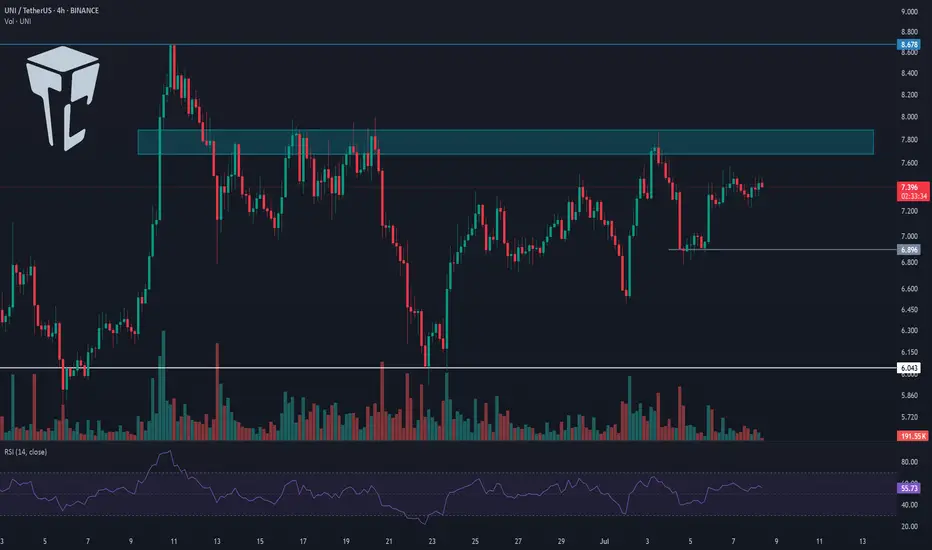
⌛️ 4-Hour Timeframe
On the 4-hour chart, as you can see, UNI has formed a bottom around the 6.043 level, which is considered its key support zone. After reaching this level, the price began an upward move, though the trend appears very weak.
✔️ Currently, there’s a resistance zone just above the price that has previously caused multiple rejections. Once again, the price is moving toward this zone.
📊 The volume during this latest upward leg is very low, which is not a good sign for initiating a bullish trend. If the price reaches this resistance level with such low volume, there's a high likelihood of another rejection.
🔽 If that happens, we could consider opening a short position based on this rejection. However, my main trigger level for a short is the break below 6.896 — I personally would wait for this level to be breached before entering a short position.
✨ The next key support, in case 6.896 is broken, is the 6.043 zone. This is a major support level and could serve as the target for the short trade. If this level is broken as well, it could mark the beginning of a strong downward trend.
🔍 On the other hand, if volume starts to pick up and the resistance zone is broken, we could open a long position. The target for this could be around 8.678 — or even a setup in anticipation of a breakout above 8.678.
🔔 Which scenario you choose depends largely on your market perspective. If you're looking for a short-term trade, the first scenario is more appropriate. But if you're aiming for a long-term position with a wider stop loss, the second scenario would be the better choice.
💥 In either of the long scenarios, I strongly recommend confirming the move with volume. For further confirmation, you can also check if RSI enters the overbought zone.
📝 Final Thoughts
This analysis reflects our opinions and is not financial advice.
Share your thoughts in the comments, and don’t forget to share this analysis with your friends! ❤️
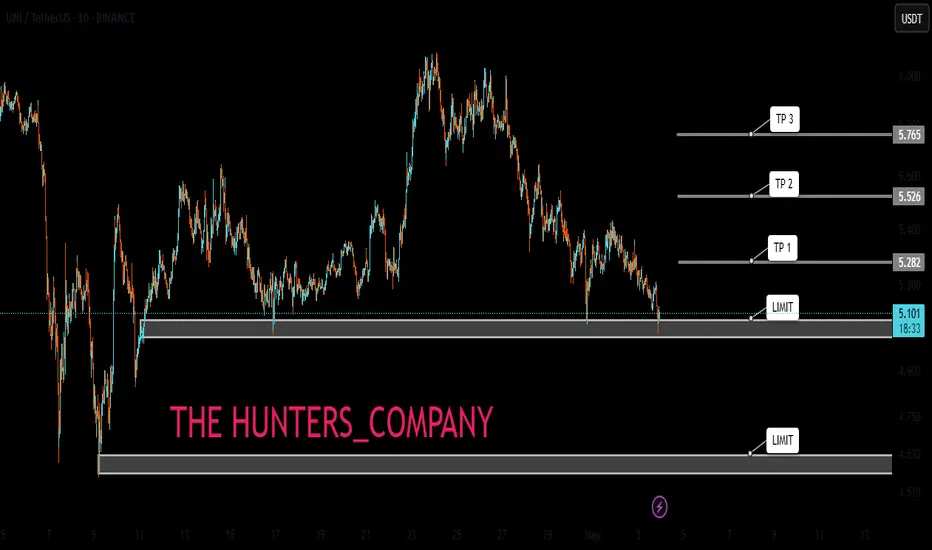
UNI:LIMIT FOR BUY(FREE)Hello friends
Due to the price drop, we can buy on the drop within the specified limits and move with it to the specified targets, of course with capital and risk management.
*Trade safely with us*
UNI - Is it Unique?So getting on UNIUSDT - It looks like a tokyo session move and a liqsurge, opting for the downmoves!

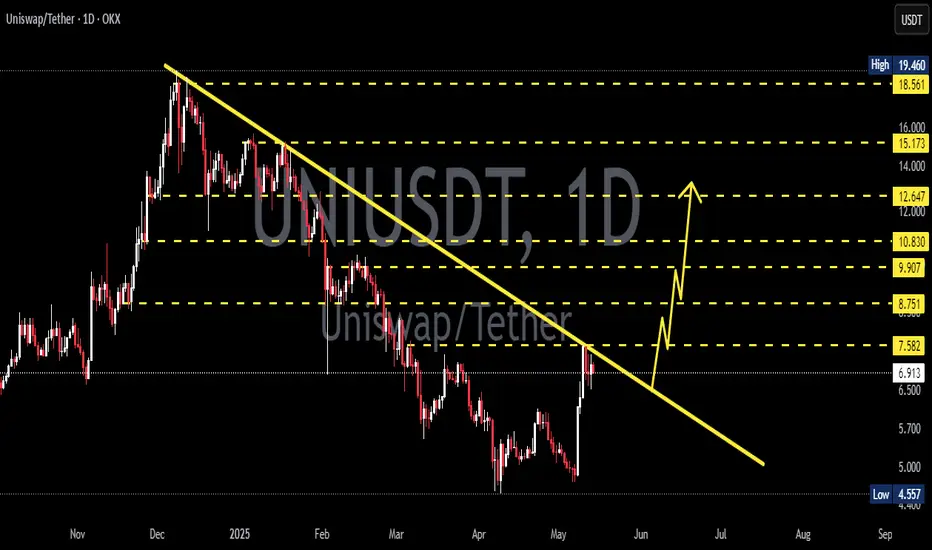
Uniswap UNI price analysis🦄 Despite the weak crypto market, #UNI is holding up quite well at the moment, so you should take it "on a pencil".
At first, the “big money” are buying, and then the news will be rolled out.
🕯 The OKX:UNIUSDT chart shows increased trading volumes.
We wouldn't be surprised if in the coming days, when the market moves into a "range", the price of #UNI shoots up to $9.31 or even $11.21
💰 And globally - the price of $22 per #Uniswap token can still be considered a fairly modest forecast.
_____________________
Did you like our analysis? Leave a comment, like, and follow to get more
#UNI/USDT#UNI
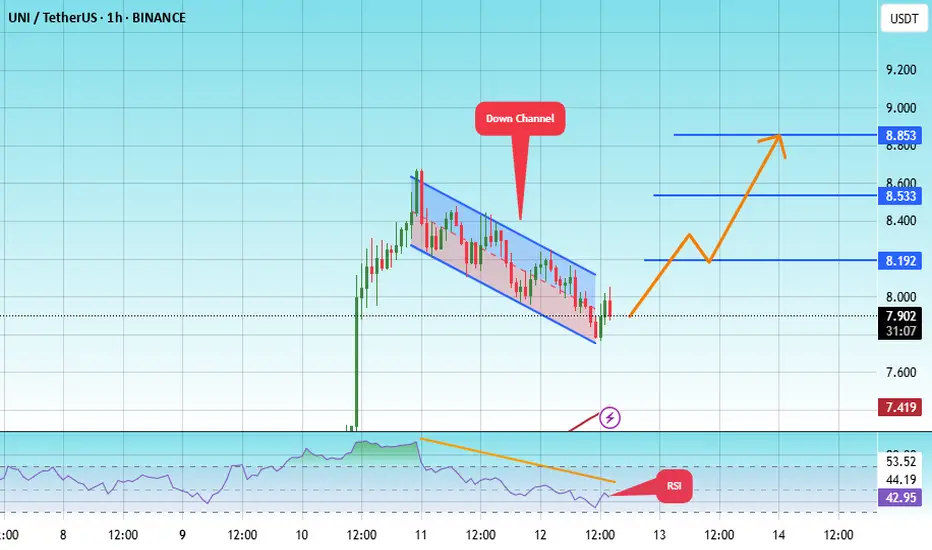
The price is moving within a descending channel on the 1-hour frame, adhering well to it, and is heading toward a strong breakout and retest.
We are experiencing a rebound from the lower boundary of the descending channel, which is support at 7.78.
We are experiencing a downtrend on the RSI indicator that is about to be broken and retested, supporting the upward trend.
We are looking for stability above the 100 Moving Average.
Entry price: 7.85
First target: 8.19
Second target: 8.53
Third target: 8.85
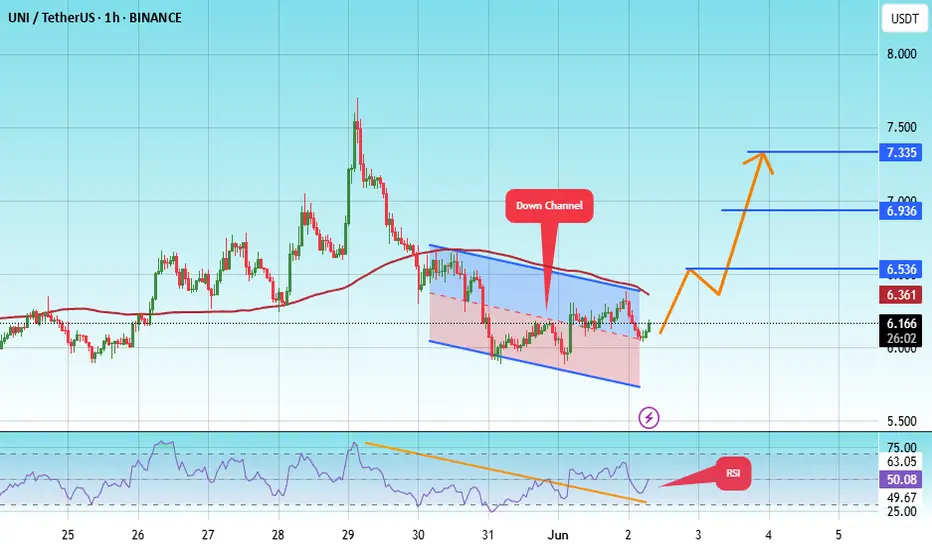
#UNI/USDT#UNI
The price is moving within a descending channel on the 1-hour frame, adhering well to it, and is heading for a strong breakout and retest.
We are experiencing a rebound from the lower boundary of the descending channel, which is support at 5.82.
We are experiencing a downtrend on the RSI indicator, which is about to break and retest, supporting the upward trend.
We are looking for stability above the 100 Moving Average.
Entry price: 6.15
First target: 6.53
Second target: 6.93
Third target: 7.33
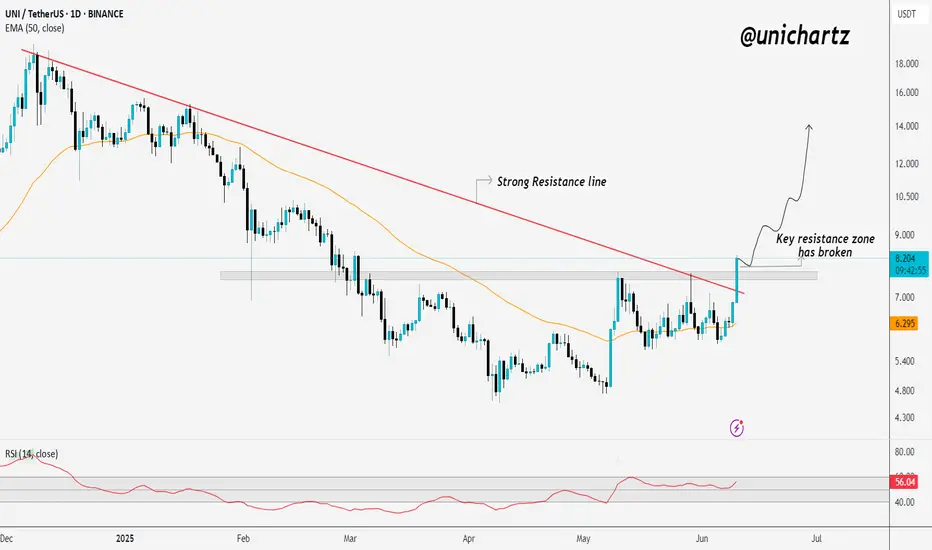
UNI/USDT Breakout: Bulls in Control?BME:UNI / USDT 1D Chart Update
UNI/USDT has just broken above a key resistance zone and cleared the strong descending resistance line.
This breakout is significant; it shifts market structure in favor of the bulls.
As long as UNI holds above the breakout zone, the path is open for further upside.
If momentum continues, we could see a strong move toward higher targets in the coming days.
One to keep a close eye on.
DYOR, NFA
UNISWAP - Long Term Buy Opportunity 🚨MartyBoots here , I have been trading for 17 years and sharing my thoughts on UNI here.🚨
UNI vs ETH | Why Uniswap Deserves a New All-Time High
In this video, we dive deep into the fundamentals of Uniswap (UNI) and explore its close relationship with Ethereum (ETH)—the blockchain it’s built on. While ETH has regained massive attention with its expanding ecosystem and institutional adoption, UNI is still massively undervalued in comparison, despite powering one of the largest DeFi protocols in the world.
⸻
Fundamentals Breakdown:
• Uniswap is the backbone of decentralized trading, facilitating billions in volume without intermediaries.
• Fee switch mechanics and upcoming v4 upgrades have the potential to drive real yield to UNI holders.
• Unlike ETH, which serves as a Layer 1 gas token, UNI represents governance and future revenue potential over a growing protocol.
⸻
Why UNI Has Upside:
• UNI still trades far below its all-time highs—even as Ethereum ecosystem activity rebounds.
• ETH has already made major recovery moves, but UNI hasn’t caught up yet—creating a bullish divergence.
• With the rise of on-chain liquidity, tokenized real-world assets, and institutional DeFi, Uniswap is positioned to be a key infrastructure layer.
⸻
My Thesis:
• ETH = Base Layer | UNI = DeFi Rail
• As ETH grows, Uniswap scales alongside it—capturing more swap volume, TVL, and governance power.
• If Uniswap activates protocol revenue, UNI transitions from a governance token to a yield-bearing asset, giving it real valuation metrics and long-term investor interest.
⸻
Watch to see my full breakdown, including:
• UNI vs ETH price chart comparison
• On-chain stats, dominance shifts, and upcoming catalysts
• Why I believe UNI is set for a breakout back toward new all-time highs
⸻
Like, comment, and follow for more deep-dive crypto breakdowns and technical setups.
#Uniswap #UNI #Ethereum #ETH #CryptoAnalysis #DeFi #TradingView #AltcoinSeason #PineScript #FundamentalAnalysis

UNI. Movement.You can call it sideways movement or a movement in a global ascending channel - imo, both options will be valid for BME:UNI you can expect 60% up move - to the middle of the channel

Should You Invest in Uniswap $UNI Crypto Right Now?Grab your popcorn, or whatever you vibe with—because today I will analyze Uniswap. Yep, the decentralized trading protocol that lets you swap tokens like Pokémon cards, but without asking mom for permission.
So, what is Uniswap? Simple. It’s like the vending machine of the crypto world. Wanna swap your Ethereum CRYPTOCAP:ETH for some Shiba Inu? Go ahead. No sign-up. It’s peer-to-peer, decentralized.
Remember those juicy monthly demand levels at $3.868 and $4.750 we discussed at the Set and Forget Trading Community? Yeah, those weren't just random numbers pulled from a bingo machine. That’s where big buyers stepped in, creating a supply and demand imbalances. Translation: There were way more people wanting to buy than sell, which made the price go UP. Magic? No. Just basic market dynamics, people.
And guess what? Those levels played out beautifully. Buyers showed up, price popped, and if you were patient, you got paid. If you weren’t… well, you can enjoy your bag of regrets.
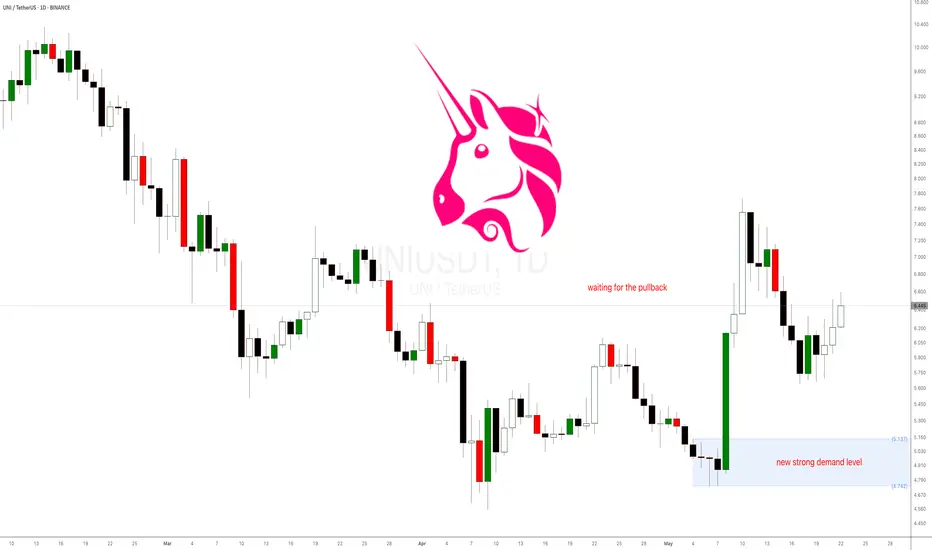
Now, here’s where it gets interesting. The daily timeframe is now trending UP. We’ve officially seen the creation of a fresh imbalance at $5.19. That’s our new price level for buying Uniswap. But are we buying right now? NOPE.
Because here’s the golden rule of trading and investing: Patience is key. I know, I know—it’s boring. Waiting feels like watching paint dry… but on the blockchain. But trust me, the market doesn’t care about your feelings or my feelings.
We're waiting for price to pull back into $5.19, where the last big buyers left a footprint the size of a crypto whale. When will it get there? We don't know. THEN we’ll look to repurchase. Not before.
So remember—Uniswap is a beast in the DeFi world. Supply and demand is your best friend. And above all, don’t chase the pump. Let it come to you. Like a well-trained dog… or a well-behaved altcoin.
UNIUSDT 1D Analysis UNI ~ 1D Analysis
#UNI Buy gradually after successfully breaking through this resistance line with a short-term target of at least 10%++
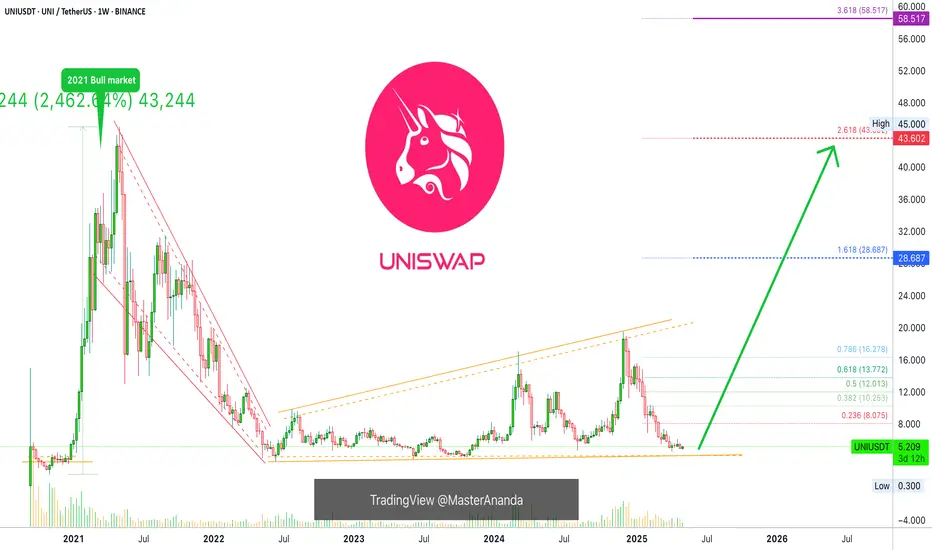
Uniswap Perfect Bullish Chart With New ATH Potential Late 2025Uniswap has a chart with perfect symmetry. It is a beautiful chart, well organized, and it shows a very strong potential for a new All-Time High to be hit later this year or in early 2026.
The market bottom happened in November 2020 for UNIUSDT. This bottom low marked the start of the 2021 bull market which is clearly visible on the chart.
The bull market in 2021 produced a wave totaling 2,462% growth, that's more than 25X.
The same low/level/support that was activated in November 2020 and launched the previous bull market wave was again activated in June 2022. This low marked the 2022 bear market bottom and from this point a long-term consolidation period (sideways market) developed, with higher highs and higher lows.
There was a major low in August 2024 and the last one, April/May 2025. The current low can be equated to something similar to November 2020, from this point on, we will not see small waves as in the past three years but a major bull market. Like 2021 but much bigger. It will be huge.
A new All-Time High is not only possible but very easy for this pair, very easy...
The action will push prices beyond what is shown on this chart.
Timing is great. Prices are great. This is an easy buy and hold.
After you buy, the market will grow for months and months and months before peaking. You can't go wrong with bottom prices. The time to buy is now, when prices are low.
Namaste.
UNI / USDT - A Perfect RetestEvening fellas,
Refer to my last calls. They all worked out.
Now don't miss out on UNI cause it's gonna run within the next days. It'll be beautiful!
Trade thirsty, my friends!

UNI Uniswap Breakdown. Support Hit but is there More Downside?🔎 I'm currently analyzing UNI/USDT (Uniswap paired with Tether) and observing a clear bearish trend 📉 on the daily timeframe. Price has recently tapped into a key support zone 🟦, and we’re now seeing a short-term retracement from that level.
However, with Bitcoin currently overextended ⚠️ and showing signs it may pull back, there's a strong possibility that UNI could continue to drop if BTC rolls over. Correlation plays a major role here. 📊
In this video, I break down essential elements of the chart:
📌 Market Structure
📌 Price Action
📌 The prevailing Trend
📌 Key Support & Resistance Zones
You'll also hear my personal take on a potential trade setup — if price action continues to unfold in line with the criteria discussed.
📚 This content is for educational purposes only and is not to be considered financial advice. 🚫💼
UNI Price Action Breakdown. Support Hit but is there More Downside?

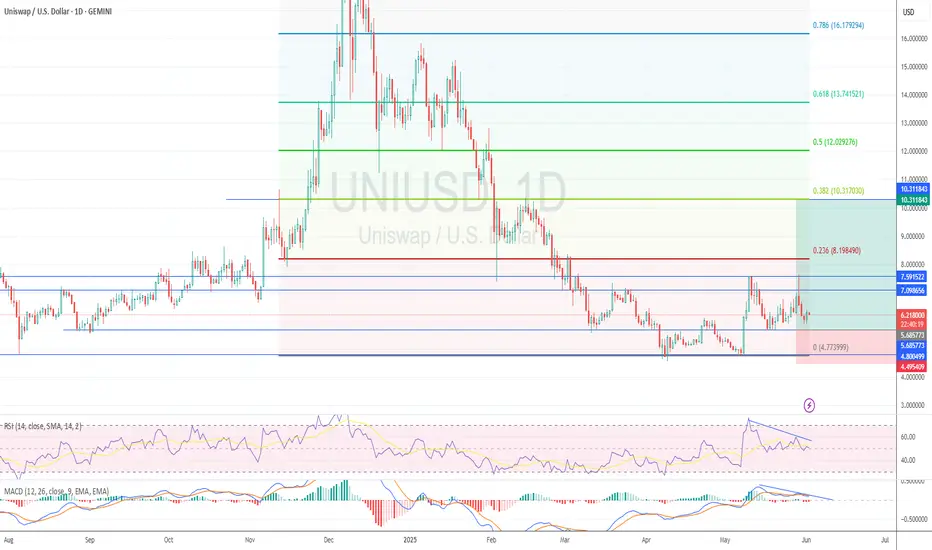
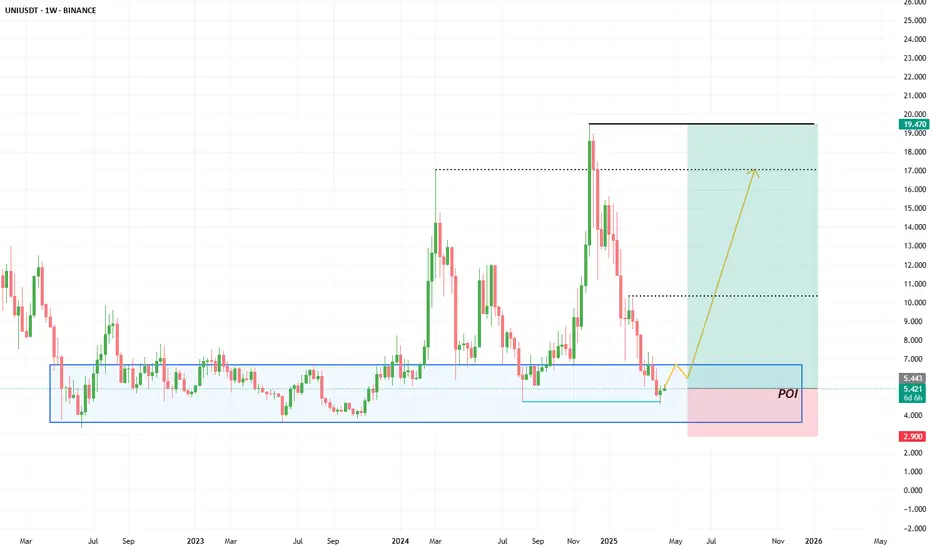
UNI — Time to Accumulate? A Clean Long-Term SetupUNI is the native token of the Uniswap DEX — and it's finally back in our interest zone.
After a brutal 70% correction from previous highs, price has retraced into a key accumulation range between $3.60 – $6.76.
This isn’t just another alt — UNI is a fundamental token that arguably deserves a place in every long-term portfolio.
Spot entry around $5.50 looks reasonable, with higher timeframe targets at $10.35, $17.03, and $19.47.
No overtrading here — just a clean long-term thesis. Accumulate, sit back, and let the narrative unfold.
More thoughts in my profile @93balaclava
Personally I trade on a platform that offers low fees and strong execution. DM me if you're interested.
Short-Term Short Position UNI/USDT🔥 UNI/USDT – Approaching Key Short Zone
Uniswap (UNI) has formed a rising wedge structure after rebounding from local lows. Price is now nearing a critical short zone around 5.762 – 5.804, where sellers could potentially step in if UNI fails to break above with conviction.
🟣 Zone to Watch
“Possible Short Zone” (in purple) — a high-probability entry area for short trades given the overhead resistance and wedge convergence.
🔴 Entry Points:
Entry 1: ~5.762 (initial level)
Entry 2: ~5.804 (upper boundary)
📉 Momentum & Setup
Chart Formation: The rising wedge often suggests bullish exhaustion; a decisive break below wedge support can signal a bearish shift.
Volume Consideration: Look for a sell-volume uptick or a clear rejection around 5.70 – 6.2 to confirm the short setup.
🟢 Take-Profit Zones
✅ TP1: ~5.549
✅ TP2: ~5.315
✅ TP3: ~4.957
✅ TP4: ~4.244 (Extended downside if momentum persists)
❌ Invalidation Level: 6.265+
(A strong close above this level indicates a bullish breakout from the short window.)
🧠 Narrative
This setup highlights a possible bearish retest, as UNI’s rebound has propelled price into a narrowing wedge near major resistance. Should buyers fail to push beyond 5.70, aggressive sellers may anticipate a correction. A volume-backed rejection here could see UNI retrace to lower support levels.
🎲 Market Context
Monitor broader crypto sentiment and Bitcoin’s performance; strong market momentum could negate the bearish bias, while a market-wide pullback may accelerate downside.
📌 Risk Management
Position Sizing: Adjust to your risk tolerance and never overexpose.
Stop-Loss: Place it above 6.265+ to avoid unexpected breakouts.
Remain flexible and reevaluate if price action shows continued strength above the wedge.

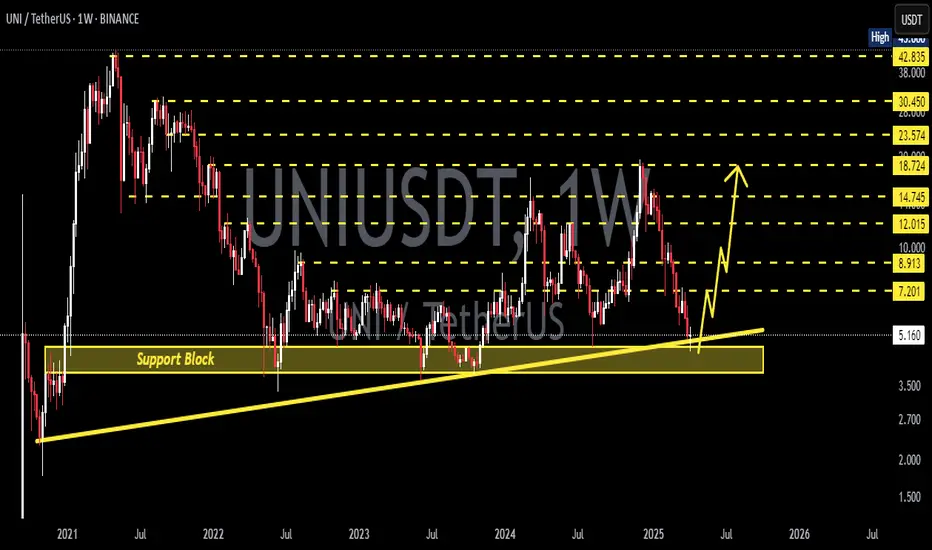
UNIUSDT 1WUNI ~ 1W Analysis
#UNI If you still have a Conviction on this coin, maybe this support you can consider to start buying back with a minimum target of 20%+.
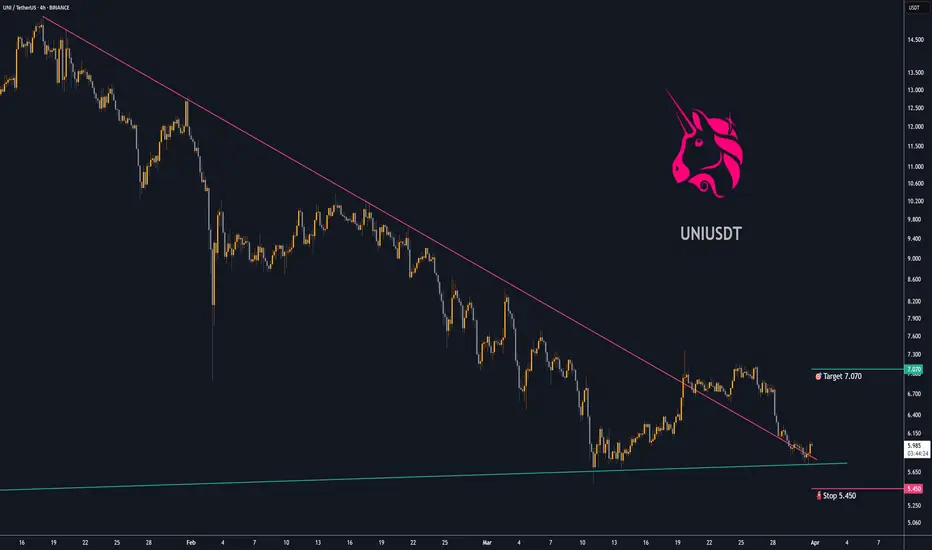
Trading opportunity for UNIUSDTBased on technical factors there is a Buy position in :
📊 UNIUSDT
🔵 Buy Now
🪫Stop loss 5.450
🔋Target 7.070
📏 R/R 2
💸RISK : 1%
We hope it is profitable for you ❤️
Please support our activity with your likes👍 and comments📝