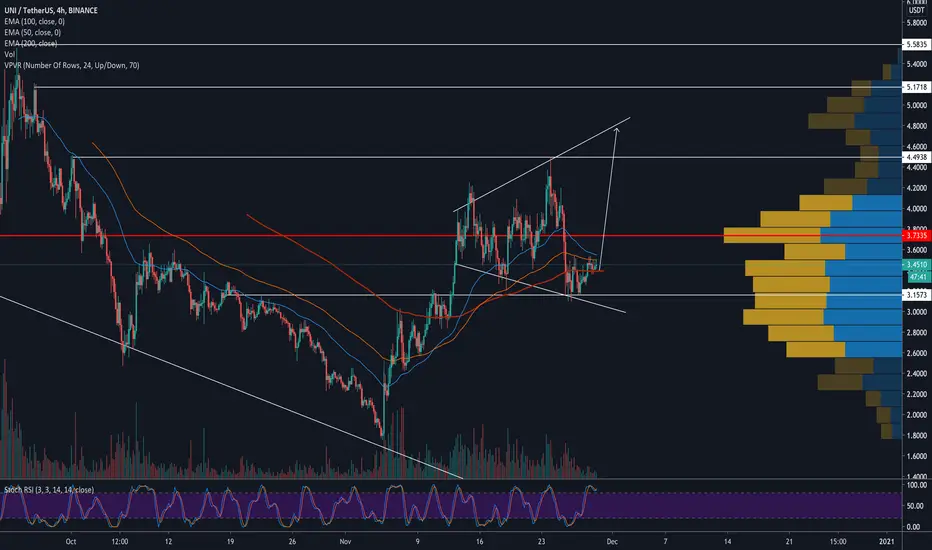
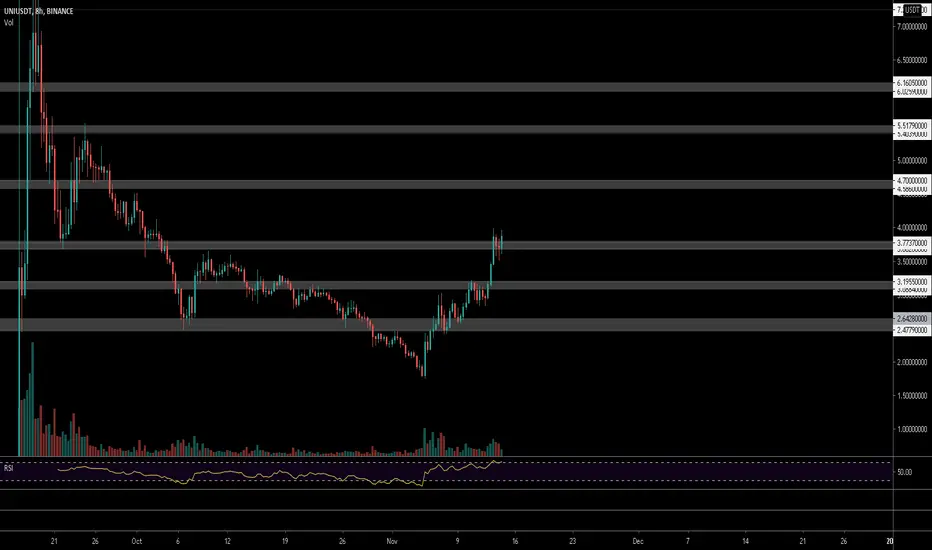
UNI-4h. Struggle for the trend line and level 3.22.UNI price consolidation in the range of $3.22-4.2 continues.
Sellers broke the growth trend line from November 9 and push the price to the bottom of the consolidation.
Trading volumes fell significantly from November 27. If sellers break the level of $ 3.22 down - it will provoke a sharp continuation of the fall to $ 2.55.
____________
We create both short-term ideas (for a local understanding of the market situation) and medium-term forecasts of price movements.
Subscribe to us and get daily concise analytics!
UNIUSD

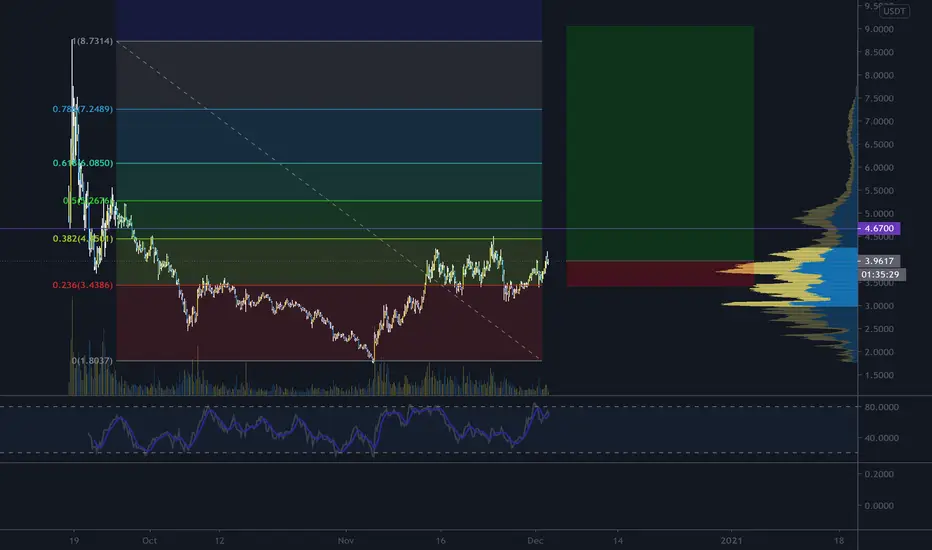
Uniswap UNIUSDT - Higher prices, bullish pattern (rectangle)- UniSwap is looking great, creating tripple top formation which usually leads to big pumps
- Rectangle consolidation pattern, we are holding lows and bulls are interested in buying
- We have finished first Elliott wave and we are ready for upcoming third wave
- 1.618 fib extension looks like great target for 3rd wave
- UNI is ready to pump again
If you want more of these ideas, please hit the like button and follow me, so you don't miss any update!
Also, check my signature down below ↓

UNI (Uniswap) - Long playHigh R/R, stop below fib/support line. Looking to target ATH +.
This may take weeks to play out, so a swing long position. Would TP at point shown (above ATH) and let some run.
One of the few 'majors' in the Defi sphere not to have started its run yet.
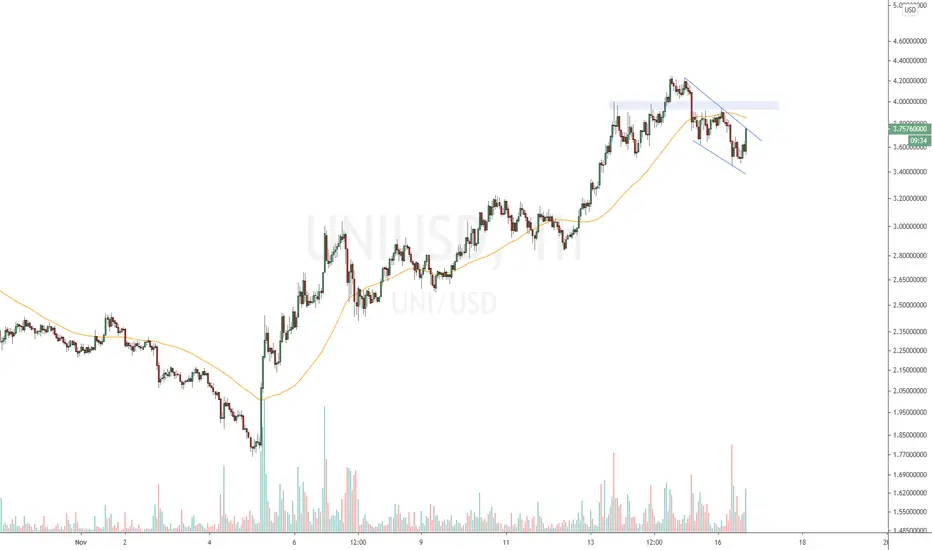
UNI about to explodeBINANCE:UNIUSD
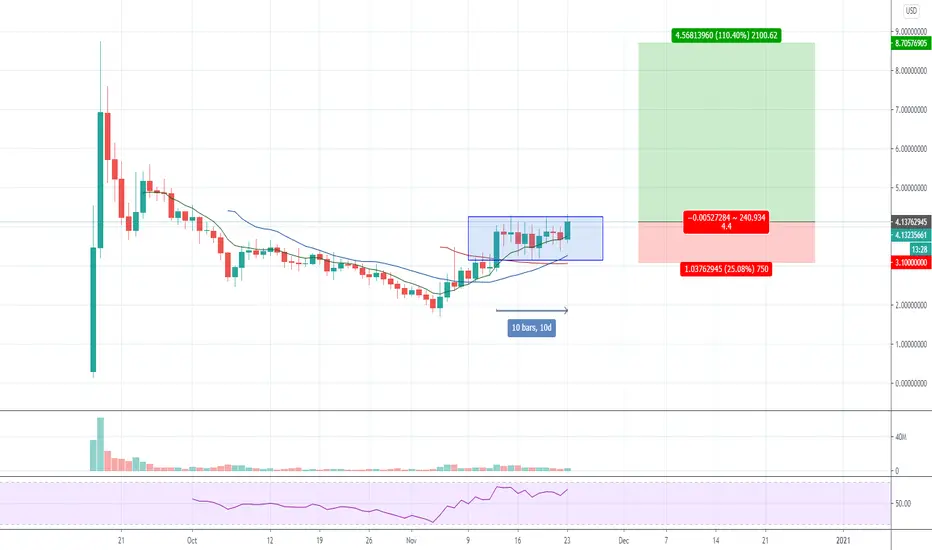
As you can see in the chart, Uniswap bottom at about $1.74 USD on November, it rallied to about $4.0 USD, and has been forming a High Base Pattern for about 10 days. And now it seems that it is about to break it to the upside. To confirm it, we need to close above $4.3 USD.
www.freeonlinetradingeducation.com
The tarde would be to get in now, with a stop at $3.10 USD, and a price target at all-time highs. Risk-reward ratio 4.4 to 1.
I hope you find this interesting, and good luck to you
UNIUSDTif UNI can break out its 4h resistance it can start a bullrun.
on the other side it can go downward and break its trend line and go to hell...
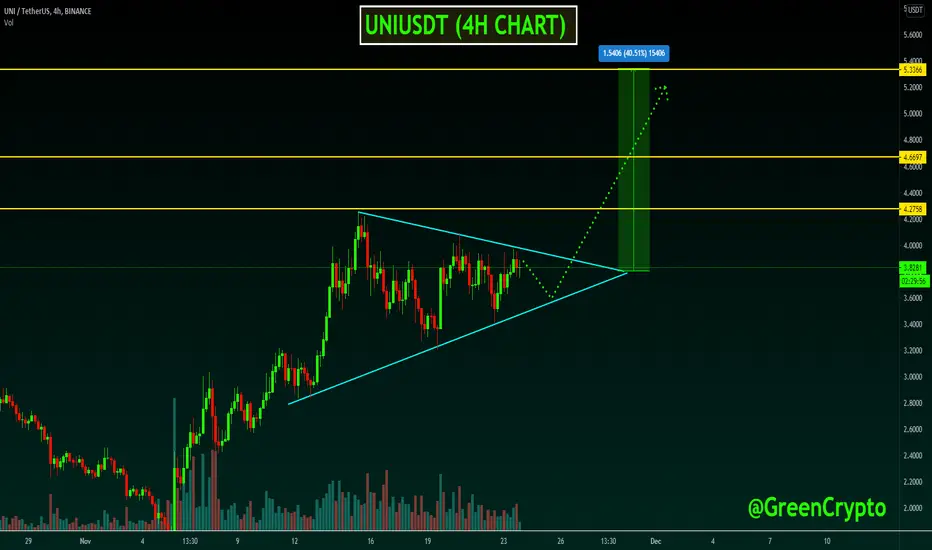
UNIUSDT (UNISWAP) Symmetric Triangle PatternUNI/USDT currently trading at $3.83
LONG ENTRY: Enter long after Symmetric Triangle Breakout in 4 h chart
STOP LOSS: I will update soon
Resistance level 1(Target) : $4.27
Resistance Level 2(Target): $4.67
Resistance level 3 (target) : $5.34
Max Leverage: 10X
ALWAYS KEEP STOP LOSS...
Please Follow our Tradingview Account, Like, Share and Comment your thoughts
UNI IS AT A MAKE OR BREAK MOMENT! CAN IT BREAK $4?!?!This is not trading or investment advice, this is simply for your entertainment and to document my predictions. We are forming an ascending bullish triangle. If we can't keep support above $3.5, then we will go back down to $3.0. However, if we go get above $4 and turn old resistance into new support, we will then begin to work on a bull rally to $5. Can't wait to find out. Watch the whole video to get the whole story.

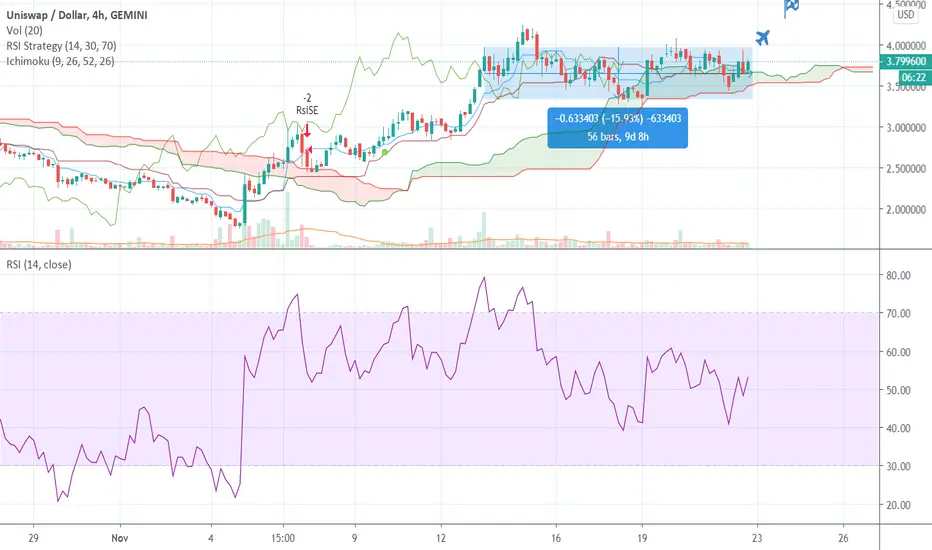

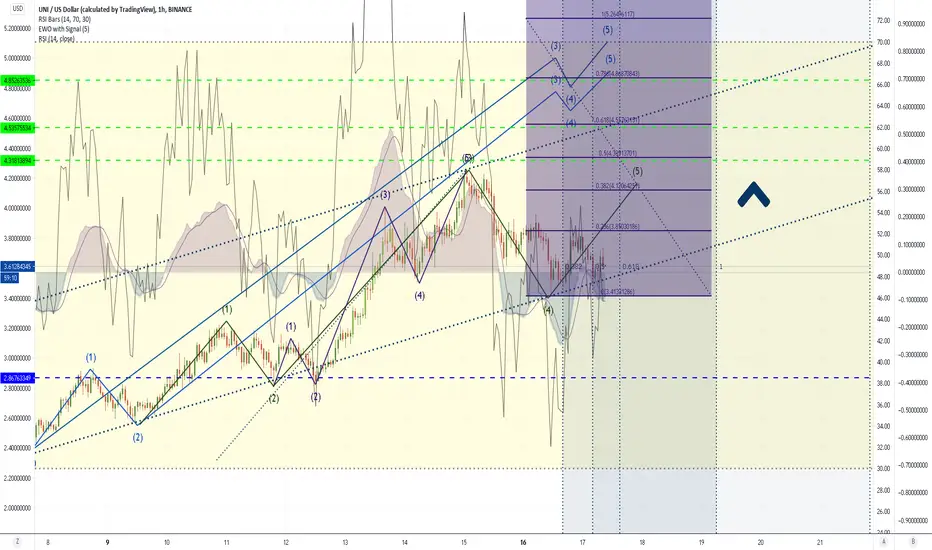
Uniswap UNIUSDT - Elliott Wave + Parallel channel- I'm expecting another wave up to complete Elliott Impulse Wave
- Head and Shoulders reversal pattern between wave 4-5
- I see an ascending parallel channel, that can serve as resistance in the future
If you want more of these ideas, please hit the like button and follow me, so you don't miss any update!
Also, check my signature down below ↓

Bullish pattern breakout can it reach its measured target?*DISCLAIMER: I am not a financial advisor and this is not financial advice as these are purely my opinions and speculations. I may also own or trade any of the symbols and cryptocurrencies mentioned in this video so do not make your trading or investing decisions based on this video. I do not guarantee any results nor am I responsible for your actions. You should always do your own due diligence before trading or investing in this market as it is extremely risky. Affiliate links are also included in this same video description section here and if you decide to support me by using any of them, I may receive a referral bonus or commission.
*Follow me for the latest cryptocurrency analyses on my watchlist
*Thank you to those who donated, I very much appreciate it.
*Let me know in the comment section if you agree or disagree, would love to hear your ideas too.

UNI LONG Trade 20201112Symbol: UNIUSD,UNIUSDT
Indicator: 9 Seasons Rainbow Multi TimeFrames Pattern PRO
Timeframes: 15M -12H
Signal: Red ->Green
I appreciate your like or comment. Welcome to share your idea here.
PM the author for a trial of "9 Seasons Rainbow Multi TimeFrames Pattern".
DISCLAIMER
This is only a personal opinion and does NOT serve as investing NOR trading advice.
Please make your own decisions and be responsible for your own investing and trading Activities.
Trade closed manually: Closed when the above ribbons turns Yellow or Red.

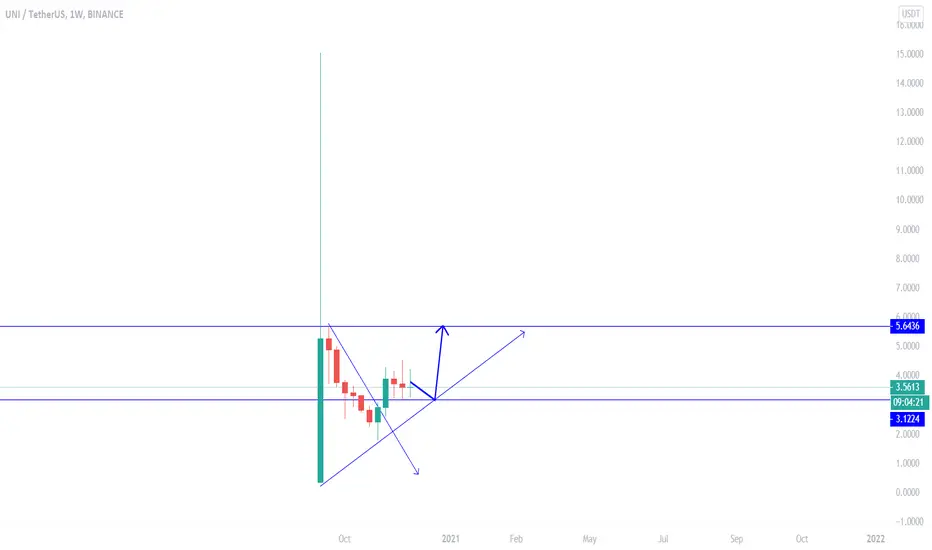
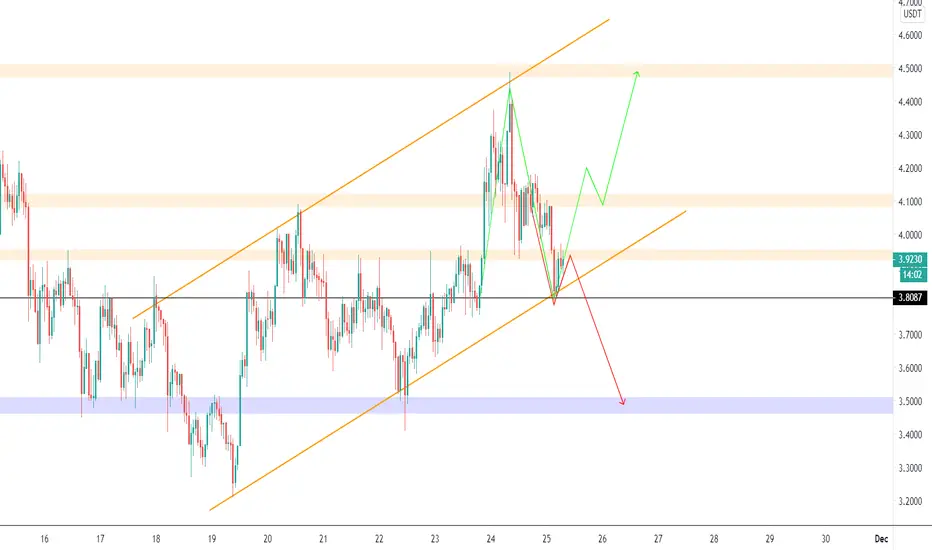
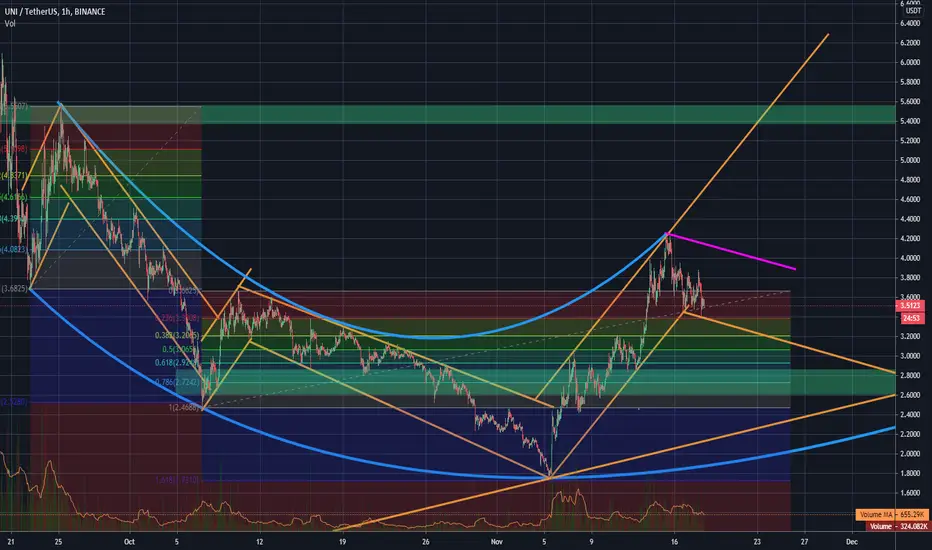
UNI consolidation is comingNice periodicity on the UNI chart. When the purple line is broken, this consolidation will go to the lower green zone. If this is not the case, another upper point will be confirm using the blue parabola or there will be continue a bull orange line with confirmations about price of 5,368$ - 5,565$ on upper green zone.
Now UNI is testing about middle term high. Middle term low was confirm with FIB 1,618. This is second time, what this was went for 2 months.
Reversal pattern apparent where it can price action bounce?*DISCLAIMER: I am not a financial advisor and this is not financial advice as these are purely my opinions and speculations. I may also own or trade any of the symbols and cryptocurrencies mentioned in this video so do not make your trading or investing decisions based on this video. I do not guarantee any results nor am I responsible for your actions. You should always do your own due diligence before trading or investing in this market as it is extremely risky.
*Follow me for the latest cryptocurrency analyses on my watchlist
*Thank you to those who donated, I very much appreciate it.
*Let me know in the comment section if you agree or disagree, would love to hear your ideas too.

UNI is bullish. UNIUSDSimilar pattern to KNC and a number of cryptos as well, actually. This one is a fairly advanced fractal, so I have pained some targets in. We are moving up, ask me how. As always, target in green, invalidation in red. Let's roll. Don't be stupid, this is not financial advice.
UNIUSD Bull FlagUNIUSD is building a bull flag on the 1 hr chart. Alts seem to be perking up lately and Uniswap stands to benefit from that. Keep an eye on this one to see if it can make a clean break.
UNIUSDT - GOOD ZONEUniswap is looking very good. Started the retracement to the trendline.
If you like my analyse and if you want to get more analyses from me, please don't forget to push like to this post.

UNIUSD long entry. retest resistance. pump long close wickThe price of uni is moving up, and this could be an entry for a long.
This could be one of those typical short duration dumps to shake out the longs with tight stop loses
support and resistance i based on current and older data.

$UNI, Reached ~3.77$ & hodling it$UNI
Reached ~3.77$ & hodling it
Daily showing a buy signal from UCTS for the 1st time
If manages to keep pushing (volume needed), then higher targets may be achieved as continuation (~4.5$)
On pullback, aim for ~3.2$ that was not retested since breakout(entry - R/S flip)
#UNI
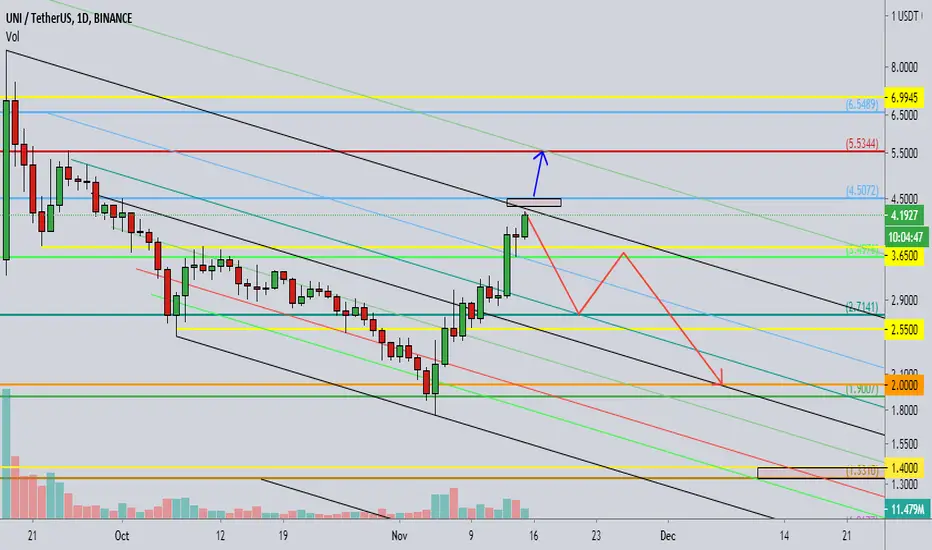
Uni 1D Global thoughtsIn recent days, Uni's growth has been amazing, surpassing our expectations from the previous idea.
Now, the Uni price is reaching the liquid zone $4.35-4.50.
The Uni price fixing above this zone will open the way to the next level $5.50.
If sellers become active, then the first significant stop of the fall should be expected no earlier than $2.70.
______________________________
Each "like under the idea" boosts the level of our happiness by 0.05%. If we help you to be calmer and richer - help us to be happier :)