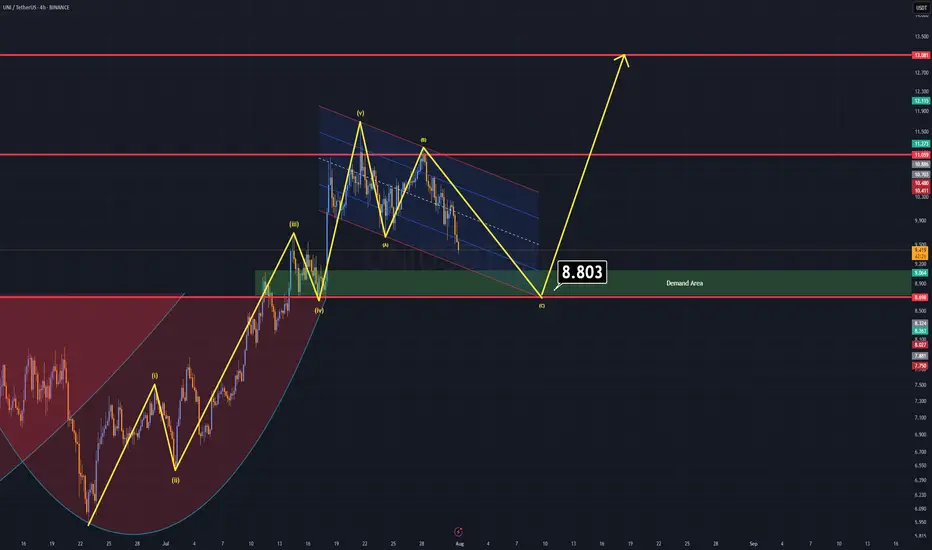
UNI Analysis (4H)UNI – Correction Might Bring Opportunity
Currently, UNI is forming an A–B–C corrective pattern, and based on technical structure, this correction may complete around the $8.8 level.
Key Zone to Watch: $9.0 – $8.5
There's a strong demand zone just below $9, supported by historical price action.
On the daily time frame, a broken cup & handle formation aligns perfectly with this area — the old neckline may now act as support, increasing the confluence.
This overlap of structure and demand makes the $9–$8.5 zone a favorable entry for a long position.
Once price reaches this area, expect a significant upward correction as part of the next move in the cycle.
Good Luck.
Uniusdt
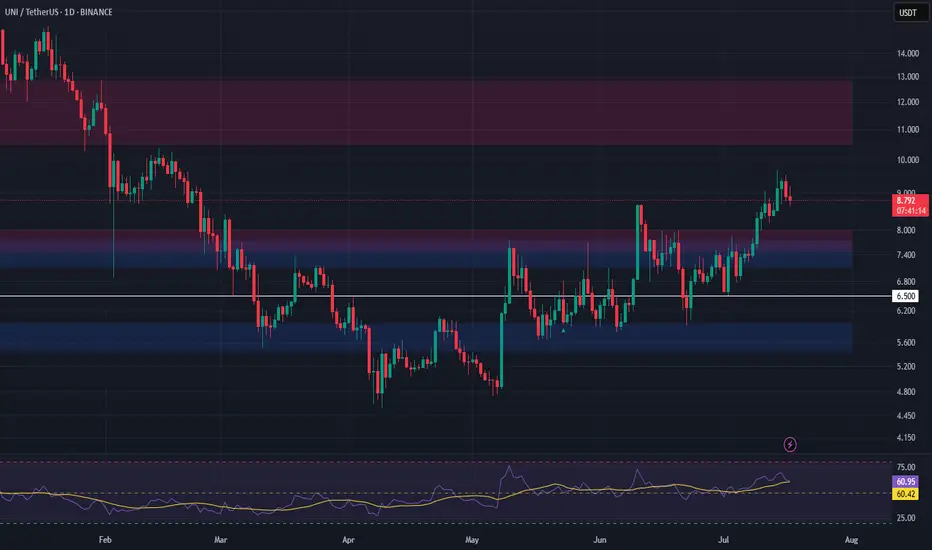
Watch Uniswap’s $10 Defense For 16% Breakout Toward $12.5Hello✌
Let’s analyze Uniswap ’s upcoming price potential 📈.
BINANCE:UNIUSDT is currently trading near a key confluence zone that includes the psychological round number of 10, a daily timeframe support level, and a Fibonacci retracement area. If this zone holds, there is potential for a 16% upside move toward the 12.5 level , making it a setup worth monitoring in the coming sessions. 📊🔍
✨We put love into every post!
Your support inspires us 💛 Drop a comment we’d love to hear from you! Thanks , Mad Whale

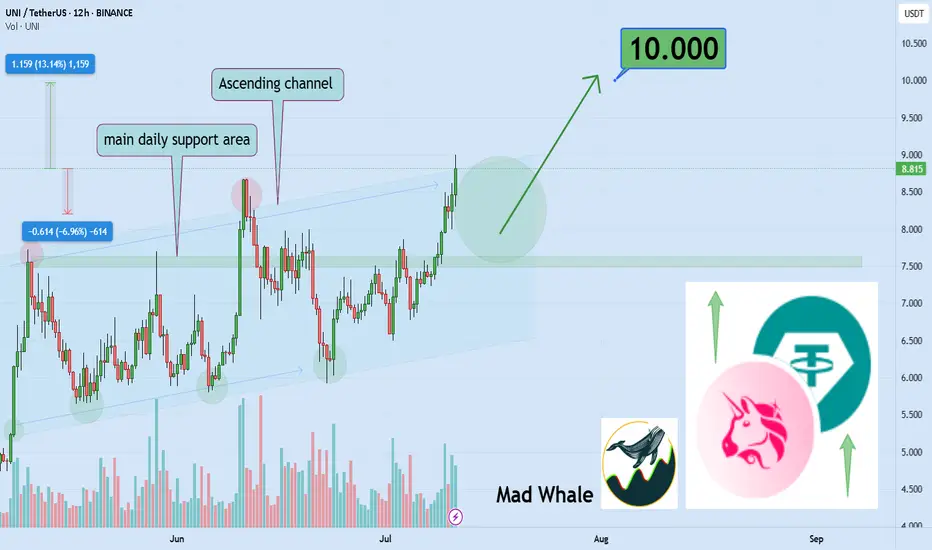
UNI up 13% – is $10 the next stop?Hello✌
let’s dive into a full analysis of the upcoming price potential for Uniswap 📈.
BINANCE:UNIUSDT has maintained solid bullish structure within a well-formed ascending channel and is now approaching a key daily support zone. Recent volume spikes and a 13% price increase indicate growing buying interest. A breakout above the channel resistance could open the way toward the psychological target at $10, a level watched by many traders. Monitoring price action and volume confirmation here is essential for potential trend continuation. 📈🧠
✨ Need a little love!
We pour love into every post your support keeps us inspired! 💛 Don’t be shy, we’d love to hear from you on comments. Big thanks , Mad Whale 🐋
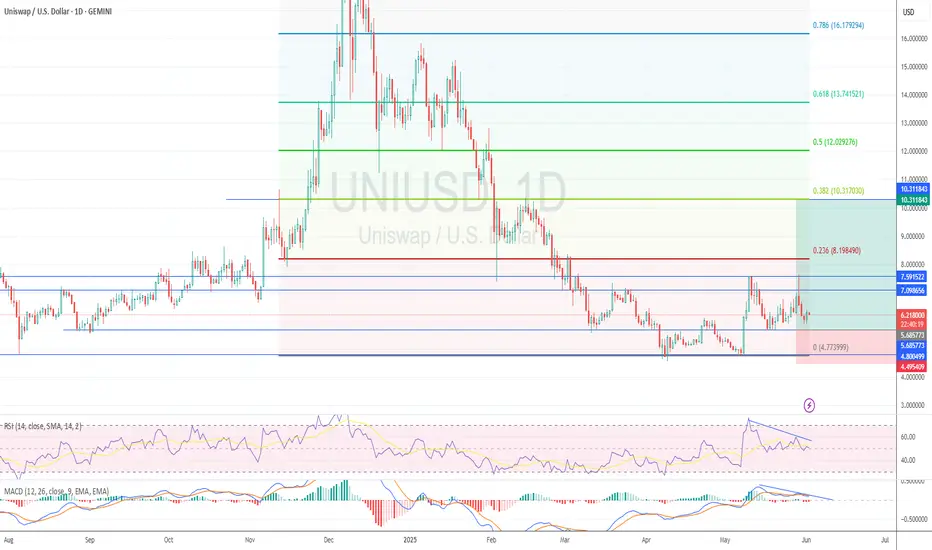
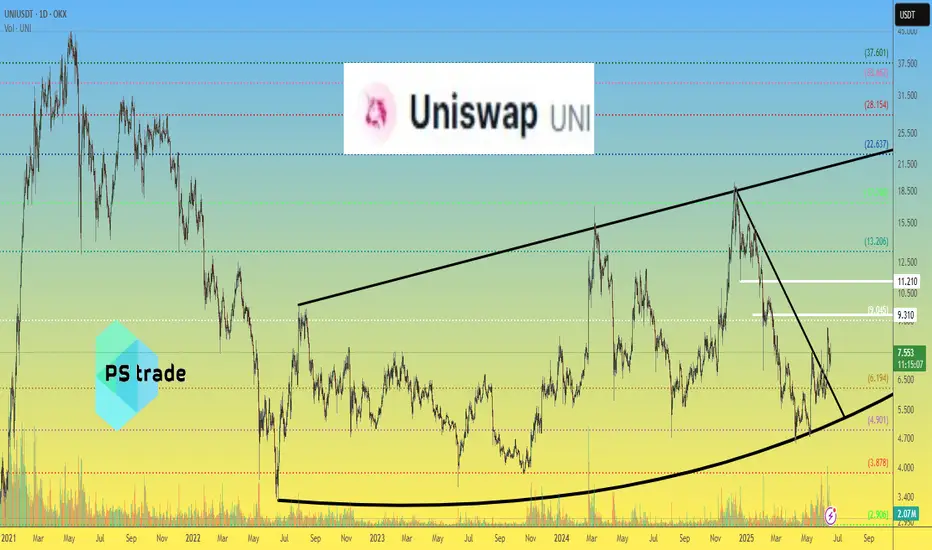
Uniswap Exits Opportunity Buy Zone · $73 & $118 2025 ATH TargetUniswap is finally out of its long-term opportunity buy zone, a trading range that was activated first in 2022 and remained valid for a long time.
After October 2023, UNIUSDT produced two bullish moves but each time fell back into this zone. Orange/brown on the chart. Notice how this zone matches price action happening below EMA89, EMA55, MA200, EMA144 and EMA233. As Uniswap turned bullish and fully confirmed, it broke above all this major levels.
Last week, it managed to close above the really long EMA233 and this week the action is staying above. Currently $10.30.
Notice waves "1" and "2" these are relatively small waves. Something will happen with #3. The market evolves exponentially. Instead of another similar wave going a bit higher, it will be something like 2021. Not like 2021 in the sense that it will reach similar price levels, but in the sense that it will be completely out of proportion with what you saw in the last several years. Prices will go off-the chart.
We can think of resistance as a new all-time high being found around $73 and $118, but this time I only want to call your attention to this moment now. The fact that market conditions are changing and it is still early when we focus on the long-term.
I just realized that I might be seeing things differently and it is hard to visualize, for someone without the actual experience, what is about to happen. But despair not because that is the one reason why I am here and why you are reading this. I am here to alert you, remind you and prepare you for an event before it happens. In this way, you can profit and achieve your financial goals. I want to give you value in exchange for your trust. Will you trust? Uniswap is going up. Crypto is going up and it will be the best since 2021. Possibly the best bull market in the history of Crypto, the new regulatory framework and global adoption is saying so.
Thanks a lot for your continued support.
Namaste.

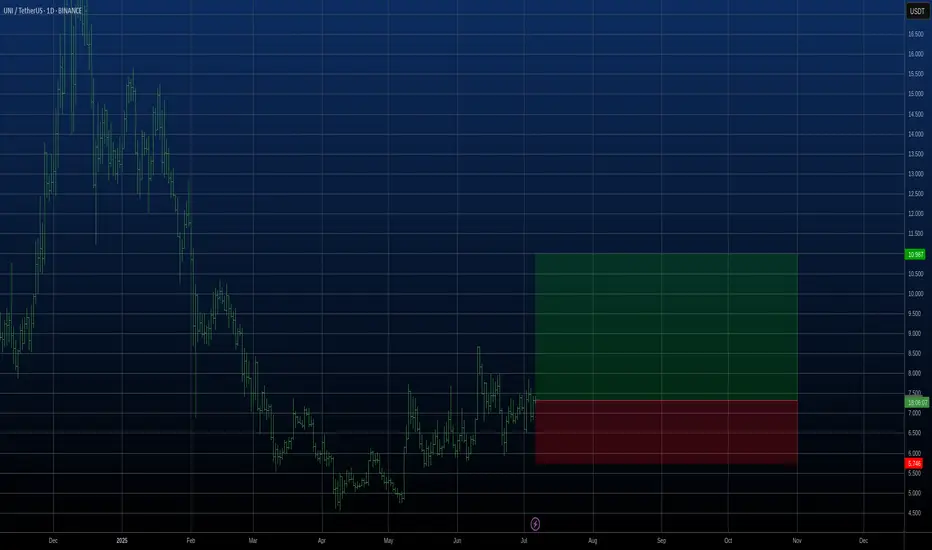
$UNI - $10 from here?Hi guys! 👋🏻
🔔I'll be trying this setup for Uniswap
🔔 We have bounced from the strong support at $4.80, which we retested in April 25 and May 7 forming a pattern impersonating a double bottom
🔔 With the current chart pattern and levels, I'll be expecting a jump with a target on $10.
🔔 Might drop to $5.70 before another move upwards.
✊🏻 Good luck with your trades! ✊🏻
If you like the idea hit the 👍🏻 button, follow me for more ideas.
UNI Market Cap Breakout Signals Major Repricing Ahead 🚀📈 UNI Market Cap Breakout Signals Major Repricing Ahead 💥💹
Forget the December highs. That spike? It came with a bloated market cap and little real growth. T oday, it’s different.
UNI has reclaimed the key $10 level, but more importantly, its market cap structure is breaking out after years of compression — and that’s where the real alpha lives.
🔍 Technical View (Market Cap-Driven)
🔹 UNI broke above the $10.94 price zone with strong momentum
🔹 Currently retesting the $9.73 breakout base — a critical zone for bullish continuation
🔹 Market cap structure targets:
– Next milestone: $14.72 (aligned with local resistance)
– Macro extension target: $17.70, corresponding to a market cap near $18.08B
This puts UNI at the doorstep of a major repricing phase.
🧠 Why This Time Is Different
✅ Market Cap Breakout – We’re not just looking at price anymore. The structure on the market cap chart shows accumulation and a clean breakout from multi-year compression.
✅ Whale Activity – Addresses holding 1M+ UNI are growing fast. Over $60M in UNI was moved off exchanges in July alone.
✅ Protocol Expansion
– Uniswap v4 is imminent, introducing Hooks, dynamic fees & native ETH support
– Unichain L2 has now hit 6.3M wallets and 147M txs, growing faster than expected
✅ DeFi Rotation – Capital is rotating back into blue-chip DeFi. Uniswap isn’t just riding that wave — it’s helping define it.
🏁 What We’re Watching
🟦 Support: $9.73 – this must hold for continuation
🟩 Target 1: $14.72
🟩 Target 2: $17.70 (aligned with $18.08B mcap)
🟨 Risk zone below: $9.03 – invalidation if daily closes below
This is not about retesting old prices. It’s about rewriting the valuation story.
The UNI bulls aren't just hunting a T-bone — they’re after a full 8-figure steak. 🥩🧠
One Love,
The FXPROFESSOR 💙
D isclosure: I am happy to be part of the Trade Nation's Influencer program and receive a monthly fee for using their TradingView charts in my analysis. Awesome broker, where the trader really comes first! 🌟🤝📈

A good moment to try to Buy UNIA good moment to try to buy UNI. We see a strengthening upward trend and now we are closer to the lower border of this trend. We put a stop behind the local low of the sideways. Let's see...
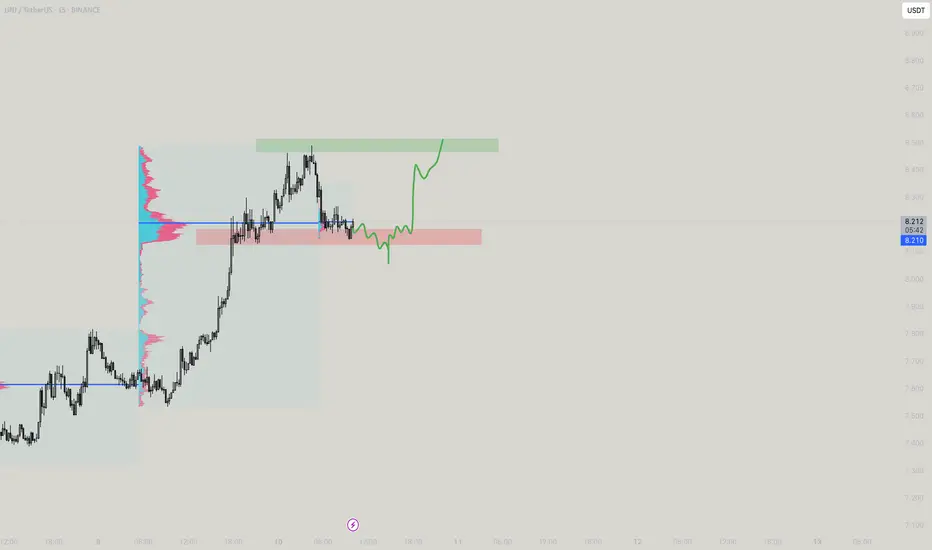
UNI Long Setup – Breakout Retest into High-Confluence SupportUniswap (UNI) has broken out of resistance and is now pulling back into a high-confluence zone, forming a strong bullish structure. The $7.13–$7.73 area presents a favorable entry on the retest.
📌 Trade Setup:
• Entry Zone Around: $7.13 – $7.73
• Take Profit Targets:
o 🥇 $10.50 – $12.85
• Stop Loss: Daily close below $6.50
UNI - One more Unified Trade!As seen here, looks to go up, little bit of liq dump is needed for further up
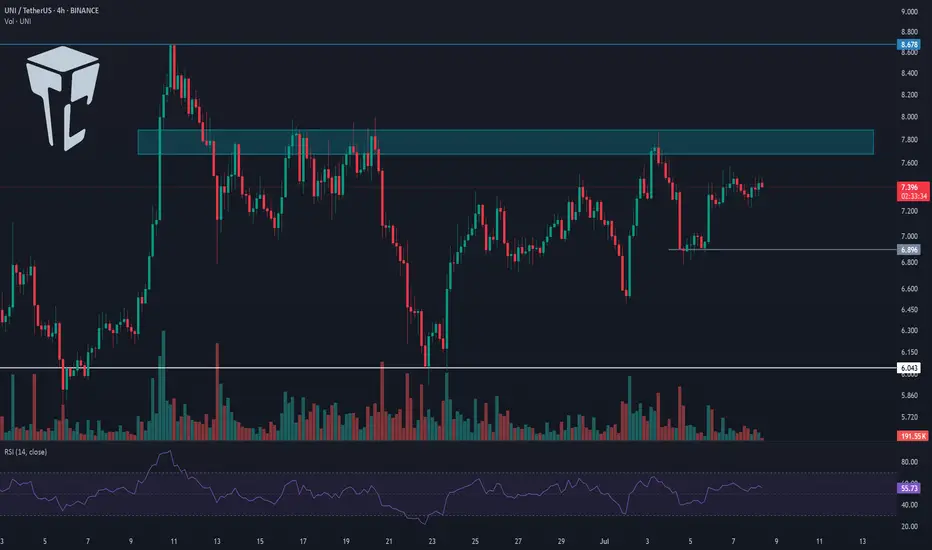
TradeCityPro | UNI Builds Pressure Below Key Resistance Zone👋 Welcome to TradeCity Pro!
In this analysis, I’ll be reviewing the UNI coin — one of the notable DeFi tokens, currently ranked 27th on CoinMarketCap with a market cap of $254 million.
⌛️ 4-Hour Timeframe
On the 4-hour chart, as you can see, UNI has formed a bottom around the 6.043 level, which is considered its key support zone. After reaching this level, the price began an upward move, though the trend appears very weak.
✔️ Currently, there’s a resistance zone just above the price that has previously caused multiple rejections. Once again, the price is moving toward this zone.
📊 The volume during this latest upward leg is very low, which is not a good sign for initiating a bullish trend. If the price reaches this resistance level with such low volume, there's a high likelihood of another rejection.
🔽 If that happens, we could consider opening a short position based on this rejection. However, my main trigger level for a short is the break below 6.896 — I personally would wait for this level to be breached before entering a short position.
✨ The next key support, in case 6.896 is broken, is the 6.043 zone. This is a major support level and could serve as the target for the short trade. If this level is broken as well, it could mark the beginning of a strong downward trend.
🔍 On the other hand, if volume starts to pick up and the resistance zone is broken, we could open a long position. The target for this could be around 8.678 — or even a setup in anticipation of a breakout above 8.678.
🔔 Which scenario you choose depends largely on your market perspective. If you're looking for a short-term trade, the first scenario is more appropriate. But if you're aiming for a long-term position with a wider stop loss, the second scenario would be the better choice.
💥 In either of the long scenarios, I strongly recommend confirming the move with volume. For further confirmation, you can also check if RSI enters the overbought zone.
📝 Final Thoughts
This analysis reflects our opinions and is not financial advice.
Share your thoughts in the comments, and don’t forget to share this analysis with your friends! ❤️
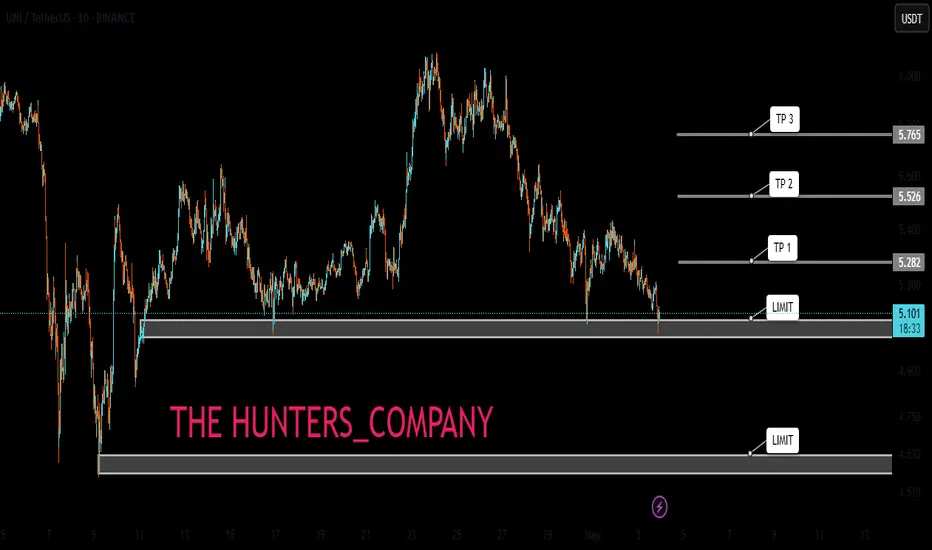
UNI:LIMIT FOR BUY(FREE)Hello friends
Due to the price drop, we can buy on the drop within the specified limits and move with it to the specified targets, of course with capital and risk management.
*Trade safely with us*
You are UNI! Not UNIC!I mean you are unique!! But this is more unique in its place and we see the moves to be more more more precendented!
UNI - Is it Unique?So getting on UNIUSDT - It looks like a tokyo session move and a liqsurge, opting for the downmoves!

Uniswap UNI price analysis🦄 Despite the weak crypto market, #UNI is holding up quite well at the moment, so you should take it "on a pencil".
At first, the “big money” are buying, and then the news will be rolled out.
🕯 The OKX:UNIUSDT chart shows increased trading volumes.
We wouldn't be surprised if in the coming days, when the market moves into a "range", the price of #UNI shoots up to $9.31 or even $11.21
💰 And globally - the price of $22 per #Uniswap token can still be considered a fairly modest forecast.
_____________________
Did you like our analysis? Leave a comment, like, and follow to get more
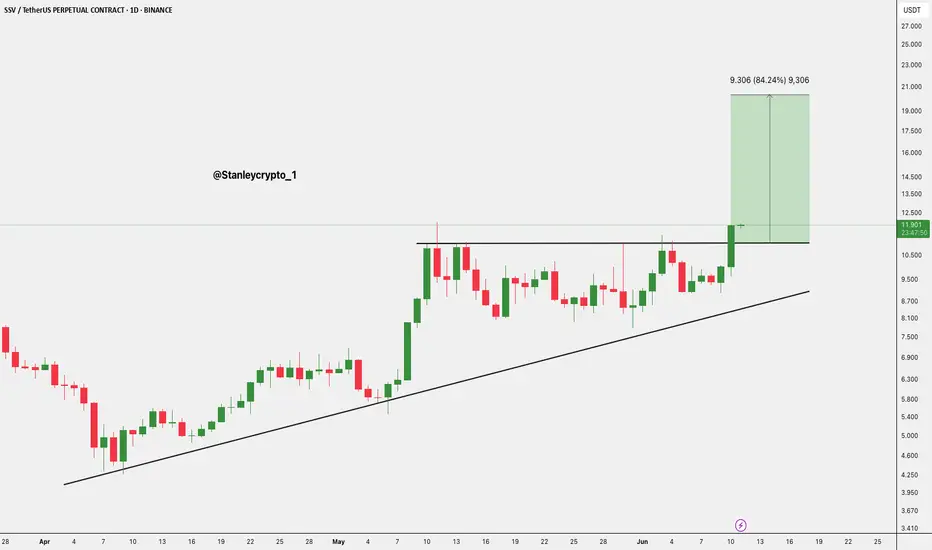
$SSV/USDT has broken out$SSV/USDT has broken out of a key ascending triangle on the daily chart, clearing resistance around $11.90 with strong momentum.
The breakout targets an 84% potential upside toward the $21+ zone.
As long as it holds above the breakout level, the trend remains bullish with further gains likely.
Watch for a retest for possible entry.
DYRO, NFA
$PNUT/USDT Breakout Trade Setup$PNUT / USDT - Breakout Trade Setup.
Entry: $0.2963 - $0.3002
Stop Loss: $0.2682
Targets: $0.3603 / $0.4305 / $0.4891
Breakout & retest of descending trendline
60 %+ upside potential
DYOR | NFA

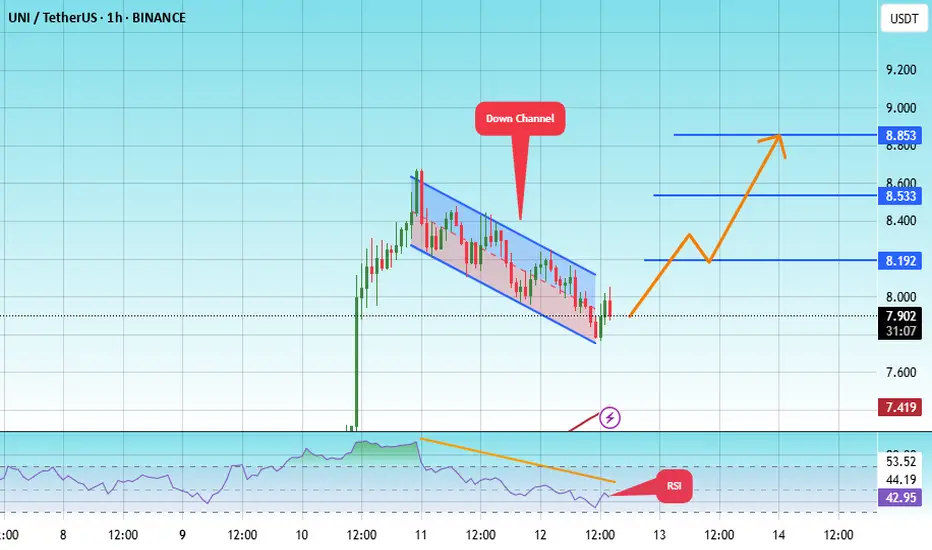
#UNI/USDT#UNI
The price is moving within a descending channel on the 1-hour frame, adhering well to it, and is heading toward a strong breakout and retest.
We are experiencing a rebound from the lower boundary of the descending channel, which is support at 7.78.
We are experiencing a downtrend on the RSI indicator that is about to be broken and retested, supporting the upward trend.
We are looking for stability above the 100 Moving Average.
Entry price: 7.85
First target: 8.19
Second target: 8.53
Third target: 8.85
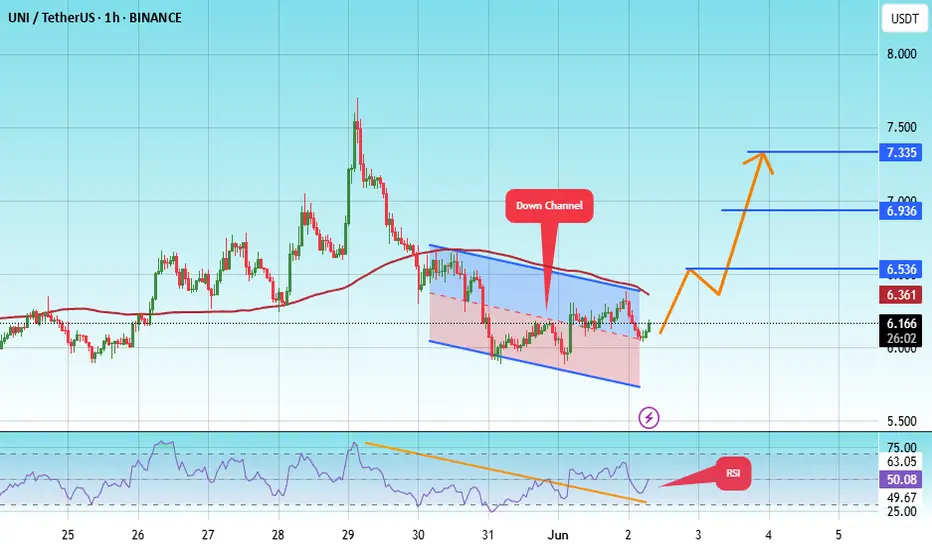
#UNI/USDT#UNI
The price is moving within a descending channel on the 1-hour frame, adhering well to it, and is heading for a strong breakout and retest.
We are experiencing a rebound from the lower boundary of the descending channel, which is support at 5.82.
We are experiencing a downtrend on the RSI indicator, which is about to break and retest, supporting the upward trend.
We are looking for stability above the 100 Moving Average.
Entry price: 6.15
First target: 6.53
Second target: 6.93
Third target: 7.33
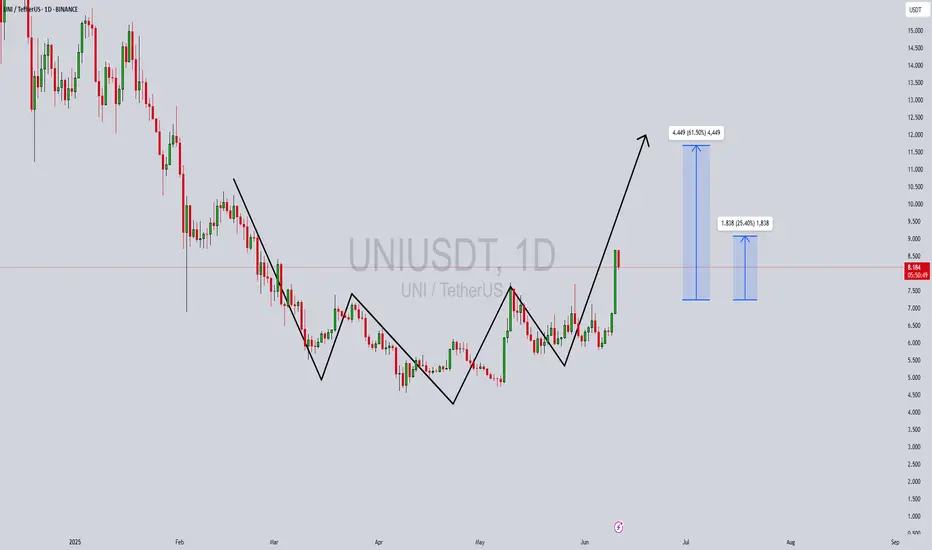
UNIUSDT Forming Bullish ReversalUNIUSDT is showing a classic bullish reversal pattern, marked by a clear W-shaped recovery, which is often a strong signal for trend reversal in crypto markets. The recent breakout has come with good volume support, further validating the strength of this move. The price action suggests a clean structure of higher highs and higher lows, indicating the start of a potential upward leg. Based on the pattern and momentum, we can expect a price gain in the range of 50% to 60% in the coming sessions.
From a technical perspective, this bullish formation aligns with an inverse head-and-shoulders structure, often seen at the end of prolonged downtrends. The price has reclaimed key resistance levels and is now consolidating above them, a sign that buyers are stepping in with confidence. The clear breakout candle and measured move projection both support the potential target range of $12 to $13 in the near term.
Fundamentally, UNI continues to be one of the most recognized names in the DeFi space, and growing ecosystem updates have attracted renewed interest from both retail and institutional investors. The recent uptick in trading volume and social media chatter surrounding UNI indicates rising momentum and strong investor sentiment. As the market rotates back into high-utility tokens, UNI is likely to remain in the spotlight.
For traders, keeping an eye on short-term pullbacks or consolidation zones around $8.00–$8.50 could offer ideal entries before the next breakout leg begins. Overall, UNIUSDT stands poised for a major bullish continuation if current market conditions persist and broader crypto sentiment remains positive.
✅ Show your support by hitting the like button and
✅ Leaving a comment below! (What is You opinion about this Coin)
Your feedback and engagement keep me inspired to share more insightful market analysis with you!
$UNI Breakout: 400% Target AheadCRYPTOCAP:UNI just broke out from its long-term accumulation zone around $4.000–$4.801, gaining +30% this week.
The market structure has turned bullish, with the next major target near $19–$24, a potential 400% upside.
As long as UNI holds above the breakout zone, further gains look likely.
Watch this one closely.
DYOR, NFA.

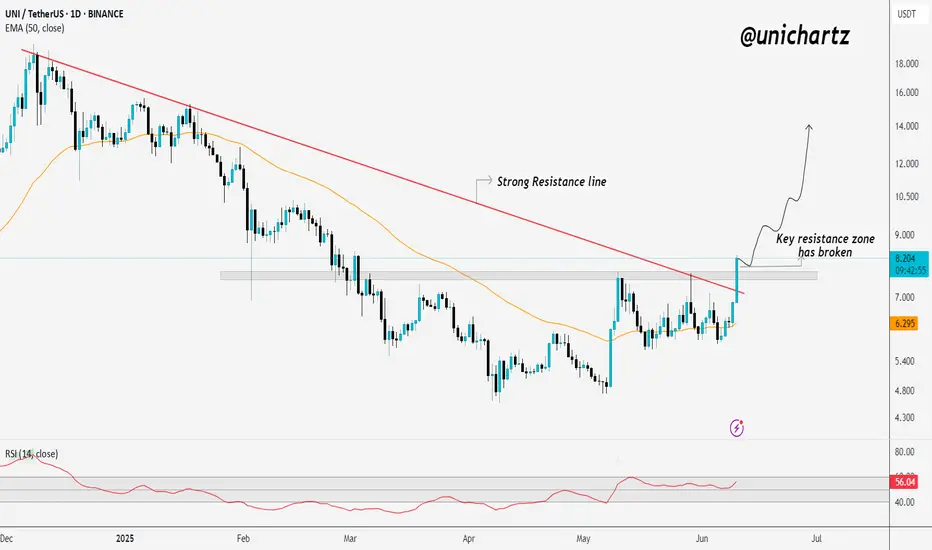
UNI/USDT Breakout: Bulls in Control?BME:UNI / USDT 1D Chart Update
UNI/USDT has just broken above a key resistance zone and cleared the strong descending resistance line.
This breakout is significant; it shifts market structure in favor of the bulls.
As long as UNI holds above the breakout zone, the path is open for further upside.
If momentum continues, we could see a strong move toward higher targets in the coming days.
One to keep a close eye on.
DYOR, NFA
UNISWAP - Long Term Buy Opportunity 🚨MartyBoots here , I have been trading for 17 years and sharing my thoughts on UNI here.🚨
UNI vs ETH | Why Uniswap Deserves a New All-Time High
In this video, we dive deep into the fundamentals of Uniswap (UNI) and explore its close relationship with Ethereum (ETH)—the blockchain it’s built on. While ETH has regained massive attention with its expanding ecosystem and institutional adoption, UNI is still massively undervalued in comparison, despite powering one of the largest DeFi protocols in the world.
⸻
Fundamentals Breakdown:
• Uniswap is the backbone of decentralized trading, facilitating billions in volume without intermediaries.
• Fee switch mechanics and upcoming v4 upgrades have the potential to drive real yield to UNI holders.
• Unlike ETH, which serves as a Layer 1 gas token, UNI represents governance and future revenue potential over a growing protocol.
⸻
Why UNI Has Upside:
• UNI still trades far below its all-time highs—even as Ethereum ecosystem activity rebounds.
• ETH has already made major recovery moves, but UNI hasn’t caught up yet—creating a bullish divergence.
• With the rise of on-chain liquidity, tokenized real-world assets, and institutional DeFi, Uniswap is positioned to be a key infrastructure layer.
⸻
My Thesis:
• ETH = Base Layer | UNI = DeFi Rail
• As ETH grows, Uniswap scales alongside it—capturing more swap volume, TVL, and governance power.
• If Uniswap activates protocol revenue, UNI transitions from a governance token to a yield-bearing asset, giving it real valuation metrics and long-term investor interest.
⸻
Watch to see my full breakdown, including:
• UNI vs ETH price chart comparison
• On-chain stats, dominance shifts, and upcoming catalysts
• Why I believe UNI is set for a breakout back toward new all-time highs
⸻
Like, comment, and follow for more deep-dive crypto breakdowns and technical setups.
#Uniswap #UNI #Ethereum #ETH #CryptoAnalysis #DeFi #TradingView #AltcoinSeason #PineScript #FundamentalAnalysis

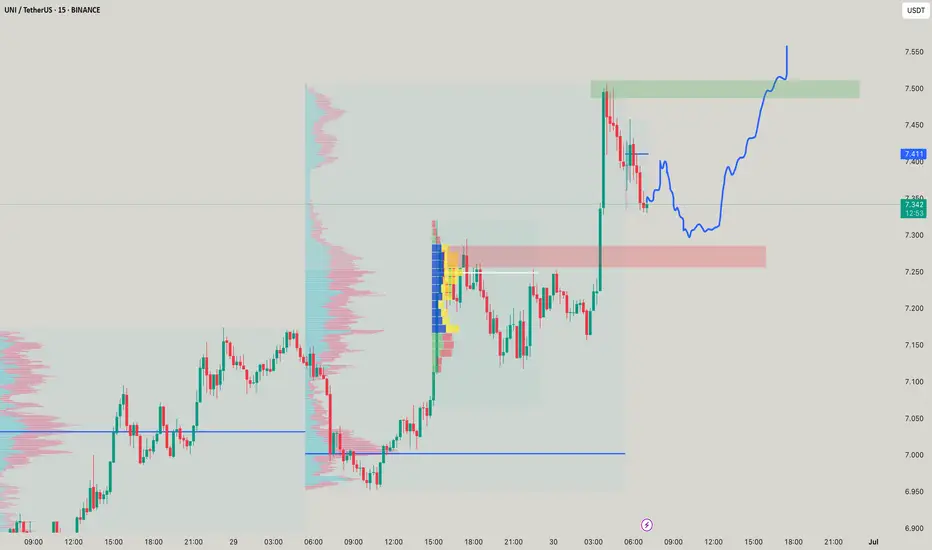
UNI Sell/Short Setup (4H)The overall structure in UNI is bearish, considering the recent CH (Change of Character) observed in the swing.
The price is currently below the resistance line, and if it approaches the premium zone of the previous minor wave, we can look for sell/short positions based on UNI’s overall outlook. The zone where we are interested in entering a position is marked with a red circle.
The target can be the green box.
A daily candle close above the invalidation level would invalidate this analysis.
For risk management, please don't forget stop loss and capital management
When we reach the first target, save some profit and then change the stop to entry
Comment if you have any questions
Thank You
