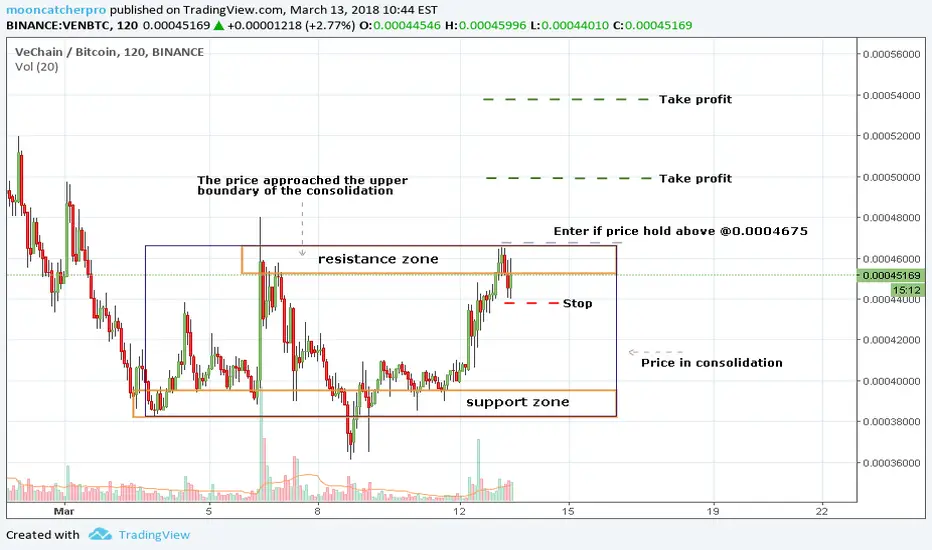
VENBTC (Volume Analysis Prediction 3/13/2018)The market remains bearish
VEN Moves on its own
Now the price is near the upper boundary of the consolidation
If the price break out 0.0004675, We can see a good uptrend.
Entry point: 0.0004675
Stop: 0.00043785
Target1: 0.000499
Target2: 0.0005379
Up

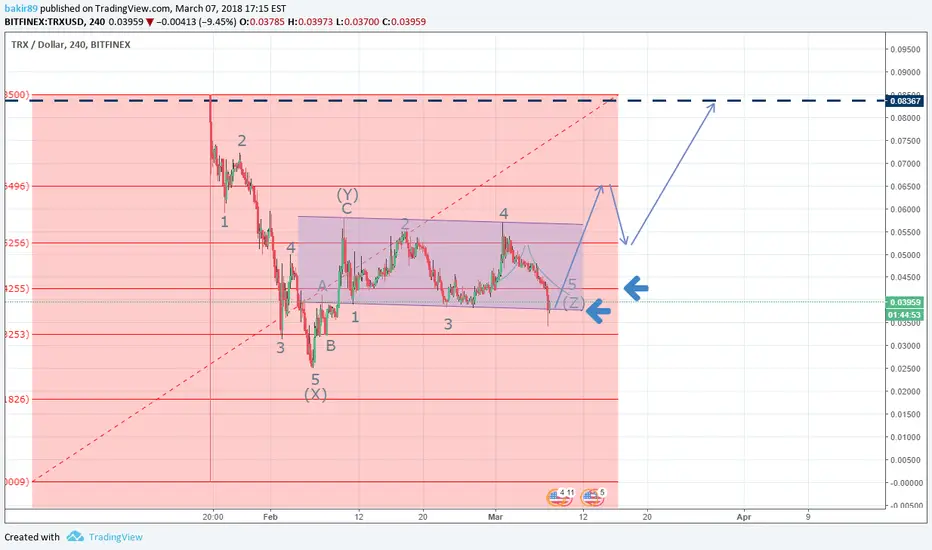
update 2 TRX/USD the green season just started the correction is finished and now i think that tron will go to 0,08000
see my last idea
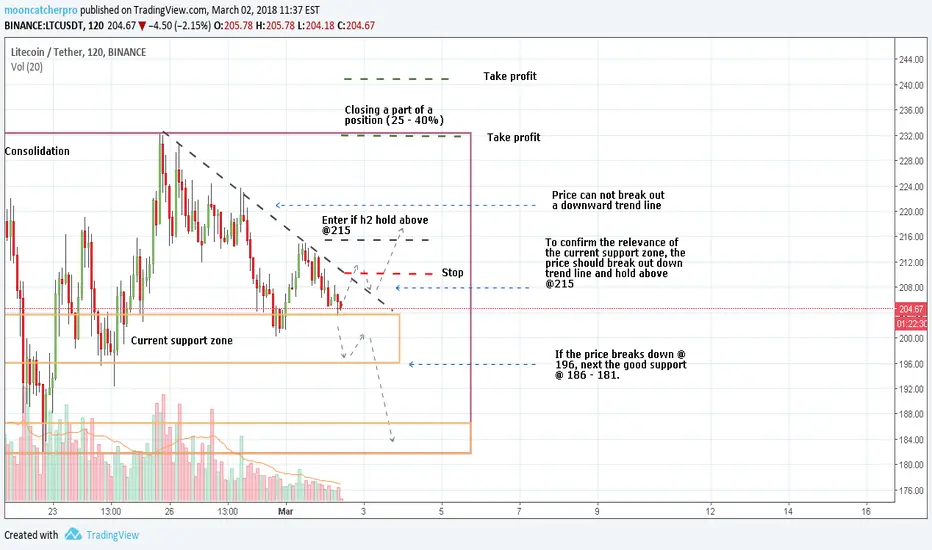
LTC/USDT (Volume Analysis Prediction 3/02/2018)LTC now does not correlate with markets(BTC)
The price is in consolidation, and is near a strong support zone
If support is still relevant, an upward movement may begin
When you close a part of the position, move stop-loss to the point of opening position (breakeven point).
Entry point: 215(Buy stop or buy limit)
Stop: 209.5
Target1: 231
Target2: 240
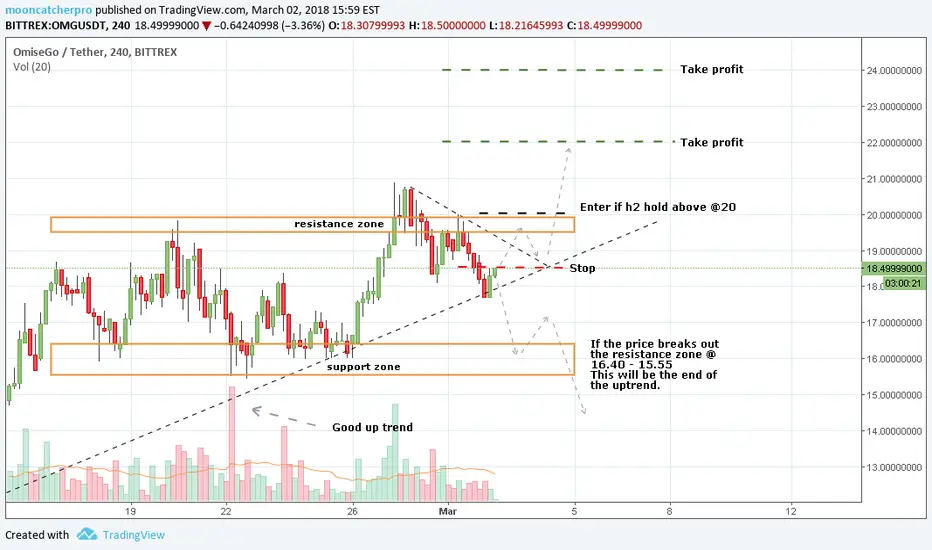
ETH/USD (Volume Analysis Prediction 2/26/2018)ETH have a high correlation with the BTC
BTC go up
ETH stay in consolidation, if price break out @880 price continued the upward movement to the resistance zone @940 - 980
Entry point: 880 (Buy stop or buy limit)
Stop: 830
Target1: 930 (Closing a part of a position (25 - 40%))
Target2: 980
When you close a part of the position, move stop-loss to the point of opening position (breakeven point).


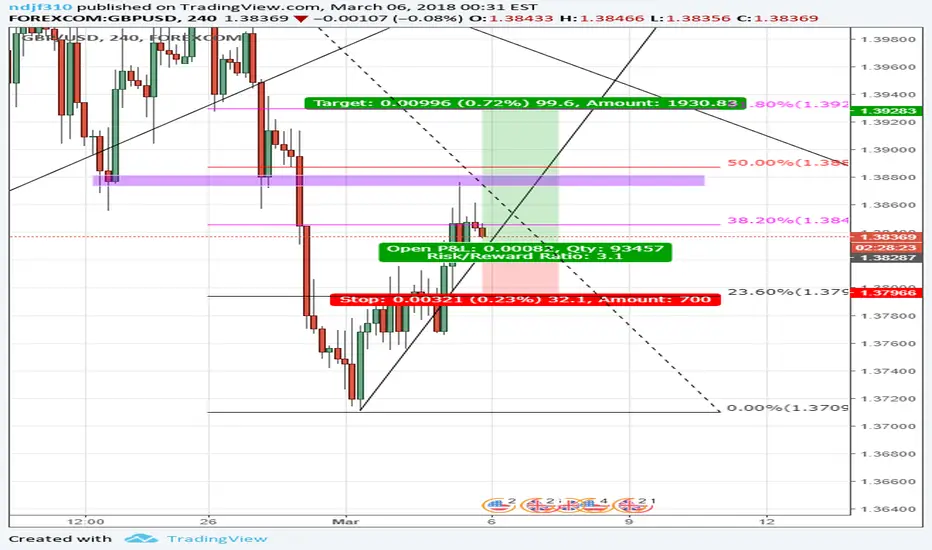
Gbpusd rebound from trendlineI expect it to come to the 4 hour trendline before going up higher .
I see it going up to the 61.8%

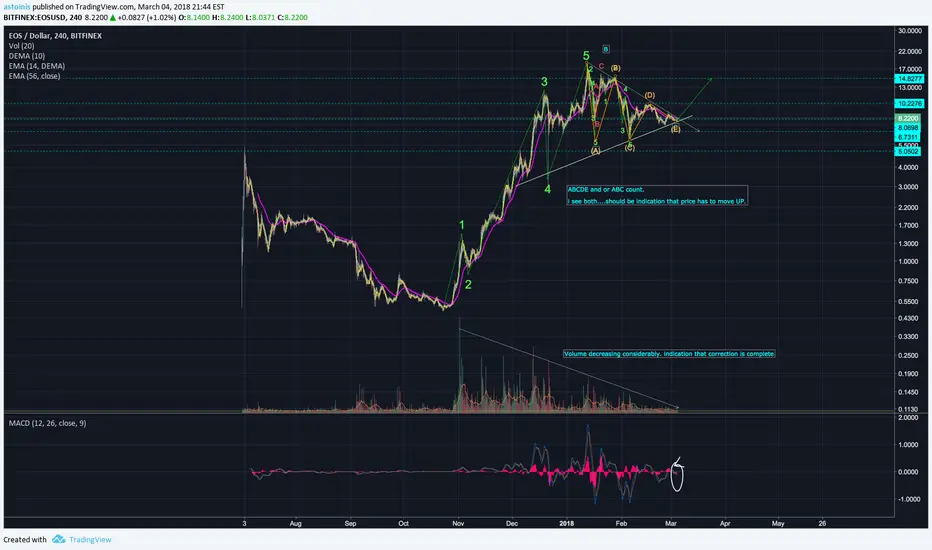
EOS about to strap up. launch.Price consolidated nicely.
read the graph. tired and graph shows what i think.
dec volume. CHECK
5 waves complete. Check
Next move: we need an impulse up. or lower lows. loooooooowwwww, but hopefully not :)
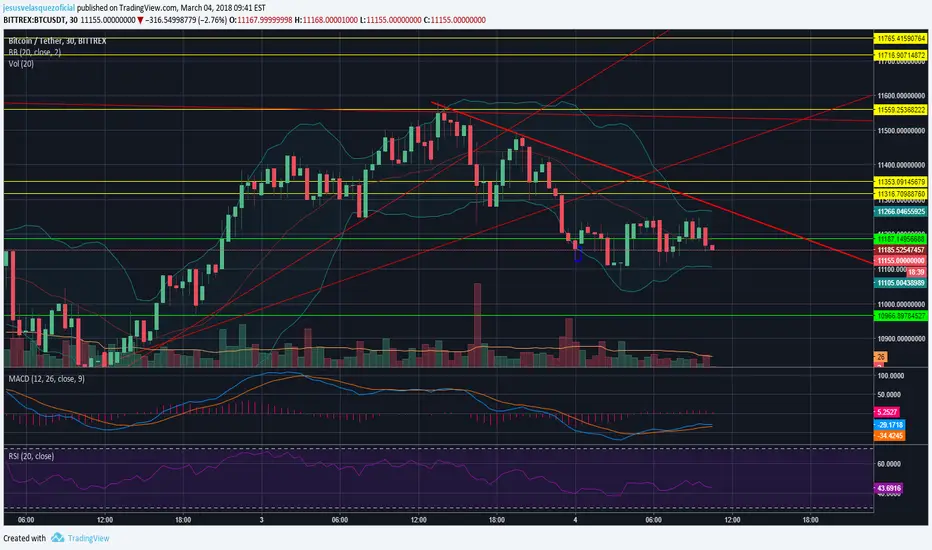
Bitcoin: BTCUSD Breaking Higher Again - follow with stops Bitcoin Coinbase Chart Breaking Higher Again
10:42gmt/05:42est
It's popped the upper parallel and is now in process of trickling
back down the same parallel - so now we need to see a
higher low set on this decline - maybe at 10333-10300 and if
not off the lower dynamic support line...that is the signal we
need to get long again from here. So far this looks OK though
and is trying to turn back up again.
On downside, if wrong, Bitcoin has to break below 10150 on
Coinbase to trigger any further shorts with stops 100 higher if
triggered at any point from here
Latest Update 11:07gmt/06:07est
Bitcoin Coinbase Chart
This is a natural spot for dayt traders who bought the lows to
close out off the first test of the upper dynamic from the
underside at 10550...this next decline has to make a higher low now to
show that the uptrend remains in tact. So far the selling is
light and a break above the upper dynamic should attract
more buyers as day traders get long again once broken.
Follow that break higher if not long already with stops below
10500

IOTA: IOTUSD Reverse Head+Shoulders with Upside Target at 2992 IOTA IOTUSD
Yet another reverse head and shoulders pattern with
a minimum upside target at 2992 once triggered by a break
above the neck-line which is now closeby at 2.222 - with stops
a little way below the neck-line once broken to upside.

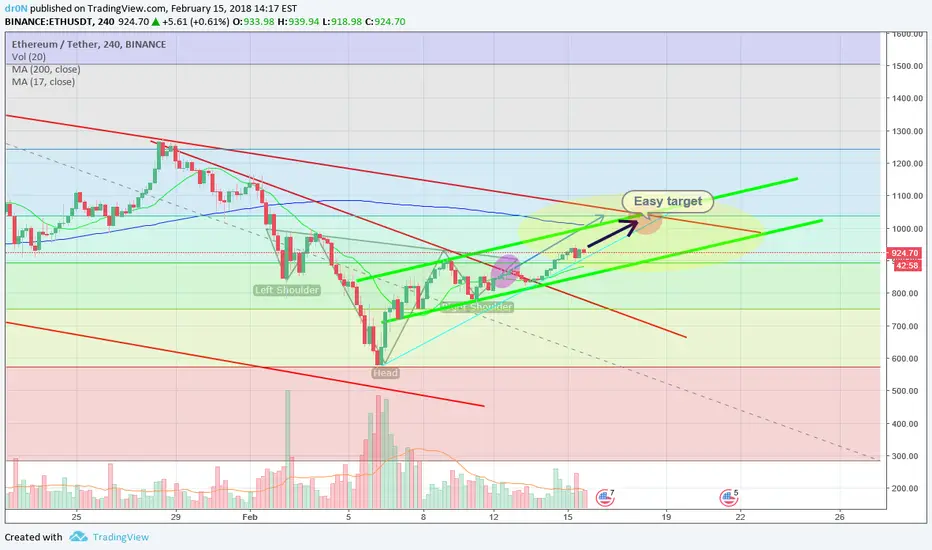
ETH is TRYING TO BROKE HEAVY RESISTANCE!!!AND THEN 1000$ETH is TRYING TO BROKE HEAVY RESISTANCE!!!AND THEN 1000 and more

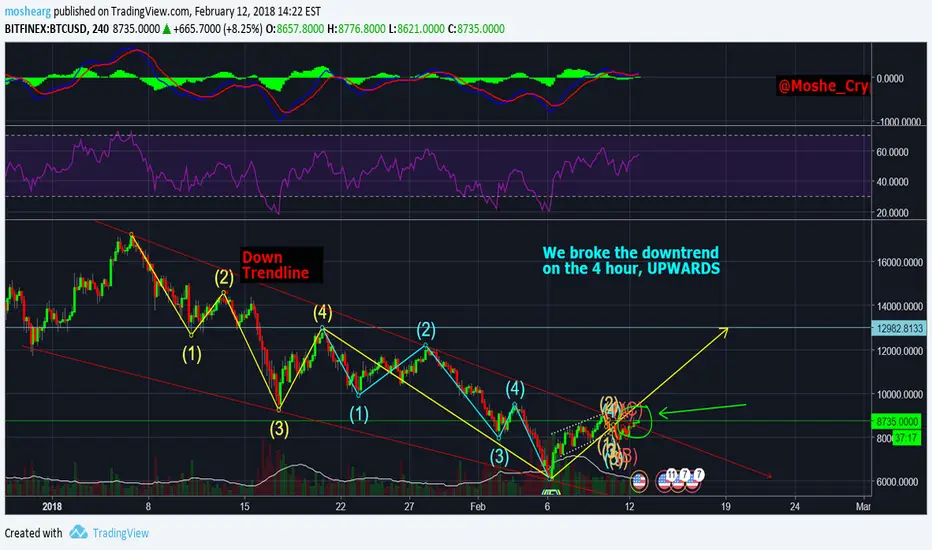
broke the downtrend upwards in the 4 hour chart - @Moshe_Cryptothe 1 thing we lack is VOLUME.
The candles broke the trend upwards as you can see in the chart.
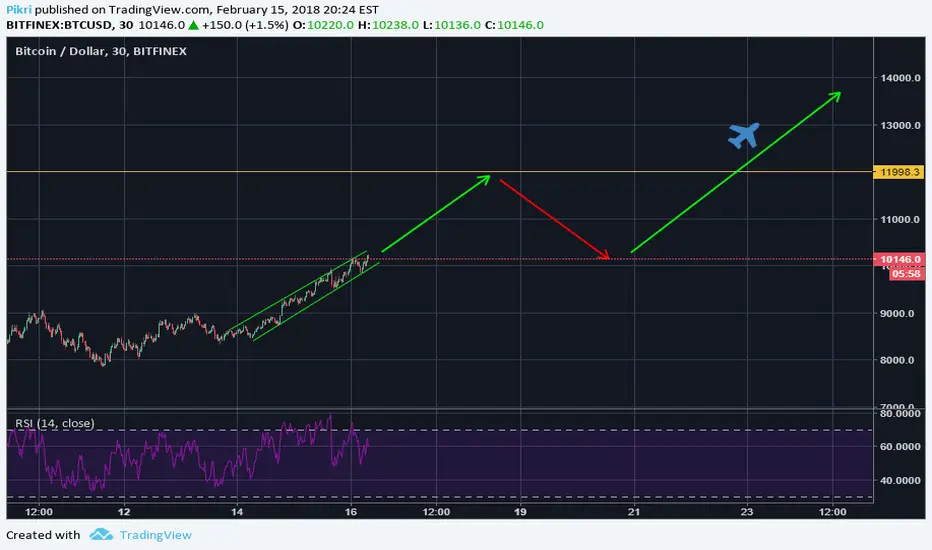
Volume meets this -> we fly to the 13000 bar.
Bitcoin bullish perspectiveDoji candlestick over the uptrend and on top the 8K support. Opportunity to go long until the 12K resistance.

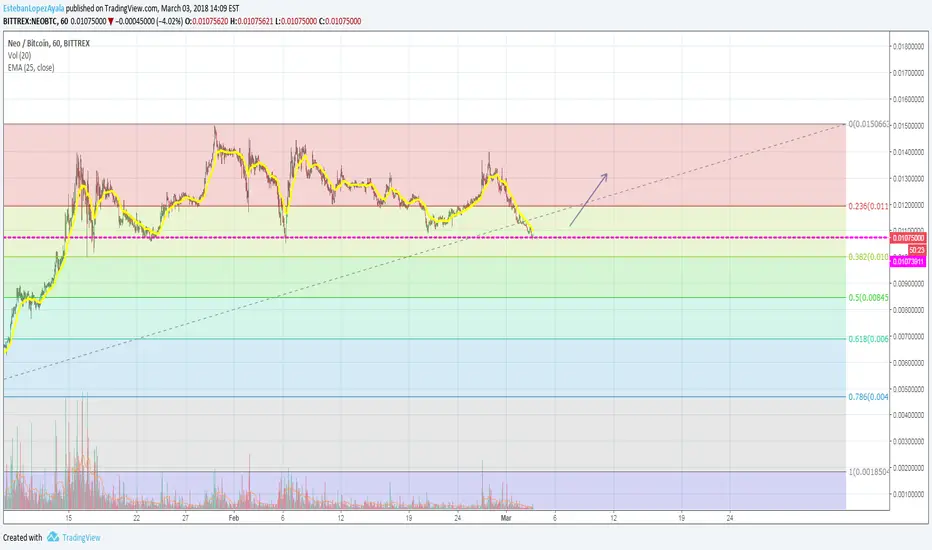
ETH GOING TO 1000$!!!Local downtrend is broken, now its on Fib support line and going to resistance at 989$

BTC IS GOING TO 10k!!!Local downtrend is broken and BTC going to 10 000$, also Fib levels will support to go up!

BTC is GOING TO 10.000$!Local downtrend is broken and Fib zone is help to support positions, next resistant is 10.300$
