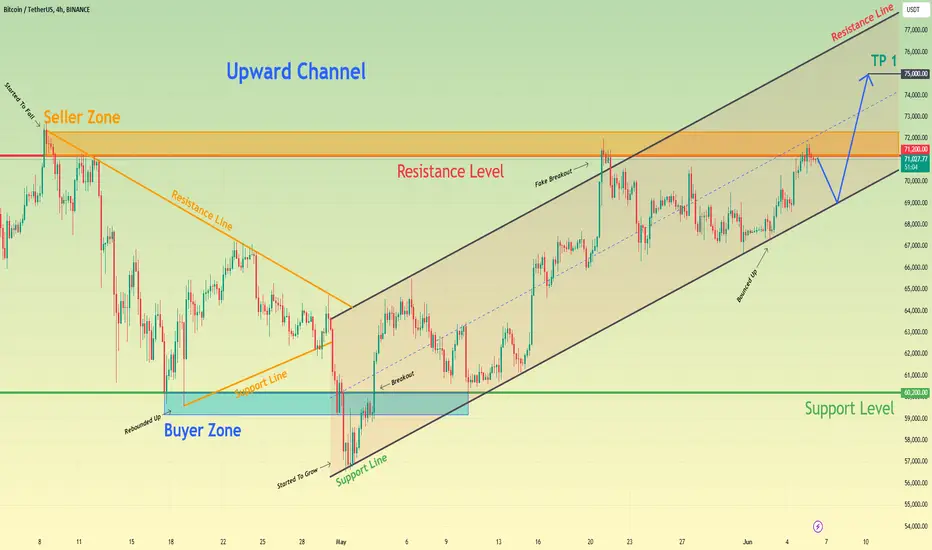
Bitcoin can break resistance level and continue grow in channelHello traders, I want share with you my opinion about Bitcoin. By observing the chart, we can see that the price reached the resistance level and even entered to the seller zone, where started to decline inside the downward pennant. In this pattern, it fell to the support level, which coincided with the buyer zone and also reached the support line of the pennant, after which rebounded up to the resistance line. Then BTC exited from a downward pennant and fell lower than the 60200 level, but soon it turned around and started to rise inside the upward channel, where BTC broke the support level one more time. Next, the price made retest and continued to move up in the channel and even made a fake breakout of the resistance line, but when Bitcoin touched the resistance level, it at once rebounded back to the channel. But a not long time ago price rebounded from the support line of the channel to the resistance level and now continues to trades very close to the 71200 level. So, that's why I think that BTC can make a correction movement to support line of the channel and then rebound up higher that resistance level, breaking it. After this move, the price can continue to move up in the upward channel, therefore I set my target at 75000 points. Please share this idea with your friends and click Boost 🚀
Upwardchannel
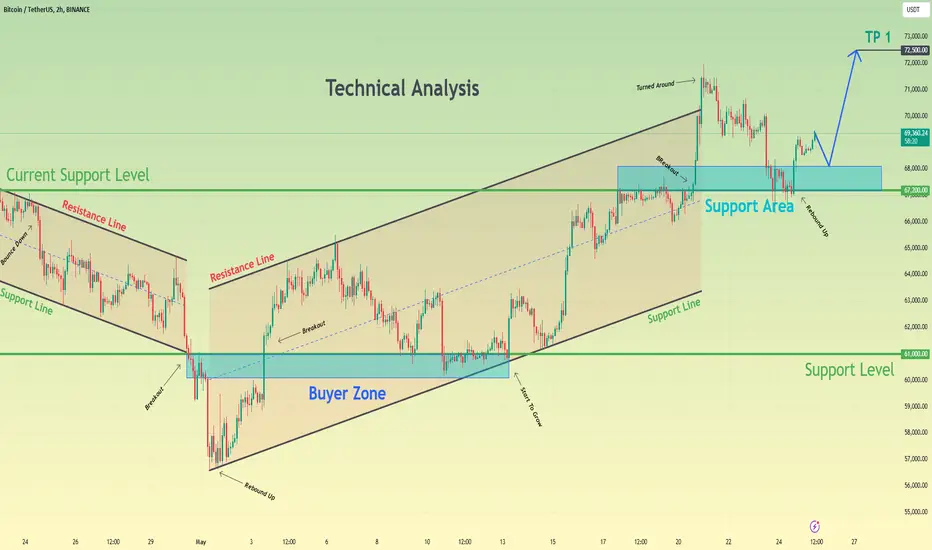
Bitcoin can correct to support area and then rebound upHello traders, I want share with you my opinion about Bitcoin. Looking at the chart, we can see how the price declined inside the downward channel, where it bounced from the resistance line and fell to the 61000 support level, which coincided with the support line of this channel. Then BTC broke this level, exiting from the downward channel also and declining a little lower, but soon turned around and started to grow inside the upward channel. In this channel, Bitcoin quickly rose to the resistance line, breaking the 61000 level again, and then corrected the 61000 support level, which coincided with the buyer zone. After this, the price continued to grow and later reached the current support level, which coincided with the support area. Soon, BTC broke it and even exited from the upward channel, but a not long time ago Bitcoin turned around and declined to support area. As well recently prices rebounded from this area and started to grow. So, in my opinion, Bitcoin can correct to support area and then rebound up, therefore I set my target at the 72500 level. Please share this idea with your friends and click Boost 🚀
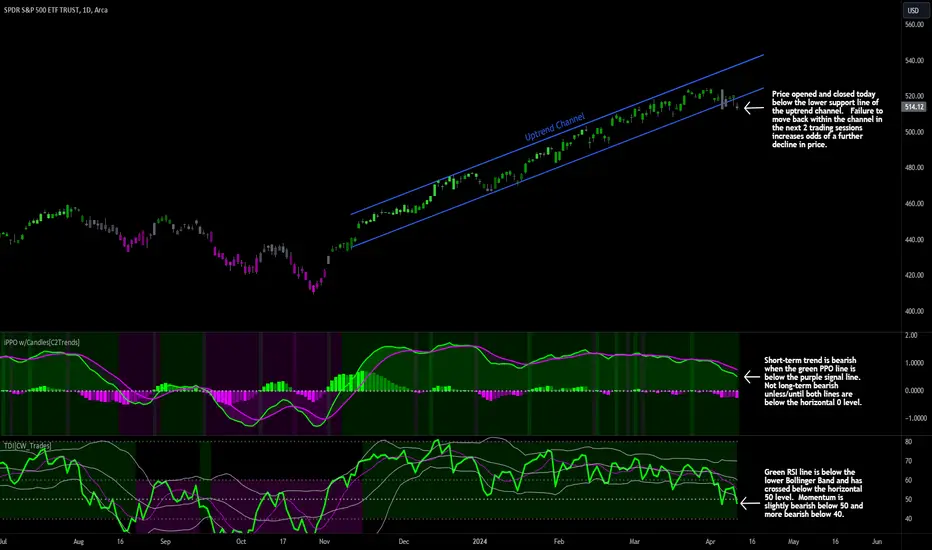
SPY Channel BreakThe S&P500 opened and closed below the lower support line of an uptrend channel. This in itself is excuse to sell or go short, but generally you want to see 2-3 days of price below or above a channel before considering it a trend shift. Most likely first level of price support to watch for if price does head lower is $500. Nice round number and a psychological level for traders especially going into the end of the week. If bulls are still serious about the bull market they'll defend $500.
The PPO trend indicator shows the green PPO line trending below the purple signal line which indicates a short-term bearish bias in price. The trend would be considered bearish in the medium to long-term if both lines cross below the horizontal 0 level.
The TSI momentum indicator shows the green RSI line trending below the purple signal line which indicates a short-term neutral trend or slowdown in momentum. The RSI line crossing below the horizontal 50 level also indicates a short-term slowdown in momentum. The green RSI line is also trading below its lower Bollinger Band; in general you want to be short when the RSI line is below the lower BBand.
With the hot inflation numbers that came out traders are probably starting to realize that there likely won't be a rate cut by the Federal Reserve in June, and maybe no cuts at all this year. The Fed is responsible for maintaining steady prices and low unemployment. Until unemployment rises the Federal Reserve is not likely to cut rates with persistent inflation.
XAGUSD Silver Long-Uptrend Channel
-Price making higher highs/higher lows.
-Long term bullish commodities with inflation,
Russia Ukraine, FED.
-Bought a pullback into demand with stop loss
below the previous HL/HH.

GBPJPY price 8H channel retesting?GBPJPY After a month-long battle out/ above the 📈4H/ 8H channel, the price came back to retest it last week at around 149.000 level. It accumulated around there for a bit and now it looks BULLISH, probably re-accumulating again, before taking off.
Historically I'm aware that GBPJPY likes to respect 0.618-0.786 FIB retracement areas a lot. 👍And I'm couting on the same happening here this time as well.
I'll keeping my eyes on the SPRING/ weekend break inefficiency Area for price action, and a potential ⬆️LONG entry.
🚨Setting my alerts at around 149.900, and we'll take it from there.
Have a great rest of the week.

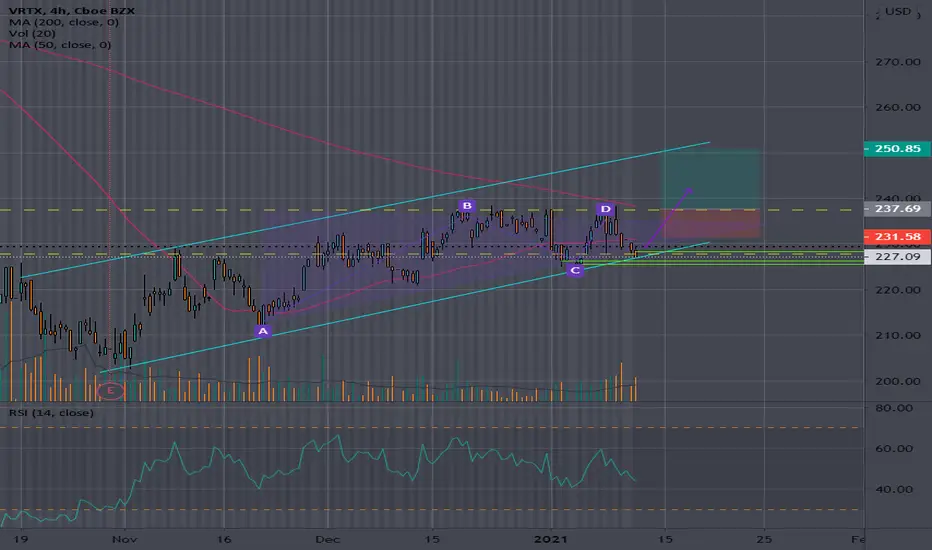
Breakout of resistancewont be long before the stock breaks above the $237 resistance as it trades in the upward channel
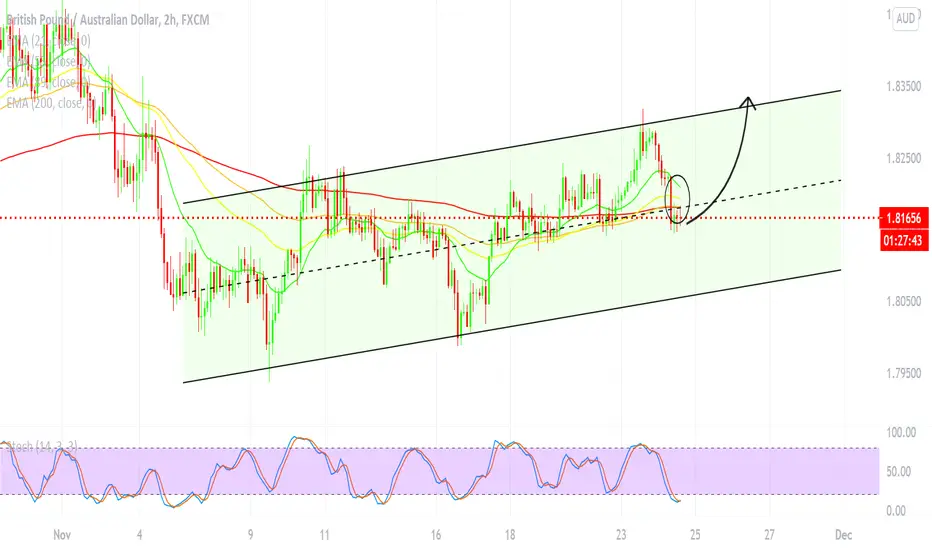
GBP/AUD 🇬🇧🇦🇺 to test the Channel!GBP/AUD 🇬🇧🇦🇺 is moving inside the Ascending Channel. The bullish narrowing of the EMAs together with the deep oversold Stochastic crossover are suggesting the pair is to test the Resistance of the channel.
If you like the idea PLEASE don't forget to hit the LIKE 👍👍👍button
Also share your thoughts and charts here in the comment ⌨️ section
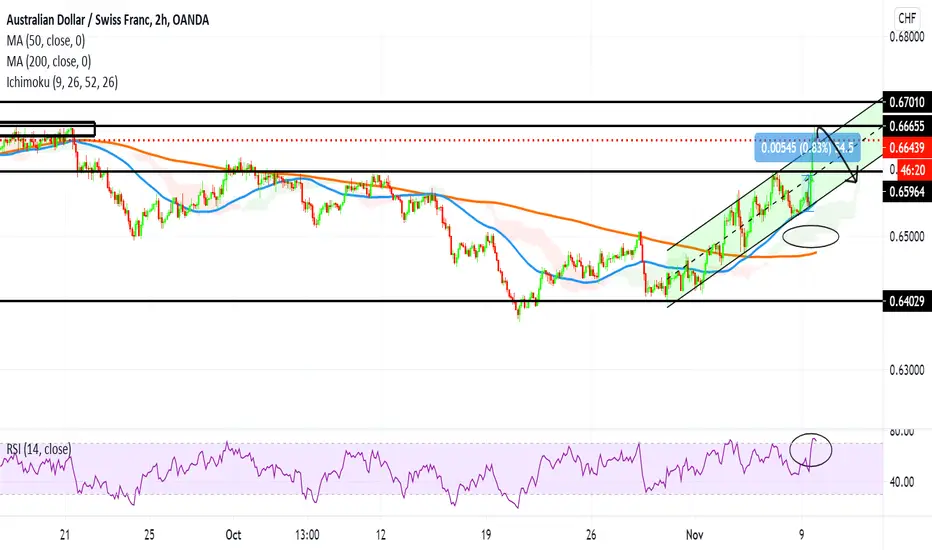
AUD/CHF 🇦🇺 🇨🇭 to come back into the channel.+0.83% on AUD/CHF 🇦🇺 🇨🇭. The price was rejected by the ... level. As the pair is lying above the clouds and is about to from a golden cross there is a possibility of a slight rise , however according to the high RSI overbought we shall expect the decline back to the channel.
If you like the idea PLEASE don't forget to hit the LIKE 👍👍👍button
Also share your thoughts and charts here in the comment ⌨️ section.
AUD/CAD 🇦🇺🇨🇦 to FALL and test the channel's supportAUD/CAD 🇦🇺🇨🇦 pulled back from the Upward channel resistance and according to the Stochastic crossover and RSI overbought the price is going to continue its decline and test the channel's support.
If you like the idea PLEASE don't forget to hit the LIKE 👍👍👍button
Also share your thoughts and charts here in the comment ⌨️ section.

AUD/USD 🇦🇺🇺🇸 to decline and test the 0.71072 lvl+0.28% on AUD/USD 🇦🇺🇺🇸. According to Stochastic Overbought crossover the price is likely to break from the Upward channel and test the 0.71072 lvl Support area.
If you like the idea PLEASE don't forget to hit the LIKE 👍👍👍button
Also share your thoughts and charts here in the comment ⌨️ section
