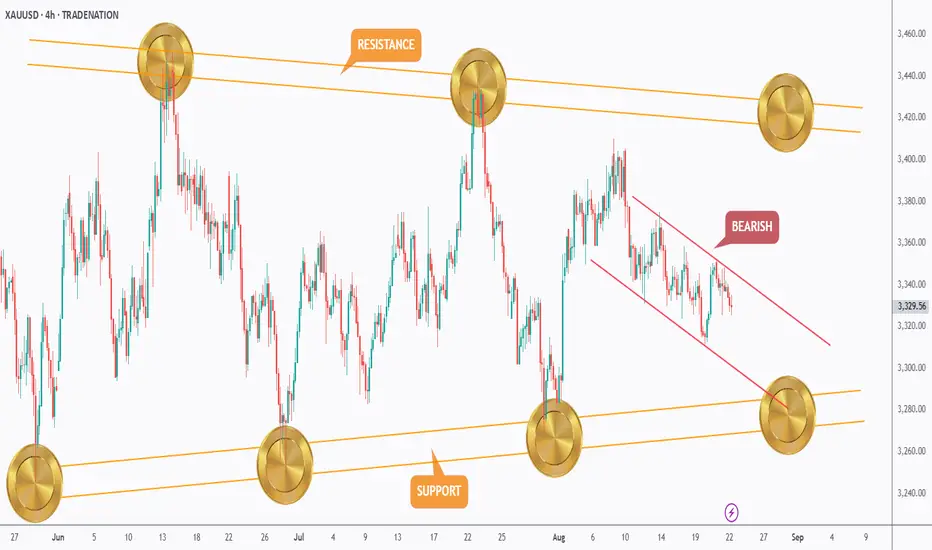
Is Gold Losing Its Luster or Preparing to Shine Again?XAUUSD has been respecting a broad ascending channel for months, with clear touches on both resistance and support levels. Recently, however, price slipped into a smaller bearish channel inside the larger structure.
📉 The short-term bias remains bearish as long as price trades within the red channel.
📊 Key support lies near the $3,280 zone — a critical level where bulls might attempt to step in.
💡 A breakout from the bearish channel could open the way for another retest of the upper resistance zone, while failure to hold support may trigger deeper corrections.
📚 Always follow your trading plan regarding entry, risk management, and trade management.
Good luck!
All Strategies Are Good; If Managed Properly!
~Rich
Disclosure: I am part of Trade Nation's Influencer program and receive a monthly fee for using their TradingView charts in my analysis.
US
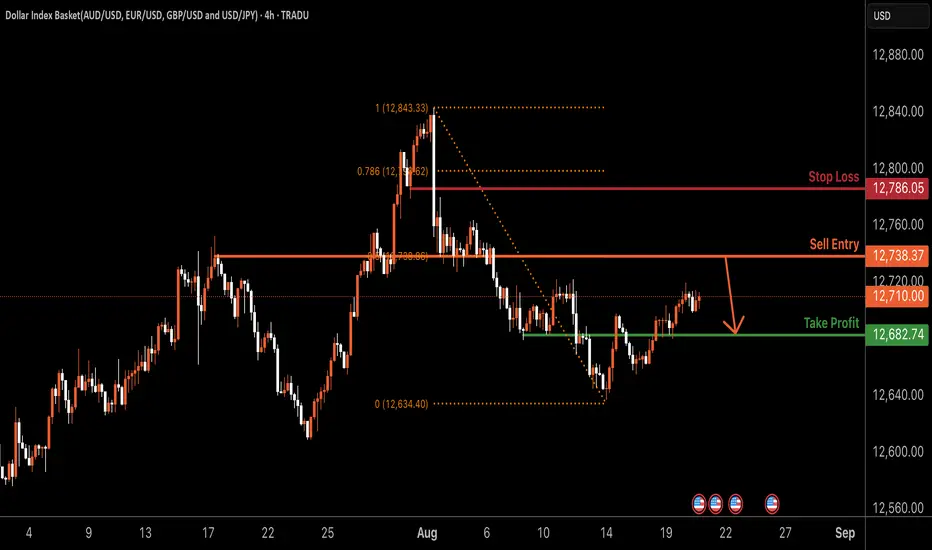
USDOLLAR H4 | Bearish reversal off 50% Fibonacci resistanceBased on the H4 chart analysis, we could see the price rise to the sell entry, which is an overlap resistance that aligns with the 50% Fibonacci retracement and could reverse from this level to the take profit.
Sell entry is at 12,738.37, which is an overlap resistance that lines up with the 50% Fibonacci retracement.
Stop loss is at 12,786.05, which is a pullback resistance that is slightly below the 78.6% Fibonacci retracement.
Take profit is at 12,682.74, which is a pullback support.
High Risk Investment Warning
Trading Forex/CFDs on margin carries a high level of risk and may not be suitable for all investors. Leverage can work against you.
Stratos Markets Limited (tradu.com ):
CFDs are complex instruments and come with a high risk of losing money rapidly due to leverage. 65% of retail investor accounts lose money when trading CFDs with this provider. You should consider whether you understand how CFDs work and whether you can afford to take the high risk of losing your money.
Stratos Europe Ltd (tradu.com ):
CFDs are complex instruments and come with a high risk of losing money rapidly due to leverage. 66% of retail investor accounts lose money when trading CFDs with this provider. You should consider whether you understand how CFDs work and whether you can afford to take the high risk of losing your money.
Stratos Global LLC (tradu.com ):
Losses can exceed deposits.
Please be advised that the information presented on TradingView is provided to Tradu (‘Company’, ‘we’) by a third-party provider (‘TFA Global Pte Ltd’). Please be reminded that you are solely responsible for the trading decisions on your account. There is a very high degree of risk involved in trading. Any information and/or content is intended entirely for research, educational and informational purposes only and does not constitute investment or consultation advice or investment strategy. The information is not tailored to the investment needs of any specific person and therefore does not involve a consideration of any of the investment objectives, financial situation or needs of any viewer that may receive it. Kindly also note that past performance is not a reliable indicator of future results. Actual results may differ materially from those anticipated in forward-looking or past performance statements. We assume no liability as to the accuracy or completeness of any of the information and/or content provided herein and the Company cannot be held responsible for any omission, mistake nor for any loss or damage including without limitation to any loss of profit which may arise from reliance on any information supplied by TFA Global Pte Ltd.
The speaker(s) is neither an employee, agent nor representative of Tradu and is therefore acting independently. The opinions given are their own, constitute general market commentary, and do not constitute the opinion or advice of Tradu or any form of personal or investment advice. Tradu neither endorses nor guarantees offerings of third-party speakers, nor is Tradu responsible for the content, veracity or opinions of third-party speakers, presenters or participants.
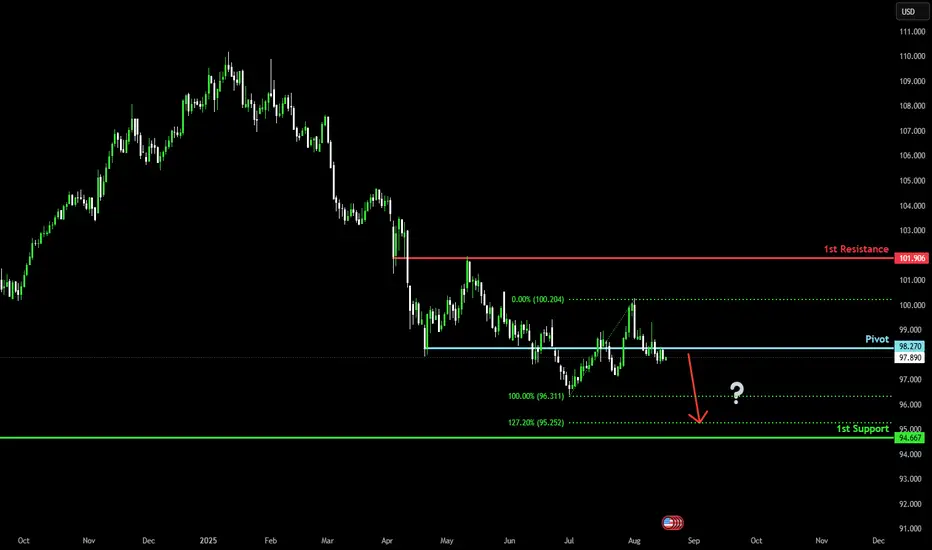
Bearish drop?US Dollar Index (DXY) is reacting off the pivot, which acts as an overlap resistance and could drop to the 1st support.
Pivot: 98.27
1st Support: 94.66
1st Support: 94.66Risk Warning:
Trading Forex and CFDs carries a high level of risk to your capital and you should only trade with money you can afford to lose. Trading Forex and CFDs may not be suitable for all investors, so please ensure that you fully understand the risks involved and seek independent advice if necessary.
Disclaimer:
The above opinions given constitute general market commentary, and do not constitute the opinion or advice of IC Markets or any form of personal or investment advice.
Any opinions, news, research, analyses, prices, other information, or links to third-party sites contained on this website are provided on an "as-is" basis, are intended only to be informative, is not an advice nor a recommendation, nor research, or a record of our trading prices, or an offer of, or solicitation for a transaction in any financial instrument and thus should not be treated as such. The information provided does not involve any specific investment objectives, financial situation and needs of any specific person who may receive it. Please be aware, that past performance is not a reliable indicator of future performance and/or results. Past Performance or Forward-looking scenarios based upon the reasonable beliefs of the third-party provider are not a guarantee of future performance. Actual results may differ materially from those anticipated in forward-looking or past performance statements. IC Markets makes no representation or warranty and assumes no liability as to the accuracy or completeness of the information provided, nor any loss arising from any investment based on a recommendation, forecast or any information supplied by any third-party.
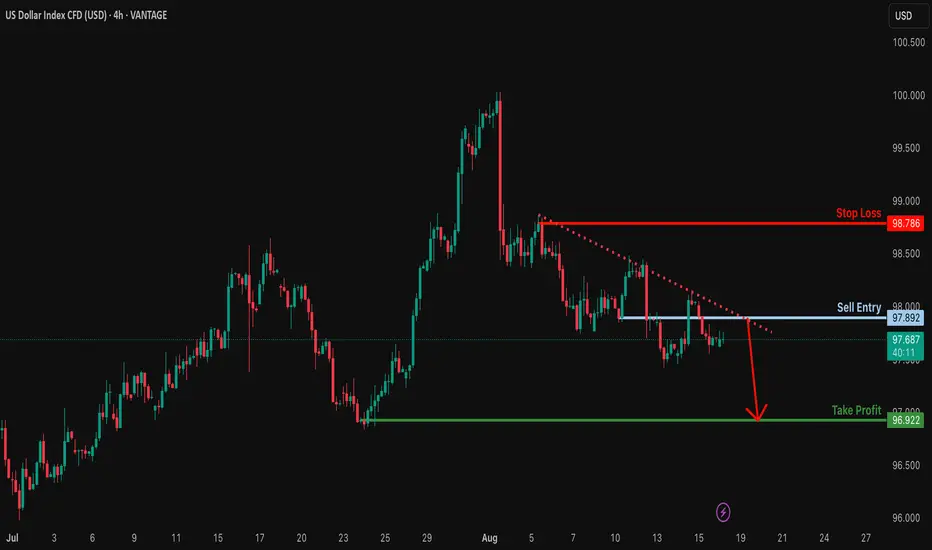
Potential bearish drop?USDX is rising towards the resistance, which is a pullback resistance, and could drop from this level to our take-profit.
Entry: 97.89
Why we like it:
There is a pullback resistance.
Stop loss: 98.78
Why we like it:
There is a pullback resistance.
Take profit: 97.92
Why we like it:
There is a swing low support.
Enjoying your TradingView experience? Review us!
Please be advised that the information presented on TradingView is provided to Vantage (‘Vantage Global Limited’, ‘we’) by a third-party provider (‘Everest Fortune Group’). Please be reminded that you are solely responsible for the trading decisions on your account. There is a very high degree of risk involved in trading. Any information and/or content is intended entirely for research, educational and informational purposes only and does not constitute investment or consultation advice or investment strategy. The information is not tailored to the investment needs of any specific person and therefore does not involve a consideration of any of the investment objectives, financial situation or needs of any viewer that may receive it. Kindly also note that past performance is not a reliable indicator of future results. Actual results may differ materially from those anticipated in forward-looking or past performance statements. We assume no liability as to the accuracy or completeness of any of the information and/or content provided herein and the Company cannot be held responsible for any omission, mistake nor for any loss or damage including without limitation to any loss of profit which may arise from reliance on any information supplied by Everest Fortune Group.
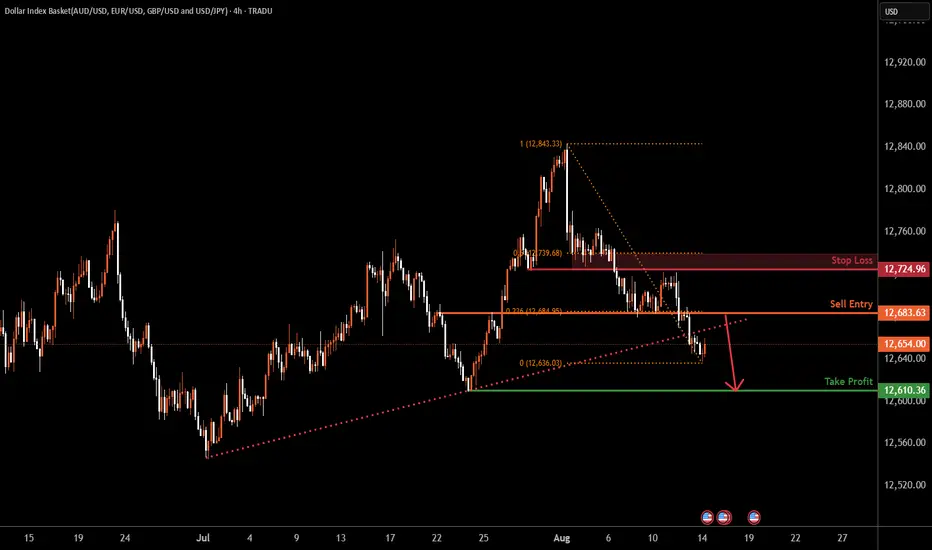
USDOLLAR H4 |Bearish reversal off overlap resistance?Based on the H4 chart analysis, we could see the price rise to the sell entry at 12,683.63, which is an overlap resistance that aligns with the 23.6% Fibonacci retracement. From this level, the price could drop towards the take profit.
Stop loss is at 12,724.96, which is an overlap resistance that is slightly below the 50% Fibonacci retracement.
Take profit is at 12,610.36, which acts as a swing low support.
High Risk Investment Warning
Trading Forex/CFDs on margin carries a high level of risk and may not be suitable for all investors. Leverage can work against you.
Stratos Markets Limited (tradu.com ):
CFDs are complex instruments and come with a high risk of losing money rapidly due to leverage. 65% of retail investor accounts lose money when trading CFDs with this provider. You should consider whether you understand how CFDs work and whether you can afford to take the high risk of losing your money.
Stratos Europe Ltd (tradu.com ):
CFDs are complex instruments and come with a high risk of losing money rapidly due to leverage. 66% of retail investor accounts lose money when trading CFDs with this provider. You should consider whether you understand how CFDs work and whether you can afford to take the high risk of losing your money.
Stratos Global LLC (tradu.com ):
Losses can exceed deposits.
Please be advised that the information presented on TradingView is provided to Tradu (‘Company’, ‘we’) by a third-party provider (‘TFA Global Pte Ltd’). Please be reminded that you are solely responsible for the trading decisions on your account. There is a very high degree of risk involved in trading. Any information and/or content is intended entirely for research, educational and informational purposes only and does not constitute investment or consultation advice or investment strategy. The information is not tailored to the investment needs of any specific person and therefore does not involve a consideration of any of the investment objectives, financial situation or needs of any viewer that may receive it. Kindly also note that past performance is not a reliable indicator of future results. Actual results may differ materially from those anticipated in forward-looking or past performance statements. We assume no liability as to the accuracy or completeness of any of the information and/or content provided herein and the Company cannot be held responsible for any omission, mistake nor for any loss or damage including without limitation to any loss of profit which may arise from reliance on any information supplied by TFA Global Pte Ltd.
The speaker(s) is neither an employee, agent nor representative of Tradu and is therefore acting independently. The opinions given are their own, constitute general market commentary, and do not constitute the opinion or advice of Tradu or any form of personal or investment advice. Tradu neither endorses nor guarantees offerings of third-party speakers, nor is Tradu responsible for the content, veracity or opinions of third-party speakers, presenters or participants.
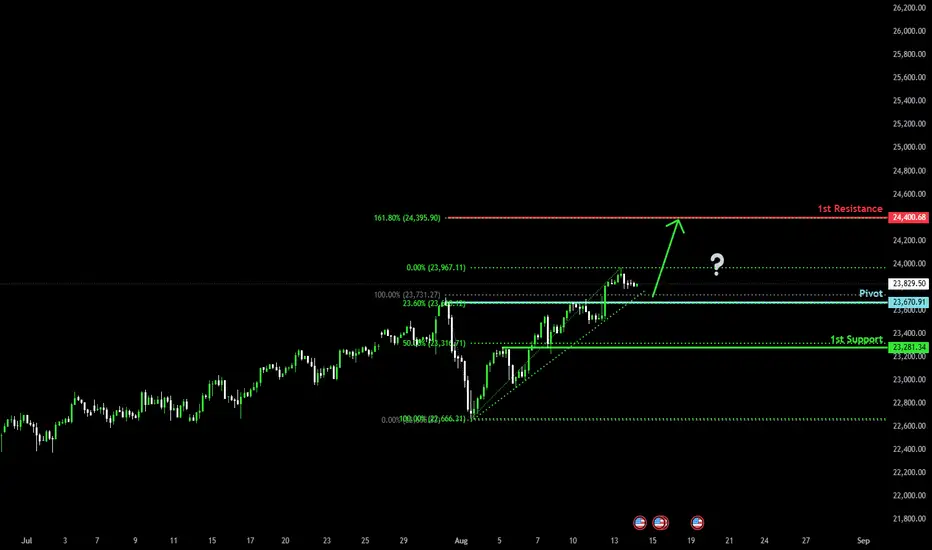
Bullish continuation?USTEC is falling towards the pivot which has been identified as a pullback support and could bounce to the 1st resistance.
Pivot: 23,670.91
1st Support: 23,281.34
1st Resistance: 24,400.68
Risk Warning:
Trading Forex and CFDs carries a high level of risk to your capital and you should only trade with money you can afford to lose. Trading Forex and CFDs may not be suitable for all investors, so please ensure that you fully understand the risks involved and seek independent advice if necessary.
Disclaimer:
The above opinions given constitute general market commentary, and do not constitute the opinion or advice of IC Markets or any form of personal or investment advice.
Any opinions, news, research, analyses, prices, other information, or links to third-party sites contained on this website are provided on an "as-is" basis, are intended only to be informative, is not an advice nor a recommendation, nor research, or a record of our trading prices, or an offer of, or solicitation for a transaction in any financial instrument and thus should not be treated as such. The information provided does not involve any specific investment objectives, financial situation and needs of any specific person who may receive it. Please be aware, that past performance is not a reliable indicator of future performance and/or results. Past Performance or Forward-looking scenarios based upon the reasonable beliefs of the third-party provider are not a guarantee of future performance. Actual results may differ materially from those anticipated in forward-looking or past performance statements. IC Markets makes no representation or warranty and assumes no liability as to the accuracy or completeness of the information provided, nor any loss arising from any investment based on a recommendation, forecast or any information supplied by any third-party.
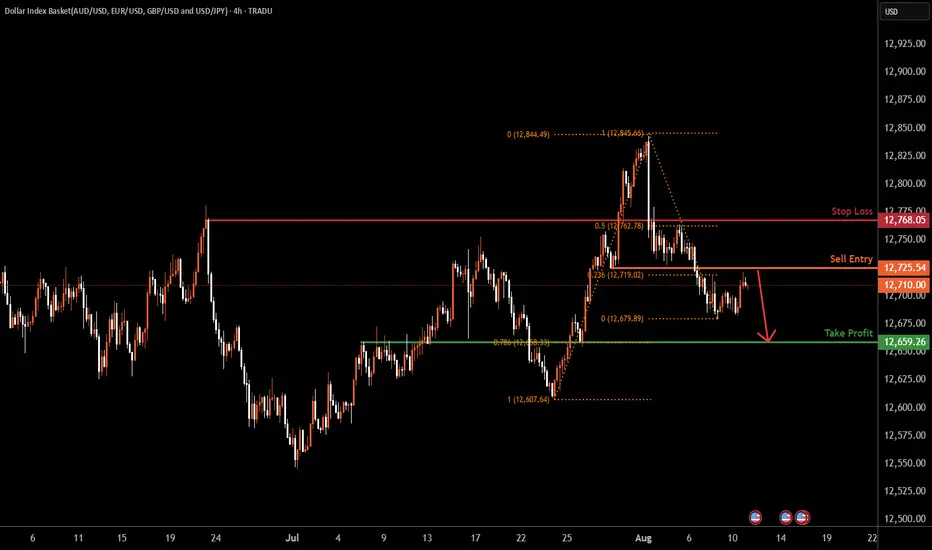
USDOLLAR H4 | Bearish dropUSDOLLAR is rising towards the sell entry which is a pullback resistance that is slightly above the 23.6% Fibonaccic retracement and could drop to the take profit.
Sell entry at 12,725.54, which is a pullback resistance that is slightly above the 23.6% Fibonacci retracement.
Stop loss is at 12,768.05, which is a pullback resistance that lines up with the 50% FIbonacci retracement.
Take profit is at 12,659.26, whic is a pullback support that lines up with the 78.6% Fibonacci retracement.
High Risk Investment Warning
Trading Forex/CFDs on margin carries a high level of risk and may not be suitable for all investors. Leverage can work against you.
Stratos Markets Limited (tradu.com ):
CFDs are complex instruments and come with a high risk of losing money rapidly due to leverage. 65% of retail investor accounts lose money when trading CFDs with this provider. You should consider whether you understand how CFDs work and whether you can afford to take the high risk of losing your money.
Stratos Europe Ltd (tradu.com ):
CFDs are complex instruments and come with a high risk of losing money rapidly due to leverage. 66% of retail investor accounts lose money when trading CFDs with this provider. You should consider whether you understand how CFDs work and whether you can afford to take the high risk of losing your money.
Stratos Global LLC (tradu.com ):
Losses can exceed deposits.
Please be advised that the information presented on TradingView is provided to Tradu (‘Company’, ‘we’) by a third-party provider (‘TFA Global Pte Ltd’). Please be reminded that you are solely responsible for the trading decisions on your account. There is a very high degree of risk involved in trading. Any information and/or content is intended entirely for research, educational and informational purposes only and does not constitute investment or consultation advice or investment strategy. The information is not tailored to the investment needs of any specific person and therefore does not involve a consideration of any of the investment objectives, financial situation or needs of any viewer that may receive it. Kindly also note that past performance is not a reliable indicator of future results. Actual results may differ materially from those anticipated in forward-looking or past performance statements. We assume no liability as to the accuracy or completeness of any of the information and/or content provided herein and the Company cannot be held responsible for any omission, mistake nor for any loss or damage including without limitation to any loss of profit which may arise from reliance on any information supplied by TFA Global Pte Ltd.
The speaker(s) is neither an employee, agent nor representative of Tradu and is therefore acting independently. The opinions given are their own, constitute general market commentary, and do not constitute the opinion or advice of Tradu or any form of personal or investment advice. Tradu neither endorses nor guarantees offerings of third-party speakers, nor is Tradu responsible for the content, veracity or opinions of third-party speakers, presenters or participants.
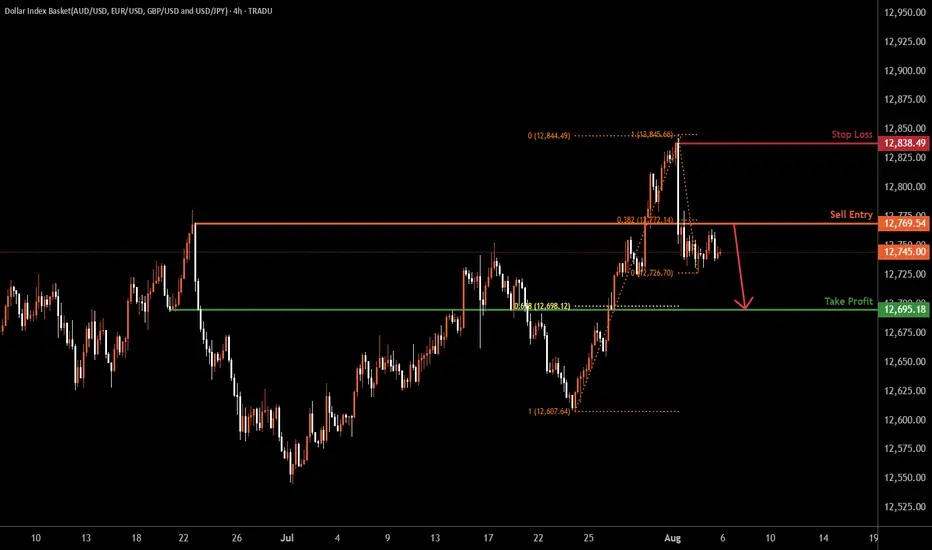
USDOLLA H4 | Bearish dropBased on the H4 chart analysis, we can see the price rise to the sell entry which is a pullback resistance and could drop from this level to the take profit.
Sell entry is at 12,769.54, which is a pullback resistance that lines up with the 38.2% Fibonacci retracement.
Stop loss is at 12,838,49, which is a swing high resistance.
Take profit is at 12,695.18, which is a pullback support that aligns with the 61.8% Fibonacci retracement.
High Risk Investment Warning
Trading Forex/CFDs on margin carries a high level of risk and may not be suitable for all investors. Leverage can work against you.
Stratos Markets Limited (tradu.com ):
CFDs are complex instruments and come with a high risk of losing money rapidly due to leverage. 65% of retail investor accounts lose money when trading CFDs with this provider. You should consider whether you understand how CFDs work and whether you can afford to take the high risk of losing your money.
Stratos Europe Ltd (tradu.com ):
CFDs are complex instruments and come with a high risk of losing money rapidly due to leverage. 66% of retail investor accounts lose money when trading CFDs with this provider. You should consider whether you understand how CFDs work and whether you can afford to take the high risk of losing your money.
Stratos Global LLC (tradu.com ):
Losses can exceed deposits.
Please be advised that the information presented on TradingView is provided to Tradu (‘Company’, ‘we’) by a third-party provider (‘TFA Global Pte Ltd’). Please be reminded that you are solely responsible for the trading decisions on your account. There is a very high degree of risk involved in trading. Any information and/or content is intended entirely for research, educational and informational purposes only and does not constitute investment or consultation advice or investment strategy. The information is not tailored to the investment needs of any specific person and therefore does not involve a consideration of any of the investment objectives, financial situation or needs of any viewer that may receive it. Kindly also note that past performance is not a reliable indicator of future results. Actual results may differ materially from those anticipated in forward-looking or past performance statements. We assume no liability as to the accuracy or completeness of any of the information and/or content provided herein and the Company cannot be held responsible for any omission, mistake nor for any loss or damage including without limitation to any loss of profit which may arise from reliance on any information supplied by TFA Global Pte Ltd.
The speaker(s) is neither an employee, agent nor representative of Tradu and is therefore acting independently. The opinions given are their own, constitute general market commentary, and do not constitute the opinion or advice of Tradu or any form of personal or investment advice. Tradu neither endorses nor guarantees offerings of third-party speakers, nor is Tradu responsible for the content, veracity or opinions of third-party speakers, presenters or participants.
USDOLLAR H4 | Bearish dropBased on the H4 chart analysis, we could see the price drop lower from the sell entry, which is a pullback resistance and could drop to the downside.
Sell entry is at 12,769.54, which is a pullback resistance.
Stop loss is at 12,834.49, which is at 12,695.18, which is a pullback resistance.
Take profit is at 12,695.18, which is a pullback support that aligns with the 61.8% Fibonacci retracement.
High Risk Investment Warning
Trading Forex/CFDs on margin carries a high level of risk and may not be suitable for all investors. Leverage can work against you.
Stratos Markets Limited (tradu.com ):
CFDs are complex instruments and come with a high risk of losing money rapidly due to leverage. 65% of retail investor accounts lose money when trading CFDs with this provider. You should consider whether you understand how CFDs work and whether you can afford to take the high risk of losing your money.
Stratos Europe Ltd (tradu.com ):
CFDs are complex instruments and come with a high risk of losing money rapidly due to leverage. 66% of retail investor accounts lose money when trading CFDs with this provider. You should consider whether you understand how CFDs work and whether you can afford to take the high risk of losing your money.
Stratos Global LLC (tradu.com ):
Losses can exceed deposits.
Please be advised that the information presented on TradingView is provided to Tradu (‘Company’, ‘we’) by a third-party provider (‘TFA Global Pte Ltd’). Please be reminded that you are solely responsible for the trading decisions on your account. There is a very high degree of risk involved in trading. Any information and/or content is intended entirely for research, educational and informational purposes only and does not constitute investment or consultation advice or investment strategy. The information is not tailored to the investment needs of any specific person and therefore does not involve a consideration of any of the investment objectives, financial situation or needs of any viewer that may receive it. Kindly also note that past performance is not a reliable indicator of future results. Actual results may differ materially from those anticipated in forward-looking or past performance statements. We assume no liability as to the accuracy or completeness of any of the information and/or content provided herein and the Company cannot be held responsible for any omission, mistake nor for any loss or damage including without limitation to any loss of profit which may arise from reliance on any information supplied by TFA Global Pte Ltd.
The speaker(s) is neither an employee, agent nor representative of Tradu and is therefore acting independently. The opinions given are their own, constitute general market commentary, and do not constitute the opinion or advice of Tradu or any form of personal or investment advice. Tradu neither endorses nor guarantees offerings of third-party speakers, nor is Tradu responsible for the content, veracity or opinions of third-party speakers, presenters or participants.

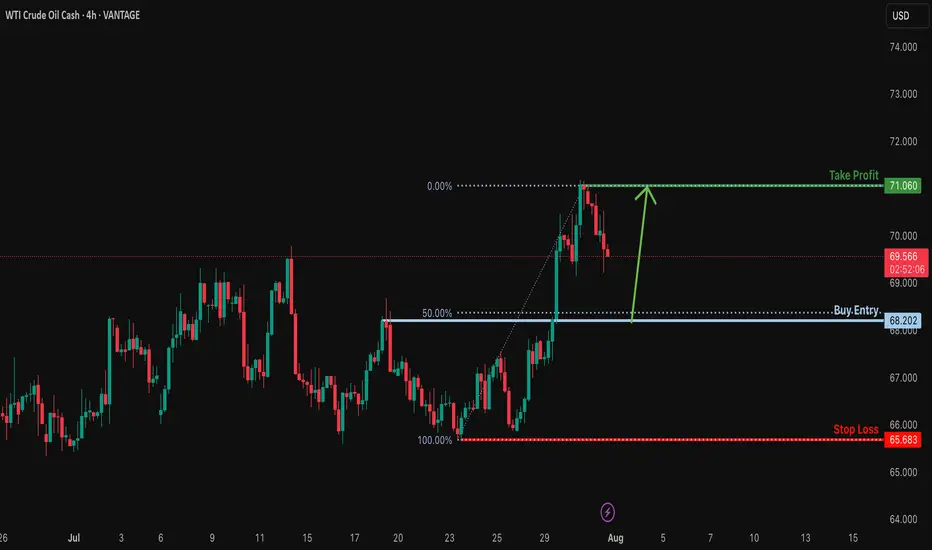
Bullish bounce off 50% Fibonacci support?USOUSD is falling towards the support levle which is a pullback support that aligns with the 50% Fibonacci retracement and could bounce from this level to our take profit.
Entry: 68.20
Why we like it:
There is a pullback support that lines up with the 50% Fibonacci retracement.
Stop loss: 65.68
Why we like it:
There is a multi swing low support.
Take profit: 71.06
Why we like it:
There is a swing high resistance.
Enjoying your TradingView experience? Review us!
Please be advised that the information presented on TradingView is provided to Vantage (‘Vantage Global Limited’, ‘we’) by a third-party provider (‘Everest Fortune Group’). Please be reminded that you are solely responsible for the trading decisions on your account. There is a very high degree of risk involved in trading. Any information and/or content is intended entirely for research, educational and informational purposes only and does not constitute investment or consultation advice or investment strategy. The information is not tailored to the investment needs of any specific person and therefore does not involve a consideration of any of the investment objectives, financial situation or needs of any viewer that may receive it. Kindly also note that past performance is not a reliable indicator of future results. Actual results may differ materially from those anticipated in forward-looking or past performance statements. We assume no liability as to the accuracy or completeness of any of the information and/or content provided herein and the Company cannot be held responsible for any omission, mistake nor for any loss or damage including without limitation to any loss of profit which may arise from reliance on any information supplied by Everest Fortune Group.
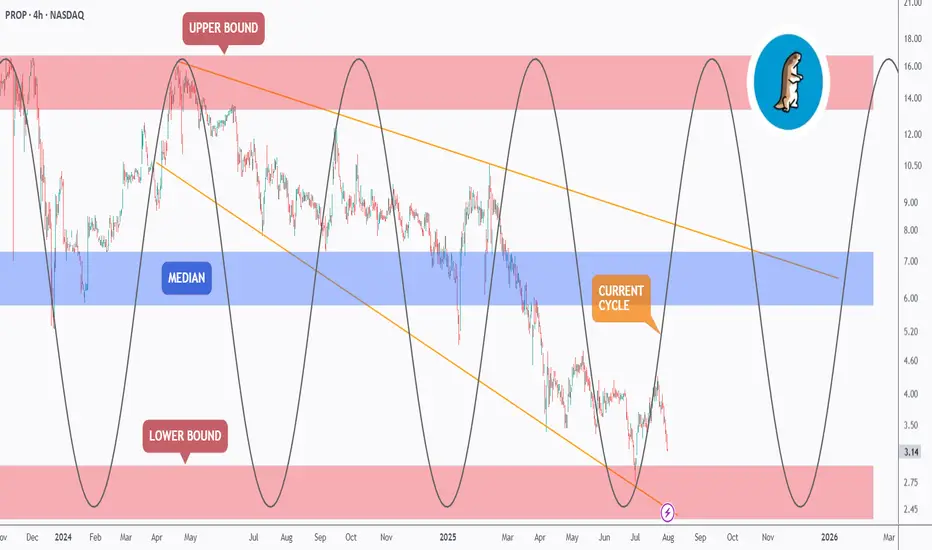
PROP - Riding the Cycle? The Next Wave May Just Be Starting!Markets move in cycles; and PROP is no exception.
If you’ve been following our previous analyses, you’ll recognize the accumulation zone we highlighted earlier. Well, this updated chart adds another layer: the cyclical rhythm of price action.
🔁As shown, PROP has been moving in clearly defined waves, bouncing between key zones with consistency. The current cycle appears to have bottomed — once again — inside the lower bound, where strong demand continues to hold.
We’re now in the early phase of what could be a fresh bullish cycle. If the rhythm plays out as before, the path of least resistance could take us toward the median zone ($6.5 - $7.5) and possibly all the way back to the upper bound ($15 - $17) by late 2025 or early 2026.
🔍 Supporting Fundamentals
While the chart speaks volumes, the fundamentals back it up:
Energy demand is surging globally, fueled by AI, data centers, and electric infrastructure — all of which require massive power capacity.
Oil and gas remain essential in this transition phase, especially with renewable infrastructure still years away from matching base-load demand.
PROP (Prairie Operating Co.) controls 65,000 acres in the DJ Basin — one of the most productive oil regions in the U.S. With advanced drilling tech and low-cost operations, PROP is well-positioned to ride out volatility and capitalize on rising demand.
🎯 Key Zones to Watch
- Support: $2.5–$3
- Median target: $6.5–$7.5
- Macro resistance: $15–$17
📌 We’re not just seeing structure — we’re seeing rhythm, confluence, and timing align.
If this cycle continues to play out, PROP might just be preparing for its next major wave.
Are you ready to catch it?
🧠 Previous posts and technical breakdowns are attached for full context.
➡️ As always, speak with your financial advisor and do your own research before making any investment decisions.
📚 Always follow your trading plan => including entry, risk management, and trade execution.
Good luck!
All strategies are good, if managed properly.
~ Richard Nasr
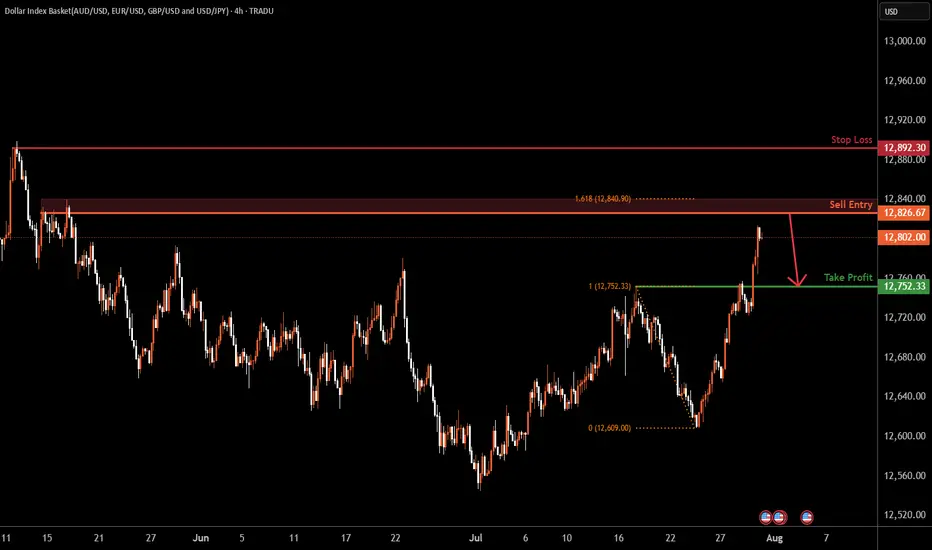
USDOLLAR H4 | Bearish reversalBased on H4 chart analysis, we can see the price rising towards the sell entry at 12,826.67, which is a swing high resistance.
Stop loss is at 12,892.30, which is a swing high resistance.
Our take profit will be at 12,752.33, which is a pullback support.
High Risk Investment Warning
Trading Forex/CFDs on margin carries a high level of risk and may not be suitable for all investors. Leverage can work against you.
Stratos Markets Limited (tradu.com ):
CFDs are complex instruments and come with a high risk of losing money rapidly due to leverage. 65% of retail investor accounts lose money when trading CFDs with this provider. You should consider whether you understand how CFDs work and whether you can afford to take the high risk of losing your money.
Stratos Europe Ltd (tradu.com ):
CFDs are complex instruments and come with a high risk of losing money rapidly due to leverage. 66% of retail investor accounts lose money when trading CFDs with this provider. You should consider whether you understand how CFDs work and whether you can afford to take the high risk of losing your money.
Stratos Global LLC (tradu.com ):
Losses can exceed deposits.
Please be advised that the information presented on TradingView is provided to Tradu (‘Company’, ‘we’) by a third-party provider (‘TFA Global Pte Ltd’). Please be reminded that you are solely responsible for the trading decisions on your account. There is a very high degree of risk involved in trading. Any information and/or content is intended entirely for research, educational and informational purposes only and does not constitute investment or consultation advice or investment strategy. The information is not tailored to the investment needs of any specific person and therefore does not involve a consideration of any of the investment objectives, financial situation or needs of any viewer that may receive it. Kindly also note that past performance is not a reliable indicator of future results. Actual results may differ materially from those anticipated in forward-looking or past performance statements. We assume no liability as to the accuracy or completeness of any of the information and/or content provided herein and the Company cannot be held responsible for any omission, mistake nor for any loss or damage including without limitation to any loss of profit which may arise from reliance on any information supplied by TFA Global Pte Ltd.
The speaker(s) is neither an employee, agent nor representative of Tradu and is therefore acting independently. The opinions given are their own, constitute general market commentary, and do not constitute the opinion or advice of Tradu or any form of personal or investment advice. Tradu neither endorses nor guarantees offerings of third-party speakers, nor is Tradu responsible for the content, veracity or opinions of third-party speakers, presenters or participants.
A Sleeping Giant in the Energy Sector?While everyone’s chasing the next hot AI stock, a quiet opportunity might be taking shape in the energy sector; and it could be a big one.
🔋 As AI data centers explode in size and number, the demand on our power grid is rising fast. Nuclear is still years away, and renewables are struggling to scale in time. That leaves oil and gas as the most reliable players; and one U.S. company may be perfectly positioned to ride that wave.
📊 Technical Analysis
NASDAQ:PROP PROP has been in a steady downtrend, moving within a falling wedge pattern (marked in green). Right now, it’s retesting the bottom of that wedge, typically where things get oversold.
Even more interesting, PROP bounced off a major monthly demand zone last week, a signal that buyers may be stepping in.
In the short term, if the blue demand zone holds, we could see a push toward the $7 mark, which lines up with the top of the wedge.
But to really confirm a medium-term reversal, we’ll need a clean break above the $8.3 resistance. If that happens, the door could open to a rally toward $15, a key level from early 2024.
🛢️ Why PROP? A Hidden Play With Room to Run
Prairie Operating Co. (NASDAQ: PROP) isn’t your typical small-cap oil stock. They own 65,000 acres in Colorado’s DJ Basin and use modern drilling tech to stay lean and efficient. That means they can still make money even when oil prices dip.
As energy demand continues to climb, PROP could be sitting in the sweet spot , especially with the world so focused on tech stocks. But behind every AI boom is a growing energy need, and companies like PROP are the ones powering it.
One well-known Wall Street firm recently gave PROP a Buy rating with a $21.75 price target; that’s a potential 281% upside from where it stands today. And that’s not even counting the potential boost from energy-friendly policies under the current administration.
📌 One to Watch in 2025
PROP might just be one of the most under-the-radar energy plays going into the new year.
The biggest moves often start quietly; and this one has all the ingredients to surprise.
➡️ As always, speak with your financial advisor and do your own research before making any investment decisions.
📚 Always follow your trading plan => including entry, risk management, and trade execution.
Good luck!
All strategies are good, if managed properly.
~ Richard Nasr

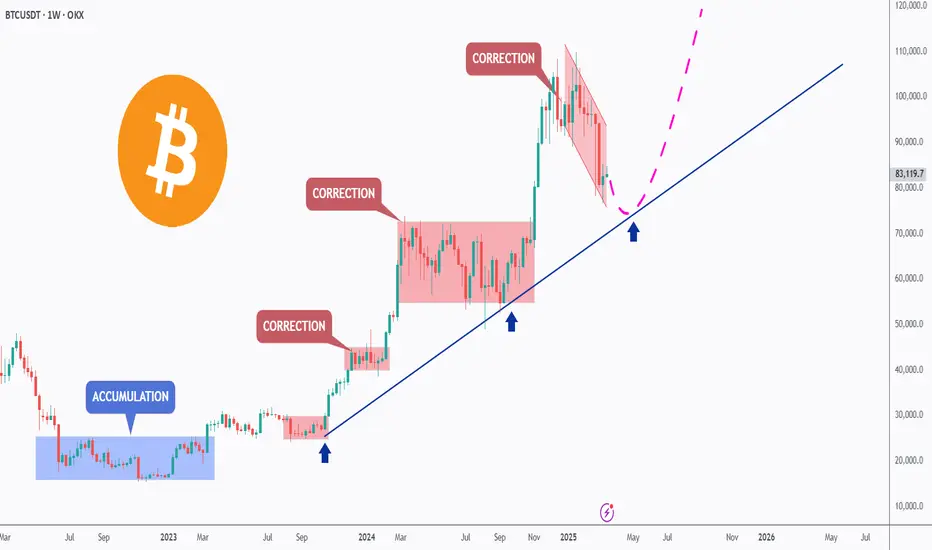
BTC - Bullish SOON!Hello TradingView Family / Fellow Traders. This is Richard, also known as theSignalyst.
BTC has been in a correction phase, and it feels like it's taking forever! ⏳
As long as the blue trendline holds, the overall bias remains bullish. 📈
As BTC approaches the blue trendline—perfectly aligning with a demand zone and support—we'll be watching for trend-following longs to catch the next big impulse move upward. 🚀
For now, we wait! ⏳
📚 Always follow your trading plan regarding entry, risk management, and trade management.
Good luck!
All Strategies Are Good; If Managed Properly!
~Rich
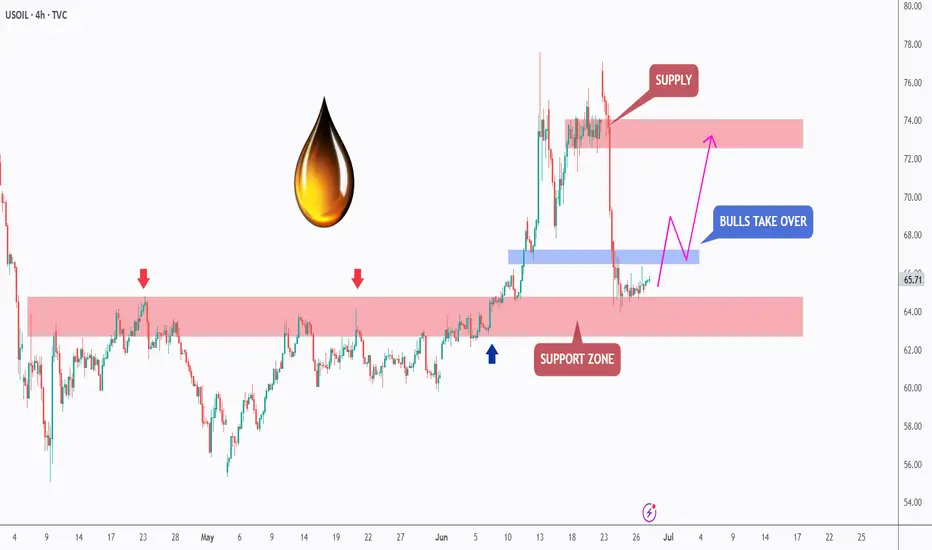
Cautious — this Chart is Slippery!Hello TradingView Family / Fellow Traders. This is Richard, also known as theSignalyst.
🛢️After surging by over 35% in the past two weeks, USOIL took a hit following Trump's announcement of a ceasefire between Iran and Israel.
However, from a technical perspective, USOIL is approaching a strong daily support zone marked in red.
As long as this support holds, the bulls remain in control.
📊The next bullish impulse will be confirmed upon a break above the last minor high marked in blue.
In such a scenario, a move toward the supply zone (also marked in red) would be expected.
📚 Always follow your trading plan regarding entry, risk management, and trade management.
Good luck!
All Strategies Are Good; If Managed Properly!
~Rich
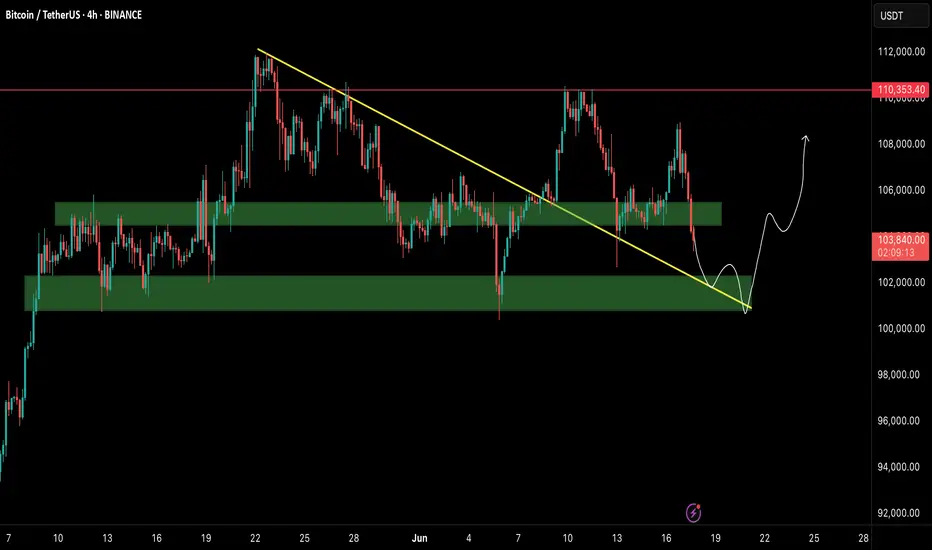
BTCUSDT Update — Big Macro Forces In Play!!Hey Traders!
If you’re finding value in this analysis, smash that 👍 and hit Follow for high-accuracy trade setups that actually deliver!
Bitcoin once again testing key support levels as global tensions continue to fuel uncertainty in the markets.
Chart Overview:
BTC broke down from short-term resistance and is now retesting the major support zone between $102K–$103K. The structure still remains within a broader consolidation range, but this support zone is absolutely critical for bulls to defend.
Immediate Resistance: $106K → $110K
Immediate Support: $102K → $100K
A breakdown below $100K could trigger deeper liquidations towards $95K–$98K, while a successful defense here could push BTC back toward previous highs.
Geopolitical Impact:
Global headlines are heavily influencing risk assets right now:
🇮🇱 Israel-Iran tensions are escalating.
🇺🇸 The US is signaling stronger involvement diplomatically, adding more fear to markets.
📉 Traditional markets have already started to show signs of caution.
Bitcoin, as a risk asset, remains vulnerable to these global macro shocks in the short term.
The Game Plan Right Now:
If we see sustained support at $102K–$103K, there’s still room for a relief bounce towards $106K–$110K in the near term.
However, if global tensions escalate further, expect increased volatility with downside liquidity grabs.
Stay cautious with tight risk management. Macro headlines are still driving sudden sentiment shifts.
📊 My Bias:
Watching for potential sweep of $102K with possible reversal structure forming. Any clear reclaim of $105K may signal a local bottom.
📝 Key Takeaway:
Global narratives are bigger than technicals right now. The next few days could dictate whether BTC holds or faces another sharp liquidation event.
Stay patient. Stay disciplined. And most importantly: manage your risk.
👉 Follow for more real-time updates as we track both price action and macro headlines impacting crypto.
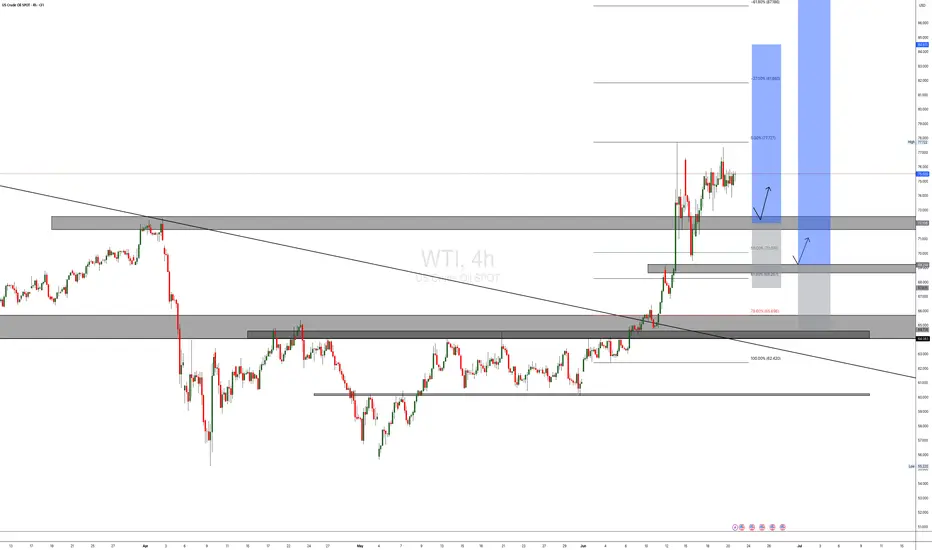
WTI POSSIBLE TRADE SETUPPotential Trade Setup on WTI
WTI has been on a strong 2-week rally, following the geopolitical escalation where Israel launched a preemptive attack on Iran. This event sparked a 2% surge, keeping prices hovering around $77 for the past two weeks.
Despite the bullish momentum, I am anticipating a healthy pullback before looking to engage.
My eyes are on two key zones:
- April High Region (Previous resistance turned support)
- 50% Fibonacci Retracement (Measured from recent rally low to high)
🧭 Trading Plan:
1. BUY: is currently the only play, and as I anticipate for a two-level of pullback on the 4H chart.
🟢 Risk-to-Reward:
Targeting 1:3 R/R on either entry.
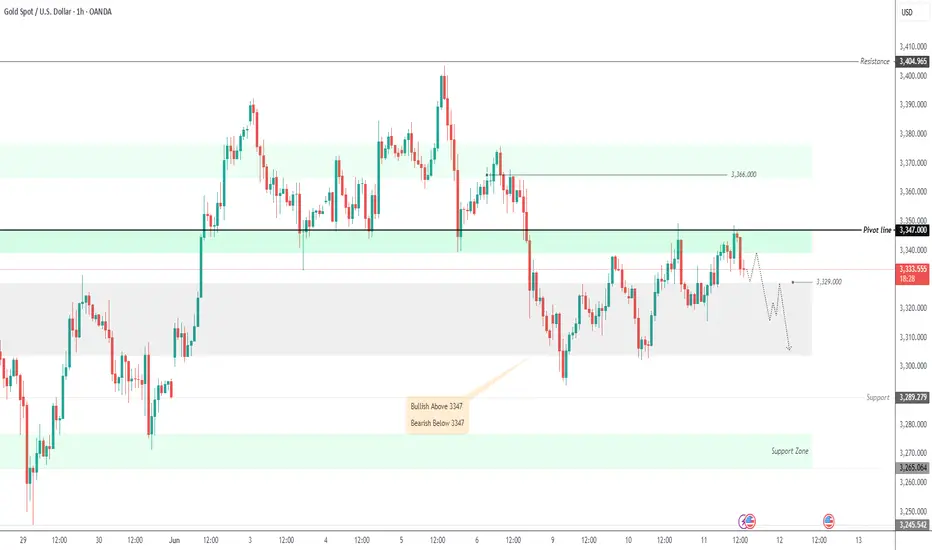
GOLD | CPI Data in Focus – Key Levels at 3347 and 3318GOLD | OVERVIEW
Gold remains under pressure due to ongoing U.S.–China trade tensions, with additional focus on the upcoming U.S. CPI data, which is expected to have a strong market impact.
Forecast CPI: 2.5%
Previous CPI: 2.3%
Current Scenario:
If the CPI comes in above 2.5%, it would signal stronger inflation, reducing the likelihood of rate cuts. This would pressure gold lower, continuing the downtrend toward 3318, then 3303, and possibly 3292.
Alternative Scenario:
If CPI is below expectations, it would suggest easing inflation and open the door for rate cuts—supportive for gold. In that case, a break above 3347 could lead to 3366, and then 3375.
Support Levels: 3318, 3303, 3292
Resistance Levels: 3347, 3366, 3375
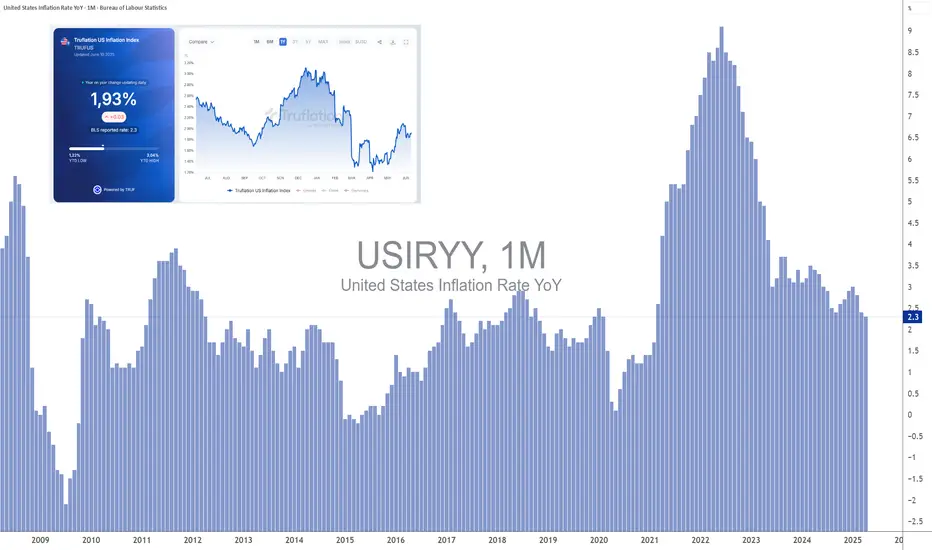
US INFLATION, a decisive figure this week!This week, which runs from Monday June 9 to Friday June 13, sees two fundamental factors which will have a strong impact on the stock market: the continuation of the trade diplomacy phase which is currently acting as a fundamental red thread (particularly between China and the United States) and, above all, the US inflation update according to the PCI price index on Wednesday June 11.
The key issue is to determine whether tariffs in the so-called reciprocal tariffs trade war have begun to trigger a rebound in inflation. This is what the US Federal Reserve (FED) is watching to determine whether or not it should resume cutting the federal funds rate, which has been on hold since last December.
1) Federal funds rate cuts have been on hold since the end of 2024
Unlike the European Central Bank and other major Western central banks, the FED has paused its key interest rate cut since the beginning of the year. The ECB's key interest rate, meanwhile, has been cut several times and now stands at 2.15%, i.e. a key interest rate considered neutral for the economy (i.e. neither an accommodating nor a restrictive monetary policy).
This divergence in monetary policy between the FED and the ECB is perceived as a risk by the market, while the trade war could end up having a negative impact on US economic growth.
2) The market does not expect the FED to resume cutting rates before September.
But Jerome Powell's Federal Reserve (FED) is taking a hard line, believing that the Trump Administration's trade war could undermine its efforts to fight inflation. Although the FED's inflation target of 2% is not far off, according to the latest ECP and CPI updates, the FED wants confirmation that companies have not passed on sharp price rises to compensate for the tariffs. This is why the inflation figures published this May have a decisive dimension at a fundamental level. The Fed will be able to resume cutting the federal funds rate if, and only if, disinflation is not threatened by the trade war.
3) This is why the ICP US inflation update on Wednesday June 11 is the fundamental highlight of the week.
This Wednesday, June 11, we'll be keeping a very close eye on the publication of US inflation according to the ICP. The monthly reading will be closely watched, as will the year-on-year nominal and underlying inflation rates.
The consensus is relatively pessimistic, with inflation expected to rebound at both monthly and annual rates. Real-time inflation, as measured by TRUFLATION, is still under control, so the pessimistic consensus may be overturned.
DISCLAIMER:
This content is intended for individuals who are familiar with financial markets and instruments and is for information purposes only. The presented idea (including market commentary, market data and observations) is not a work product of any research department of Swissquote or its affiliates. This material is intended to highlight market action and does not constitute investment, legal or tax advice. If you are a retail investor or lack experience in trading complex financial products, it is advisable to seek professional advice from licensed advisor before making any financial decisions.
This content is not intended to manipulate the market or encourage any specific financial behavior.
Swissquote makes no representation or warranty as to the quality, completeness, accuracy, comprehensiveness or non-infringement of such content. The views expressed are those of the consultant and are provided for educational purposes only. Any information provided relating to a product or market should not be construed as recommending an investment strategy or transaction. Past performance is not a guarantee of future results.
Swissquote and its employees and representatives shall in no event be held liable for any damages or losses arising directly or indirectly from decisions made on the basis of this content.
The use of any third-party brands or trademarks is for information only and does not imply endorsement by Swissquote, or that the trademark owner has authorised Swissquote to promote its products or services.
Swissquote is the marketing brand for the activities of Swissquote Bank Ltd (Switzerland) regulated by FINMA, Swissquote Capital Markets Limited regulated by CySEC (Cyprus), Swissquote Bank Europe SA (Luxembourg) regulated by the CSSF, Swissquote Ltd (UK) regulated by the FCA, Swissquote Financial Services (Malta) Ltd regulated by the Malta Financial Services Authority, Swissquote MEA Ltd. (UAE) regulated by the Dubai Financial Services Authority, Swissquote Pte Ltd (Singapore) regulated by the Monetary Authority of Singapore, Swissquote Asia Limited (Hong Kong) licensed by the Hong Kong Securities and Futures Commission (SFC) and Swissquote South Africa (Pty) Ltd supervised by the FSCA.
Products and services of Swissquote are only intended for those permitted to receive them under local law.
All investments carry a degree of risk. The risk of loss in trading or holding financial instruments can be substantial. The value of financial instruments, including but not limited to stocks, bonds, cryptocurrencies, and other assets, can fluctuate both upwards and downwards. There is a significant risk of financial loss when buying, selling, holding, staking, or investing in these instruments. SQBE makes no recommendations regarding any specific investment, transaction, or the use of any particular investment strategy.
CFDs are complex instruments and come with a high risk of losing money rapidly due to leverage. The vast majority of retail client accounts suffer capital losses when trading in CFDs. You should consider whether you understand how CFDs work and whether you can afford to take the high risk of losing your money.
Digital Assets are unregulated in most countries and consumer protection rules may not apply. As highly volatile speculative investments, Digital Assets are not suitable for investors without a high-risk tolerance. Make sure you understand each Digital Asset before you trade.
Cryptocurrencies are not considered legal tender in some jurisdictions and are subject to regulatory uncertainties.
The use of Internet-based systems can involve high risks, including, but not limited to, fraud, cyber-attacks, network and communication failures, as well as identity theft and phishing attacks related to crypto-assets.
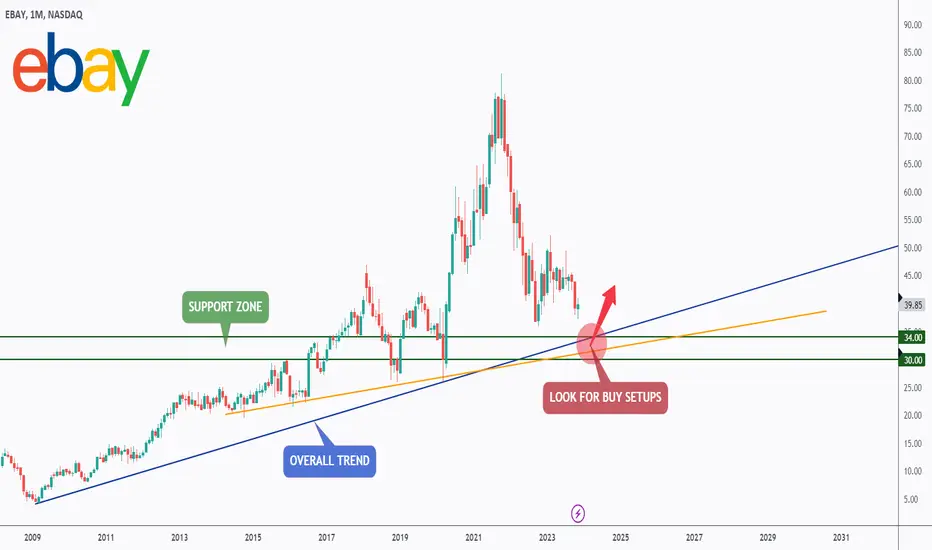
ebay is on sale 🛒Hello TradingView Family / Fellow Traders. This is Richard, also known as theSignalyst.
📈 EBAY has exhibited an overall bullish trend , trading above the orange and blue trendlines.
At present, EBAY is undergoing a correction phase and it is currently approaching a strong support zone 30 - 34
🏹 Thus, the highlighted red circle is a strong area to look for buy setups as it is the intersection of the green support and lower blue and orange trendlines acting as a non-horizontal support.
📚 As per my trading style:
As #EBAY approaches the lower red circle zone, I will be looking for bullish reversal setups (like a double bottom pattern, trendline break , and so on...)
📚 Always follow your trading plan regarding entry, risk management, and trade management.
Good luck!
All Strategies Are Good; If Managed Properly!
~Rich
MSTR - The Saylor in the Storm!Hello TradingView Family / Fellow Traders. This is Richard, also known as theSignalyst.
📈MSTR has been overall bullish trading within the rising channel marked in blue. (log chart)
Currently, it is in a correction phase within the falling red channel.
Moreover, the red zone is a strong demand.
🏹 Thus, the highlighted blue circle is a strong area to look for buy setups as it is the intersection of demand and lower trendlines acting as non-horizontal support.
📚 As per my trading style:
As #MSTR approaches the blue circle, I will be looking for bullish reversal setups (like a double bottom pattern, trendline break , and so on...)
📚 Always follow your trading plan regarding entry, risk management, and trade management.
Good luck!
All Strategies Are Good; If Managed Properly!
~Rich

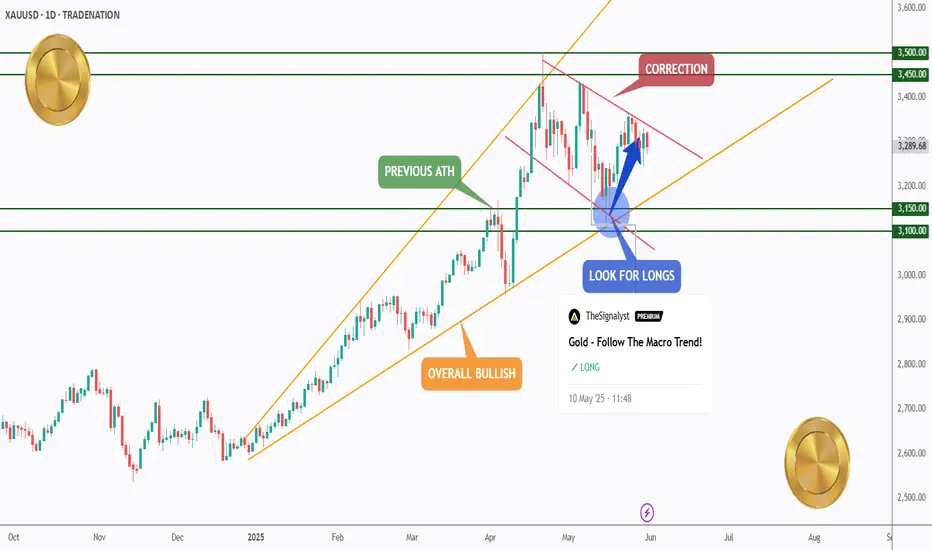
Gold - Correction Phase Extended!Hello TradingView Family / Fellow Traders. This is Richard, also known as theSignalyst.
📈 As per our latest Gold analysis, price rejected the $3,100 – $3,150 support zone and traded higher.
However, Gold is still in a correction phase, moving within a falling red channel.
This week, it has been rejecting the upper bound of the channel, reinforcing bearish pressure.
⛔ As long as the upper red trendline holds, the bears remain in control.
✅ For momentum to shift back in favor of the bulls, a clear break above the upper red trendline is needed.
📚 Always follow your trading plan regarding entry, risk management, and trade management.
Good luck!
All Strategies Are Good; If Managed Properly!
~Rich
Disclosure: I am part of Trade Nation's Influencer program and receive a monthly fee for using their TradingView charts in my analysis.
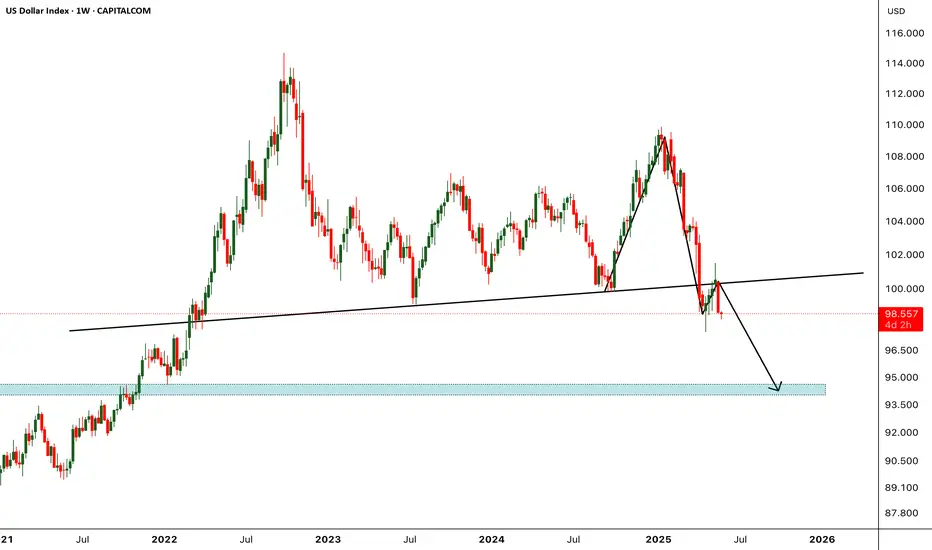
US Dollar Index - Classic Bearish PatternUS Dollar index has successfully broken down from the previous support which held strongly in the past, after support broke we saw successful retest of the support as the new resistance and got rejected from the resistance, now its heading towards the next support
Follow Our TradingView Account for More Technical Analysis Updates, | Like, Share and Comment Your thoughts.
Cheers
GreenCrypto