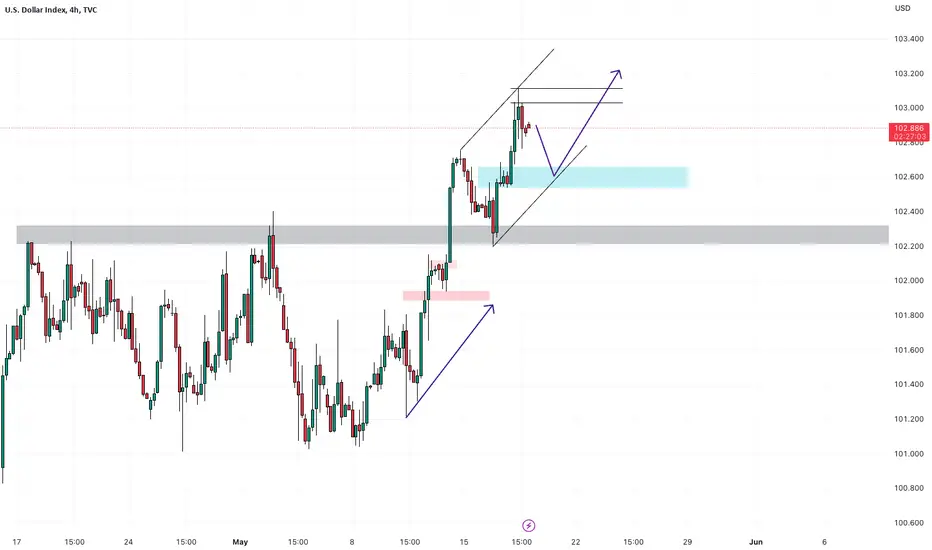
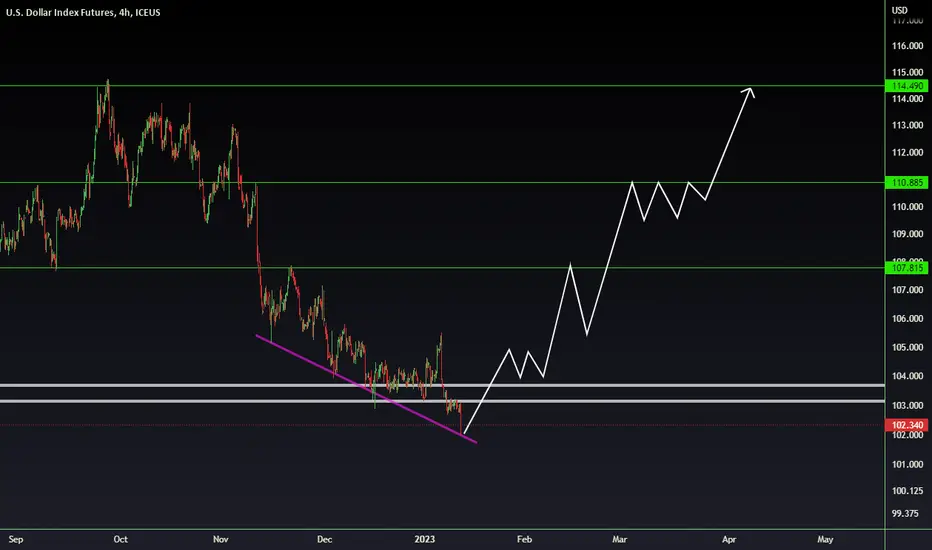
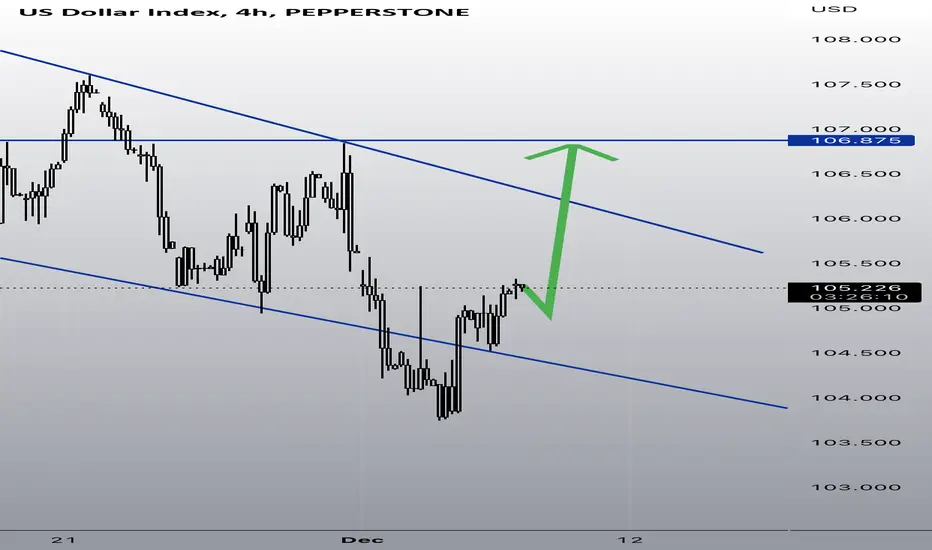
Important market price Dollar IndexThe Bullish Channel is continuously gaining strength from a strong pullback from the 99.581 zone after a support breakout. Now at the current level, the US Dollar Index at 102.894 is a very important level and a resistance level in H4.
As per the channel, the US Dollar will fall to 102.440 to give respect to its Demand zone.
With the channel formed and the major zone marked, the dollar is gaining strength day by day and will touch the 104.500 zone.
As per the gold and major pairs, they will shortly show some bullish movement with short wave corrections in the US dollar price, but the us dollar will be in a bullish trend.
Fundamental market movements will also have a positive impact on the dollar.
The Key zone in US dollar from short reversal;
1- 102.894
2- 103.443
3- 103.714
Mark the US Dollar Index chart, and you will get some good pips in Gold and major currency pairs for short-term bullish movement.
Note: Keep an eye on the US Dollar Economic Currency calendar for better understanding.
US-DOLLAR

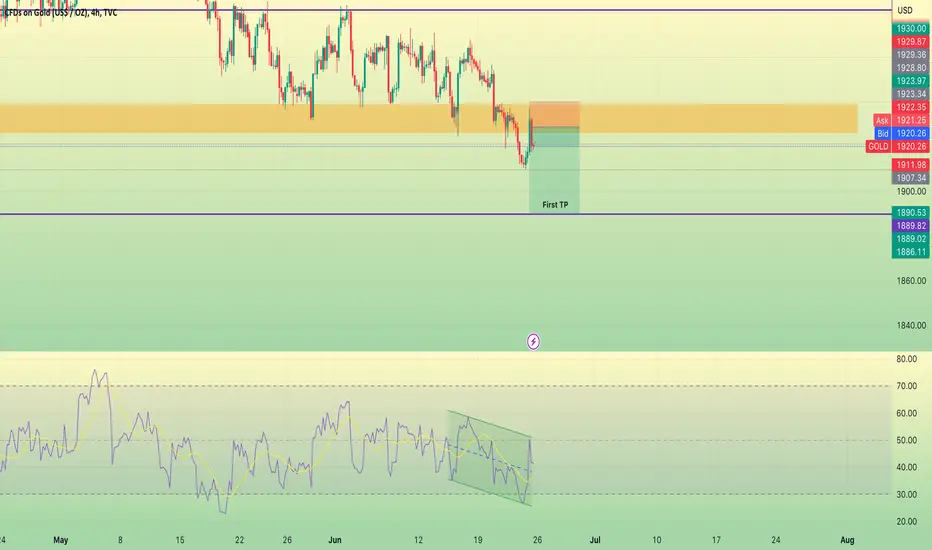
Bearish Gold WEEK ?Gold took a hit this week as the dollar rebounded after the Bank of England raised interest rates by half a percentage point — twice more than forecast — saying it needed to act against "significant" indicators that British inflation would take longer to fall. U.K.’s main interest rate is now at 5%, the highest since 2008 after the largest rate increase since February. For me the gold metal will go a little bit down . Wha do you think traders , Am I right ?
USDJPY LONG & SHORT SETUP - US NEWSDuring the European session, the US/JPY pair remains stagnant, trading within a limited range just below the significant resistance level of 140.00. The market is characterized by volatile fluctuations as investors adopt a cautious approach in anticipation of the upcoming release of US inflation data.
In London, S&P500 futures have gained as investors hope the Fed will delay interest rate hikes and weaken the US Dollar. The US Dollar Index reached a two-week low at 103.21 due to expectations of a neutral interest rate policy and softening US inflation. Analysts predict May's CPI will remain unchanged, but core inflation will stay strong. The Bank of Japan is likely to maintain its interest rate policy, aiming for inflation above 2%.
Nicola, CEO of Forex48 Trading Academy

USD ANALYSISwe saw the us is in a bull big MOOVE. we expect a correction to the HH than a continuation to the top. any ideas guy!?
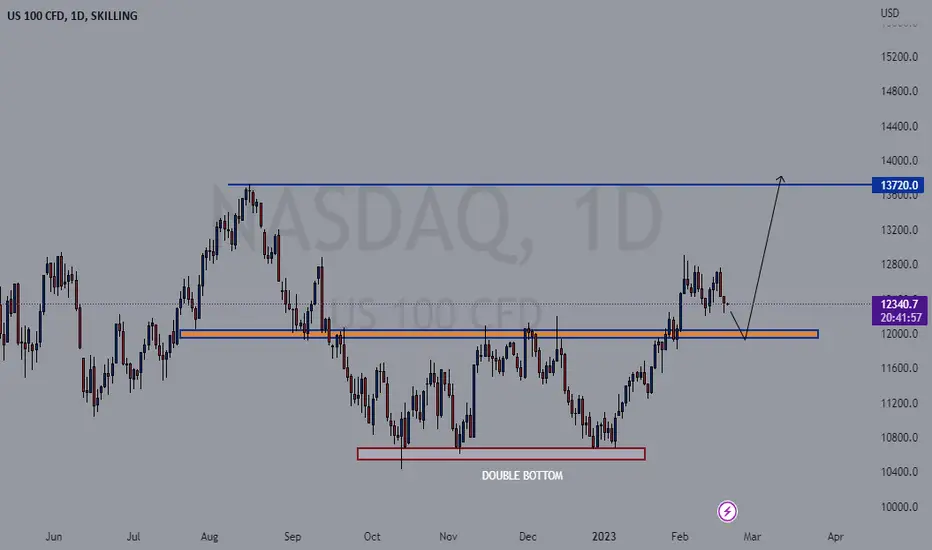
NASDAQ BUYS TO THE MOONThe weekly and daily timeframe is showing a bullish trend, and remember the idea of the CADCHF setup I posted, this is what was expected to happen there.
What do we expect here? A retest to 12000 SUPPORT zone and a bullish move to 13720. This is a long term buy for NASDAQ.
Please do share, and give a follow to support.
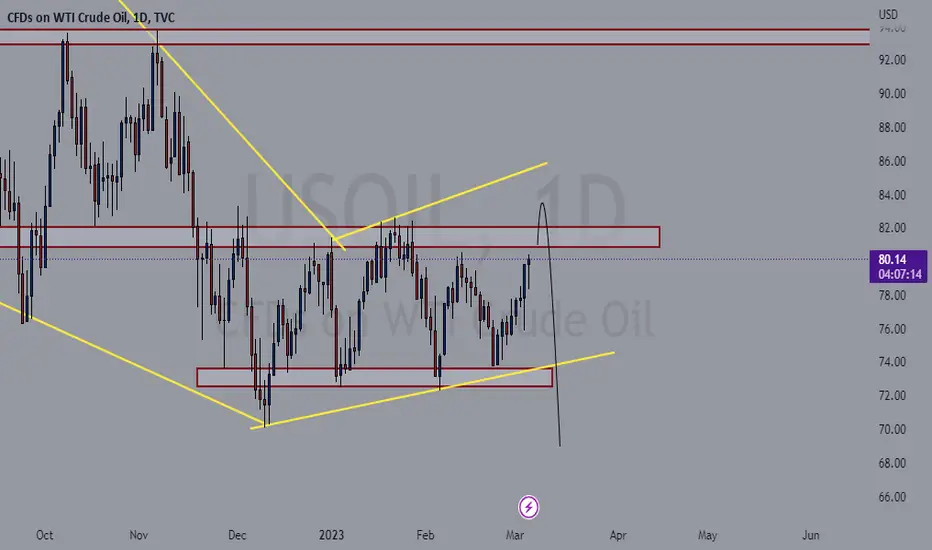
OIL STILL TO REDUCE PRICE TO LAST YEAR'S LOWWhy this?
Price is approaching a high resistance zone and might surpass February's high, then move to the yearly highs of 82.50 giving a false bullish move and then sell more.
We can also spot the continuation pattern that shows price agreement tothe downside.
Where am I expecting price to sell to?
Well the lows of 2022 which is 70.00.
Please do share, and give a follow to support.
DXY up for now. Powell says so…Headlines today: Fed Chair Powell says interest rates are ‘likely to be higher’ than previously anticipated.
DXY was at a solid resistance cooled off for a bit under it, and it just broke that resistance to the upside.
If interest rates need to continue to be raised we would expect more upside in the DXY.
Rate hikes continue as expected -> DXY will follow traditional technical analysis as expected.
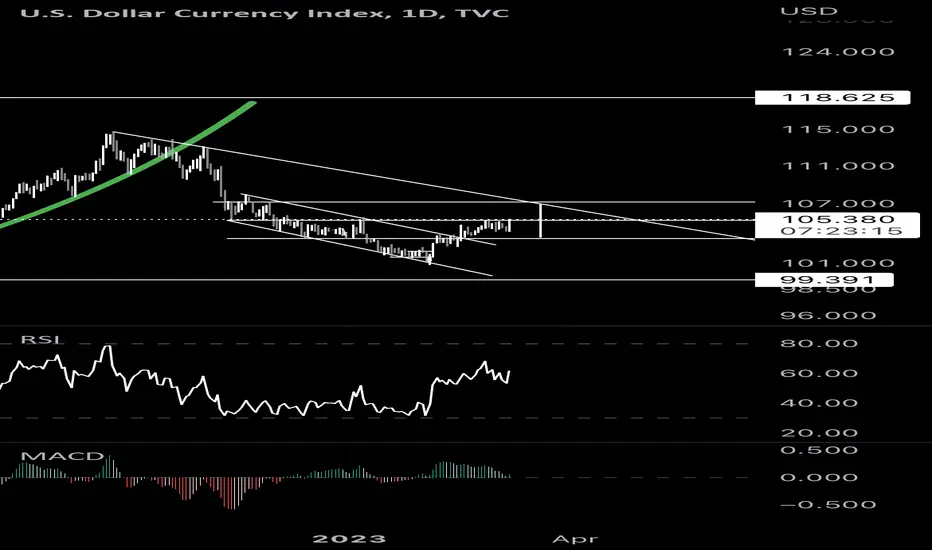
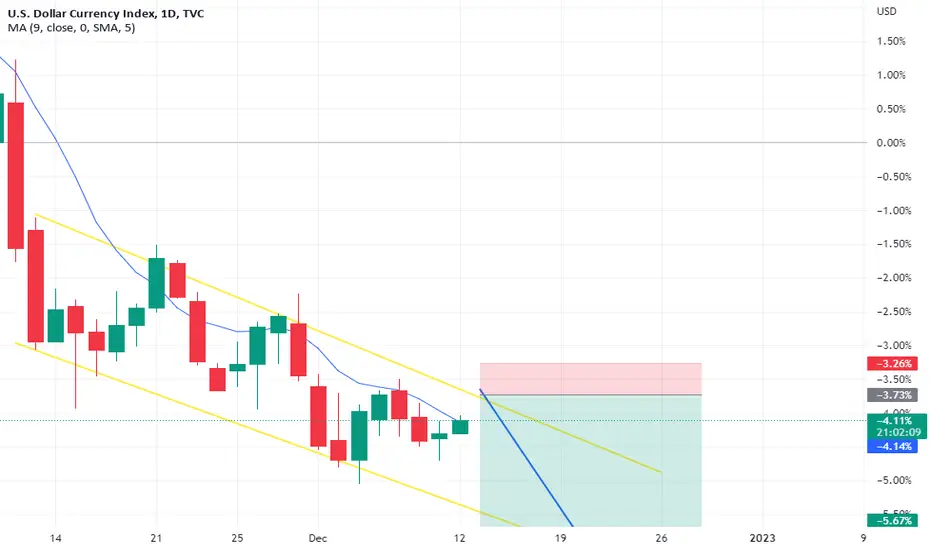
I used the measure rule to calculate possible target for descending channel upward breakout.
It aligns perfectly with a diagonal supply line going back months. Would be poetic to see PA reject at the diagonal and horizontal resistances, which exactly align with the measured move from the descending channel.
(see the vertical white line, the width of the channel)
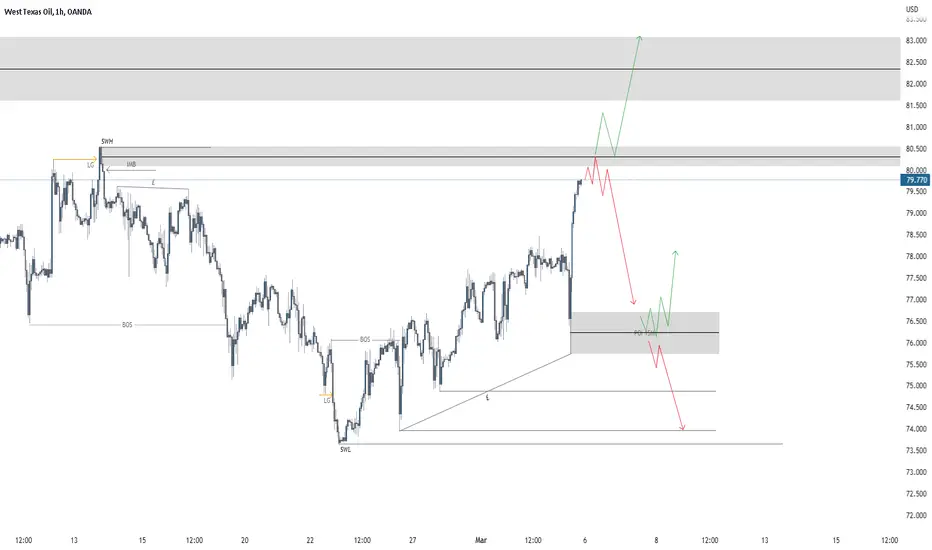
WTI-Oil 5TH MARIs Sunday again with starting our analysis off with WTI oil.
For us it's a pretty simple setup this week. We're looking for a play off of the supply at the high of our swing, we're looking for price to drop down lower towards the 15 minute demand that we have highlighted below.
Now of course, if we don't get a reaction at this supply. We will look for price to travel back down to buy up into the triple top we have on the daily time frame.
Make sure that you always use your confirmations to get into a trade and always be flexible with your analysis. Remember, sticking to your trading plan and consistently entering the same setups will bring you profitability.
If you like this idea, drop us a boost and a comment down below.
We hope you all have a profitable and successful trading week.
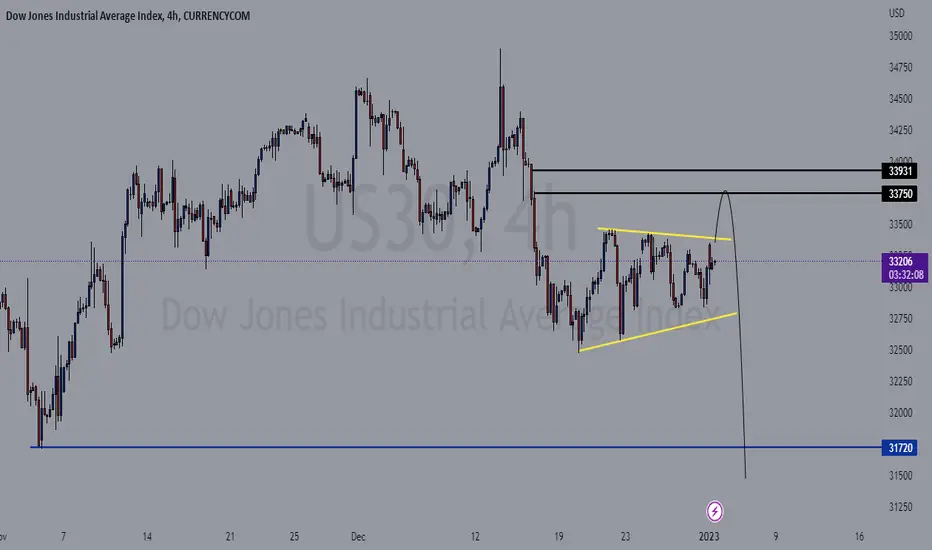
US30 TO 31700A peak was made when price was almost at 35000 and it has been bearish ever since, currently price is forming a bearish penant pattern that I expect that price will fill the imbalance at 33750 before it sells to 31700.
DX1💥4H-TIMEFRAME ANALYSISDX1💥4H-TIMEFRAME ANALYSIS
💗Hello ladies and gentlemen
This is my new idea for 💥DOLLAR INDEX
I hope my idea is clear
Support me by like and share thank you
Stay Safe💯💲💲💲
Good luck💰😍
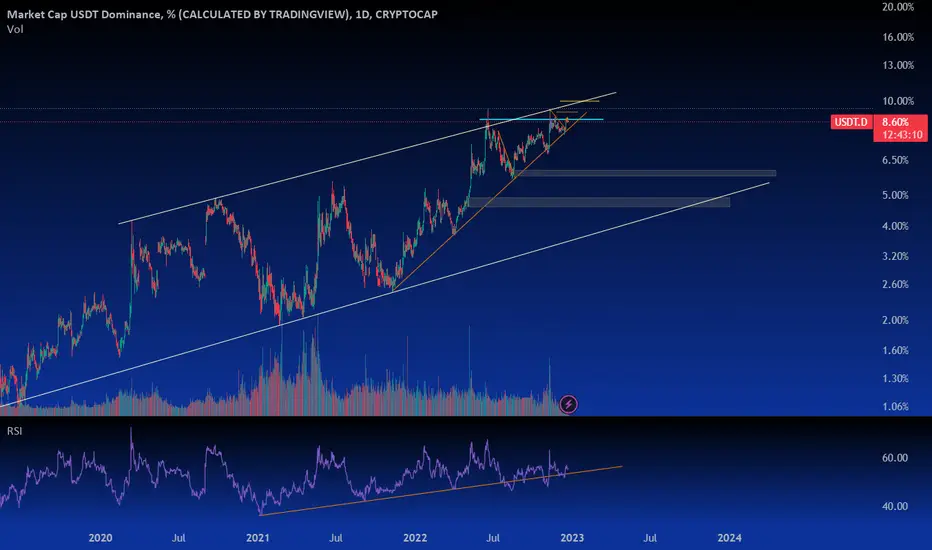
usd.dHello, do not be tired
Everything is clear on the chart
One of the scenarios that is much more likely to happen than other scenarios
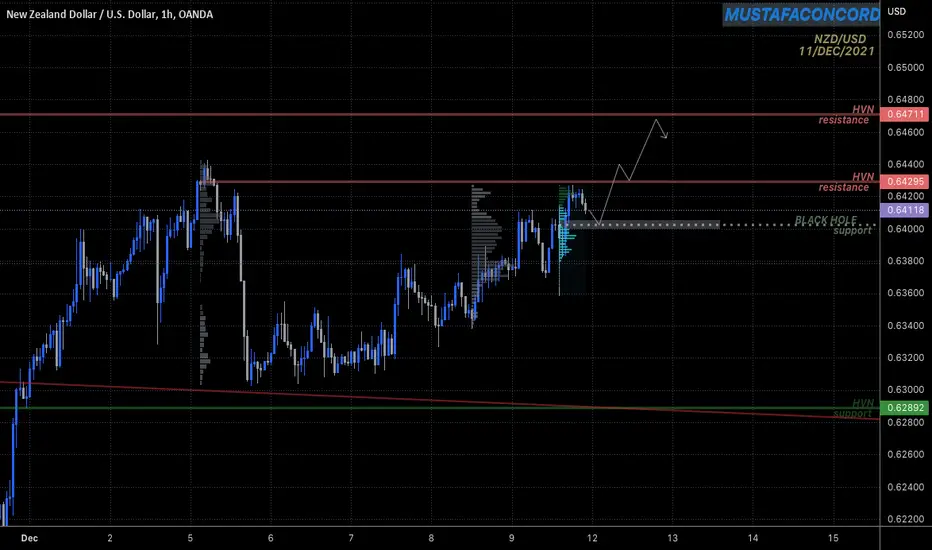
SHORT TERM RUN we expect price back to the blackhole acting as support to push the price up words to the next resistance level
if break it we will extend the profit to the last resistance level at 1H time frame as shown on the chart
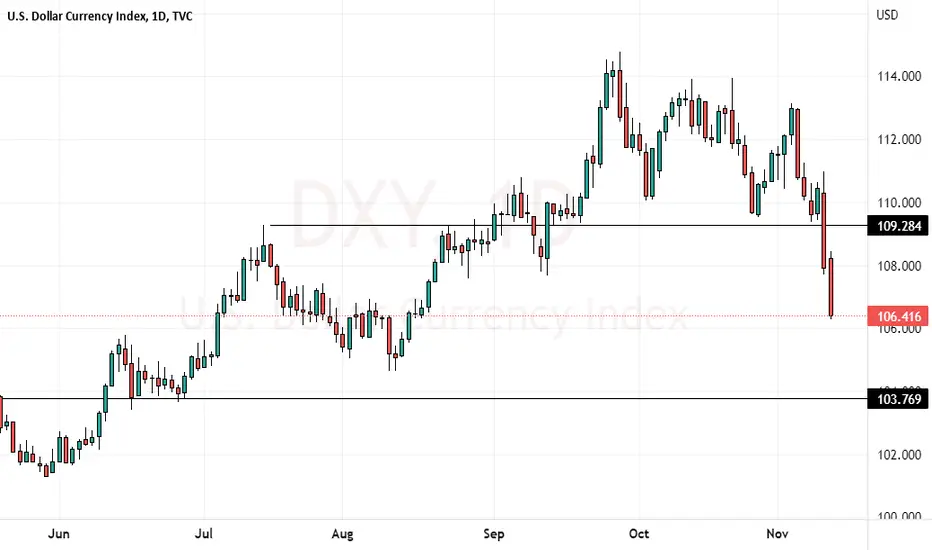
Downward Dollar Trend
The Dxy is following a downward channel, looking for the dxy to continue this trend and looking a short for this week.
DXY just need a little restDxy is backing down for a new pair of jordan. All is to run faster and jump higher. Here is the level I expected.
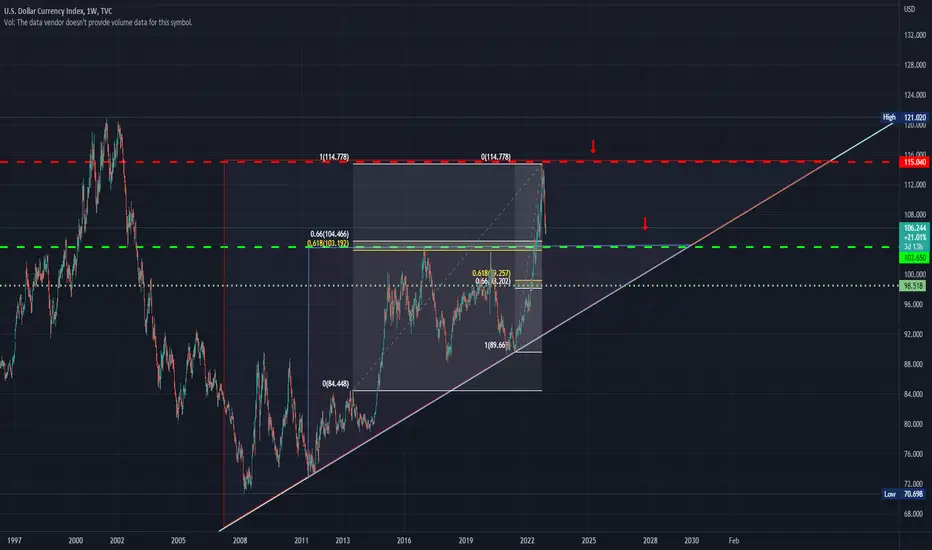
US Dollar Currency Index (DXY)US Dollar Currency Index (DXY)
1W hollow candlesticks
After an ATH (All-Time High), the US Dollar Index appears to be finding its first major support area, which occurs from the golden ratio of the Fibonacci Retracement sequence.
Two triangles are formed, two ascending triangles.
In the first triangle, the breakout will occur at the end of 2022.
Certainly from the new year, it is most likely to break the Resistance area, located at 103.650, as it will then enter the second smaller triangle.
Towards the end of 2023 or even earlier, seems to be the next support area, which is clearly seen by the extension of a second Fibonacci Retracement.
The point is that the dollar is starting to lose value, while the euro is gaining, as also Forex market is starting to lose ground.
That's for now.
Good luck.
#CryptoHellas Team
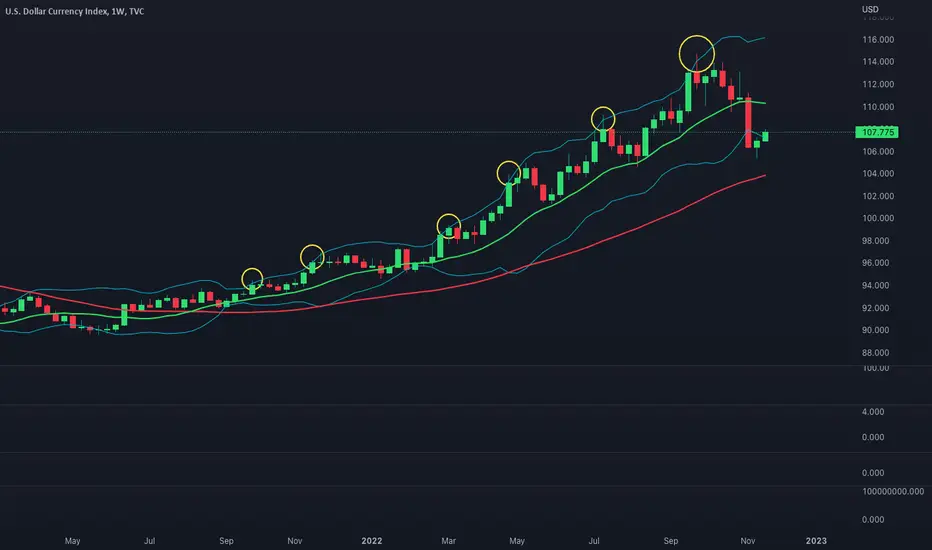
US dollar DXY sell strategyDXY weekly chart.
I find a great time to sell, is when the price breaks the Bollinger channel to the upside. An aggressive strategy for sure, but can nail the tops.
IMPORTANT
-price can keep climbing so I rebuy if it runs up past my sell.
None of this should be interpreted as financial advice, I am not a professional or certified financial adviser! all charts, and or analysis' are my personal opinions and observations only!
US DOLLAR CURRENCY INDEX Breackdown the chartUS Doller very log time this type of move i will see, This is good for the Indian and other currencey
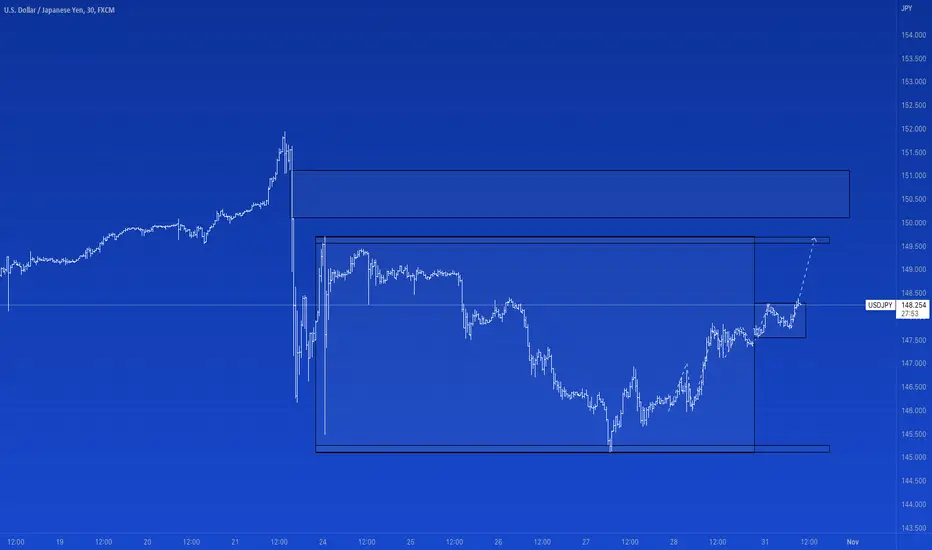
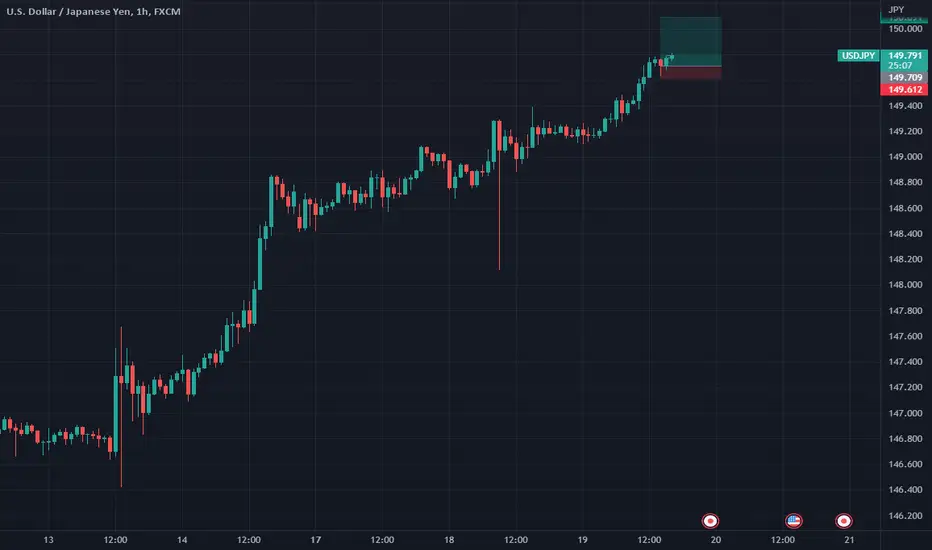
USDJPY continues to trade higher within a range150.00 is obviously an important level for the market. The BoJ certainly took notice at the breach of that level. The current intra-day trend is higher, with the US dollar appreciating against a basket of currencies.
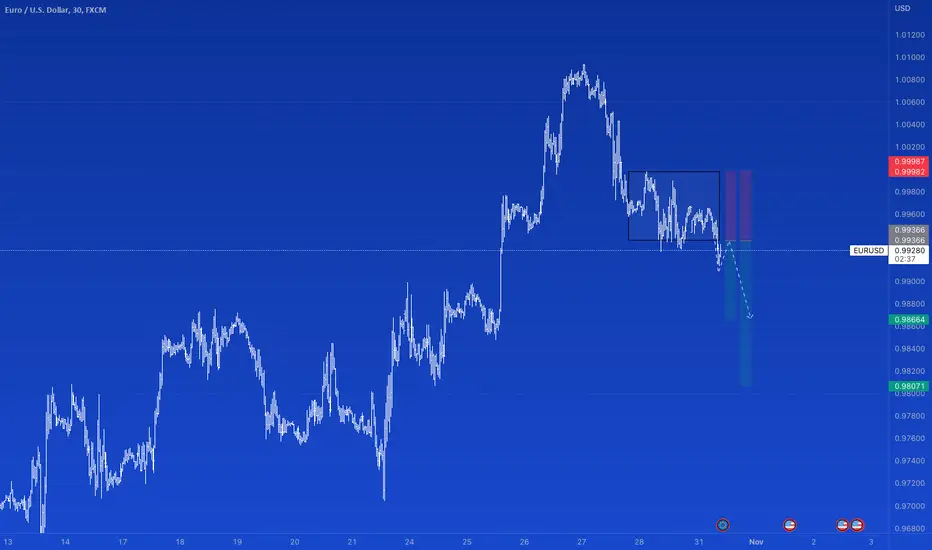
EURUSD Consolidation BreakoutThe EURUSD is attempting to break out of this period of consolidation. The DXY confirms that the direction of travel this morning for the US dollar is higher, so the EURUSD sell signal on the 'Classic Retest' is valid.
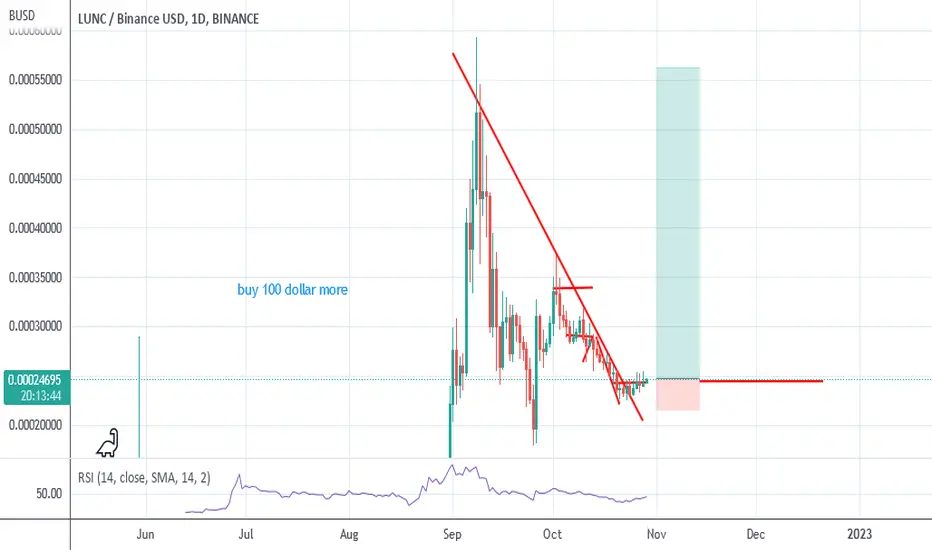
LUNCBUSDMost likely LUNCBUSD remain in Buy for more years or even touch 0.5 or more so, so according to technical analysis i will give very big profit
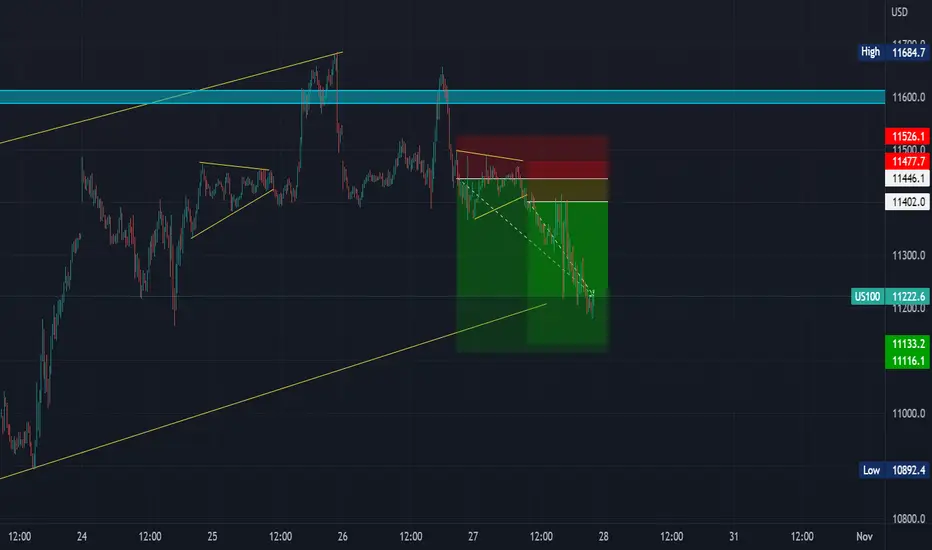
US100For the method and strategy I used, this was a long trade but still easily manageable and highly profitable. With how this played out, we got to see that US30, US500 & US100 are not the same but have few similar characteristics. They all volatile, influenced heavily by fundamentals and easily misunderstood. My hate of overnight trades wants me to close, but rather I am letting my trade hit one of my exit points. SL has been moved into profit with more than enough breathing room.
Tomorrow we try again.
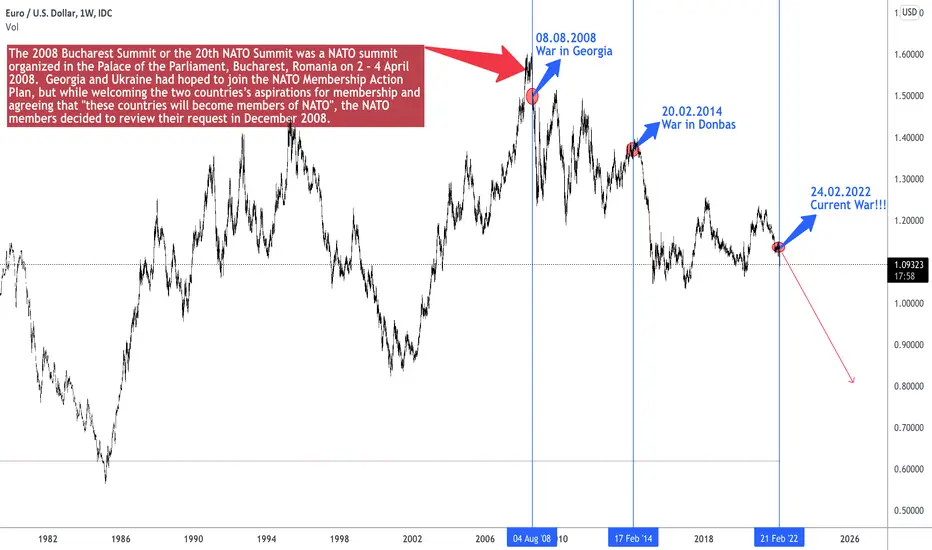
EURUSD forecast Dollar continue bullish moves started in 2008. Positive year for USD. Let's see how fundamentals helps to continue this trend.