FOREX WEEKLY FORECAST: GOLD, SILVER, US INDICES, US OILXAUUSD,XAGUSD, NAS100, US30, US OIL.
I mistakenly skipped SPXX.
Going to have to be patient for the swing trade setups, but I do see possible day trades setting up.
Which of these seems the most likely to render us some profits? Let me hear from you in the comments section.
Thanks for your support!
US

NASDAQ Fib Levels and more symbols regardlessLet's talk about US Markets first. Dow Jones (daily Buy) is moving in the direction 34574.2 gaining %0.13. NASDAQ (Buy) is 13747.51 points, following its trendline falling % -0.01. Also on the chart, important Fib lines are drawn. S&P 500 (signalling Buy) is 4203.47 high, falling % -0.02.
Silver troy ounce (31.10 gram) 28.125 USD (percentage of 0.4, Buy signaling) and Platinum , 1199.2 USD (1.42 of pct, Neutral) are finding buyers/sellers presently. Ounce palladium 2866.5 USD (%1.5) costs for traders.
Copper 1 pound (0.4535 kg), 4.654 USD (with the percentage of -0.5, Buy) is being traded at the time written. Besides this, XAUUSD, 1902.7 USD (%-0.14, Buy) going along its trendline.
American Dollar index (DXY) 89.886 is pushing itself (%0.06 Buy) on the line again. USDTRY is signalling Neutral along with the price of 8.5105 TRY (%0.0312 ) and Euro TL (signalling Neutral) is currently being traded with 10.40538 TRY (pct 0.02327).
Exchange Istanbul (BIST100) (signalling Neutral) is moving with 1432.04, gaining %0.81. Asian stock markets may tell us more. Shanghai Composite (SSEC) (Buy) is 3624.7137, gaining %0.26. NIKKEI (Buy) is followed by 28814.12, falling % -0.16.
German DAX is at the high of 15567.36, gaining %0.95 (Strong Buy). UK100 index 7080.47 is gaining %0.82 (providing Buy signals).
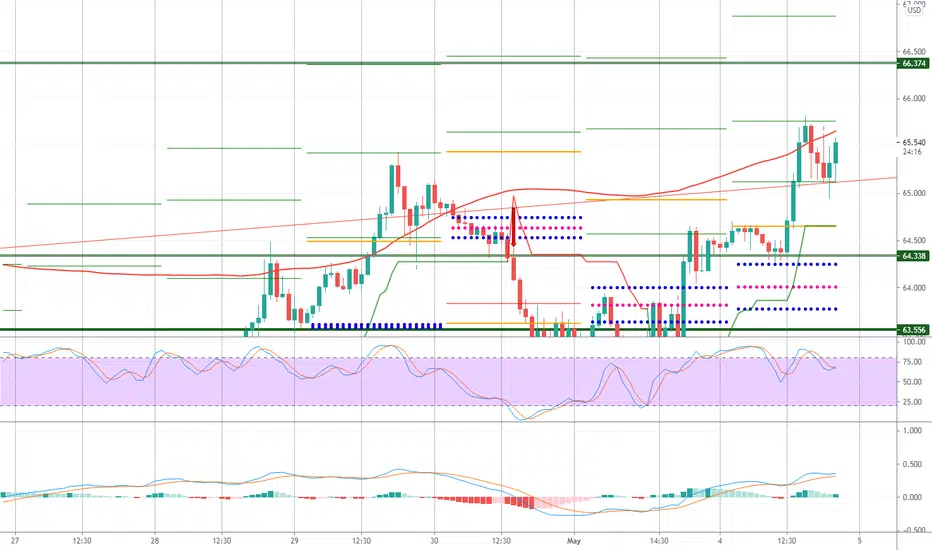
USDCAD, USDJPY and USDCHF trade ideas!USDCAD, USDJPY and USDCHF are setting up for some pretty decent intraday trades. I am looking to take swing trades in these pairs, but while they are taking their time setting up, I see shorter term opportunities.
I just wanted to share them for your consideration.
Comment on them,if you would! I'd love to hear from you!

EU- EUR / USD ANALYSISEUR / USD- EURO Vs. UNITED STATES DOLLAR- Daily Time Frame Chart Analysis + Market Bias/Market Trend + Key Weekly & Daily Time Frame Chart Market Levels ✬✬✬✬✬✬✬✬✬✬✬✬✬✬✬✬✬✬✬✬✬✬✬✬✬✬✬✬✬✬✬✬✬✬✬✬✬✬✬✬✬✬✬✬✬✬✬✬✬✬✬✬✬✬✬✬✬✬✬✬✬✬✬✬✬✬✬✬✬✬✬✬✬✬✬✬✬✬✬✬✬✬✬✬✬✬✬✬✬✬✬✬✬✬✬✬✬✬✬✬✬✬✬✬
#1. D1-DTFC MARKET TREND
✬- MARKET TREND / MARKET BIAS- THE DAILY TIME FRAME CHART MARKET TREND / MARKET BIAS-✬
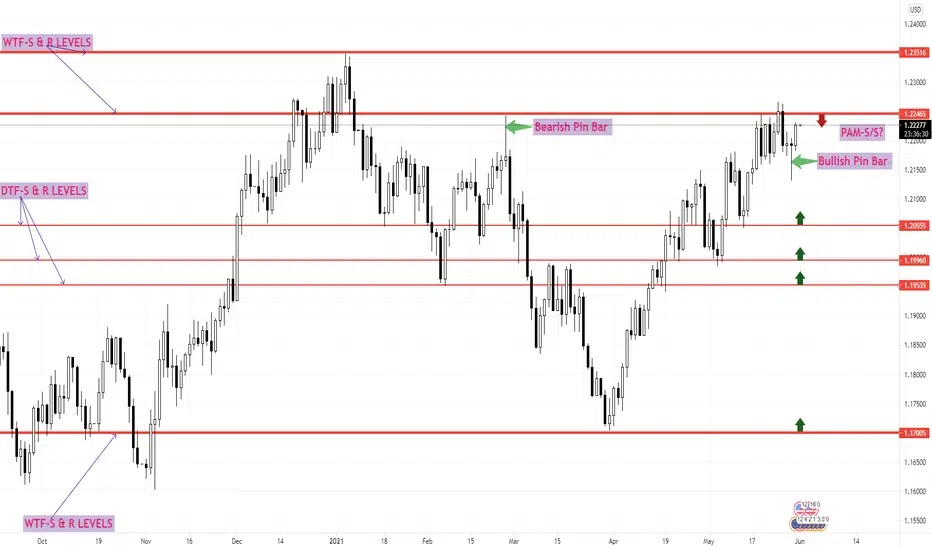
MARKET TREND / MARKET BIAS- The Overall Daily Time Frame Chart Market Trend As Of Right Now Is - The Market Is In A Bullish Trend
The Market Has Been In An Uptrend Since The 23rd Of March, 2020
It Has Been Constantly Rising And Making HH- HIGHER-HIGHS & HL- HIGHER-LOWS
1. The Market Began Pushing Higher Up Where It Broke Thorough The Key Daily Time Frame Chart Market Level Of Resistance At 1.19535 Where Price Then Consolidated For About 2 Days... Then Continued The Push Higher Up
2. Price Then Pushed Higher Up Where It Broke Through The Key Daily Time Frame Chart Market Level Of Resistance At 1.20555 Where It Then Pulled Back And Encountered A Key Daily Time Frame Chart Market Support Level At 1.9960...
3. Price Then Pushed Higher Up... Broke Past The Key Daily Time Frame Chart Market Level Of Resistance At 1.20555... Then Pulled Right Back Down To The Key Daily Support Level At 1.9960... Where Price Skyrocketed Immensely
4. As You Can Clearly See There Was A Pullback To The Key Daily Time Frame Chart Level Of Support At 1.20555
5. Price Then Pushed Higher Up Where It Experienced Some Consolidation And Some Interaction With The Key Weekly Time Frame Chart Market Level Of Resistance At 1.22465... Price The Pulled Back... Where It Created A BULLISH PIN BAR... Buy Signal...
✬✬✬✬✬✬✬✬✬✬✬✬✬✬✬✬✬✬✬✬✬✬✬✬✬✬✬✬✬✬✬✬✬✬✬✬✬✬✬✬✬✬✬✬✬✬✬✬✬✬✬✬✬✬✬✬✬✬✬✬✬✬✬✬✬✬✬✬✬✬✬✬✬✬✬✬✬✬✬✬✬✬✬✬✬✬✬✬✬✬✬✬✬✬✬✬✬✬✬✬✬✬✬✬
#2. W & D1-TFC KEY MARKET LEVELS
✬- KEY WEEKLY & DAILY TIME FRAME CHART MARKET LEVELS OF SUPPORT AND RESISTANCE-✬
Analysis Of The Weekly Time Frame Chart & Analysis Of The Daily Time Frame Chart
The Weekly Time Frame Chart Market Levels of Resistance & the Weekly Time Frame Chart Market Levels of Support- Shown On Chart
The Daily Time Frame Chart Market Levels Of Resistance & the Daily Time Frame Chart Market Levels of Support- Shown on Chart
THE KEY WEEKLY TIME FRAME CHART MARKET LEVELS OF SUPPORT AND RESISTANCE ARE:
A Key Weekly Resistance Level At- 1.23516
A Key Weekly Resistance Level At- 1.22465
A Key Weekly Support Level At- 1.17005
THE KEY DAILY TIME FRAME CHART MARKET LEVELS OF SUPPORT AND RESISTANCE ARE:
A Key Daily Support Level At- 1.20555
A Key Daily Support Level At- 1.19960
A Key Daily Support Level At- 1.19535
✬✬✬✬✬✬✬✬✬✬✬✬✬✬✬✬✬✬✬✬✬✬✬✬✬✬✬✬✬✬✬✬✬✬✬✬✬✬✬✬✬✬✬✬✬✬✬✬✬✬✬✬✬✬✬✬✬✬✬✬✬✬✬✬✬✬✬✬✬✬✬✬✬✬✬✬✬✬✬✬✬✬✬✬✬✬✬✬✬✬✬✬✬✬✬✬✬✬✬✬✬✬✬✬
#3- PA MARKET TRADING SIGNALS / SETUPS
As Of Right Now I Am Only Looking For PRICE ACTION MARKET TRADING SIGNALS / SETUPS That May Form / Develop At / From That Key Weekly Time Frame Chart Market Level Of Resistance
✬✬✬✬✬BE ON THE LOOKOUT FOR THE FORMATION / CREATION OF PRICE ACTION MARKET TRADING SIGNALS / SETUPS THAT MAY FORM AT Or FROM THAT KEY DAILY TIME FRAME CHART MARKET LEVEL OF SUPPORT✬✬✬✬✬
✬✬✬✬✬AS THE WEEK PROGRESSES THE MARKET IS SUBJECTED TO CHANGE THROUGH PRICE ACTION MARKET MOVEMENTS...SO BE ON THE LOOKOUT AND STAY ALERT✬✬✬✬✬
✬✬✬✬✬As For That Bullish Pin Bar PRICE ACTION MARKET TRADING SIGNAL... I Will Wait To See What Price Does. I Am A Little Skeptical About Entering Into The Market And Taking A Long Position... Considering The Placement Of That Bullish Pin Bar... I Will Sit On My Hands And Wait For Another Confirmation / Factor Of Confluence Before Entering Into The Market✬✬✬✬✬
✬✬✬✬✬✬✬✬✬✬✬✬✬✬✬✬✬✬✬✬✬✬✬✬✬✬✬✬✬✬✬✬✬✬✬✬✬✬✬✬✬✬✬✬✬✬✬✬✬✬✬✬✬✬✬✬✬✬✬✬✬✬✬✬✬✬✬✬✬✬✬✬✬✬✬✬✬✬✬✬✬✬✬✬✬✬✬✬✬✬✬✬✬✬✬✬✬✬✬✬✬✬✬✬
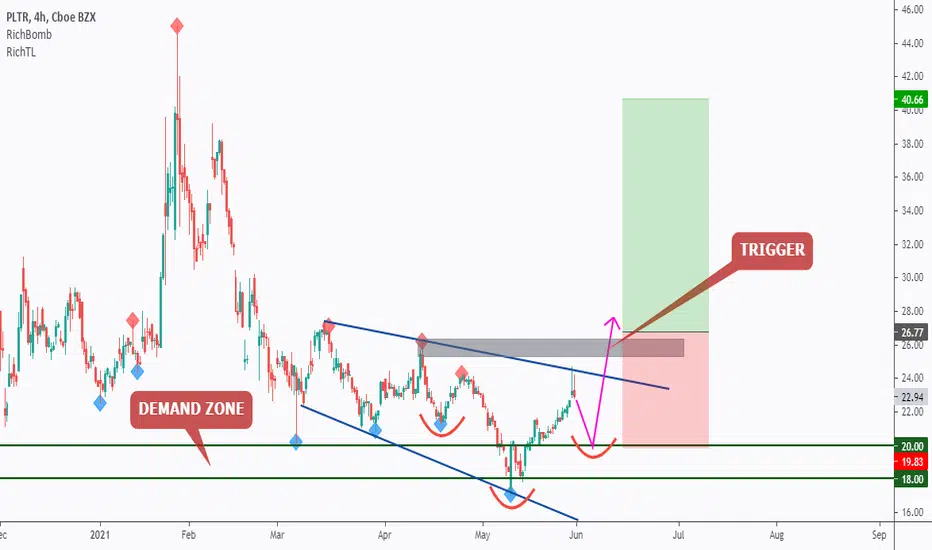
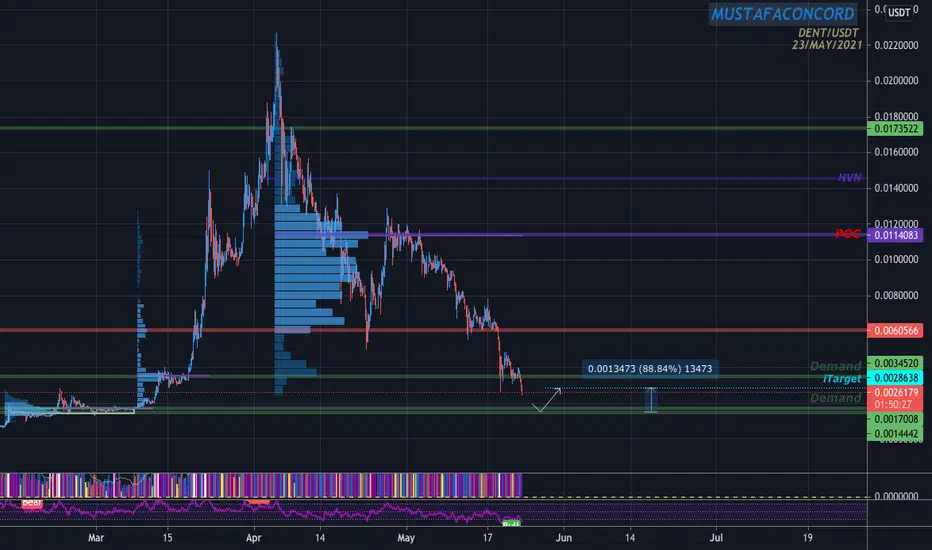
PALANTIR - Buy Setup Forming!PALANTIR is overall bearish, trading below our blue trendline but since it is approaching a strong demand zone in green we will be looking for buy setups to catch the next impulse.
Before we buy, we want the buyers to prove that they are taking over again.
You don't want to buy a bearish market right?
Our blue trendline is not valid yet, so we are waiting for a new swing high to form around it to consider it our trigger swing. (projection in purple)
We also have an inverse head and shoulders pattern forming (in red) adding more strength to our buy setup.
Trigger => Waiting for that swing to form and then buy after a momentum candle close above it (gray zone)
Meanwhile, until the buy is activated, PALANTIR would be overall bearish and can still test the green demand or break it downward.
Always follow your trading plan regarding entry, risk management, and trade management.
Good luck!
All Strategies Are Good; If Managed Properly!
~Rich
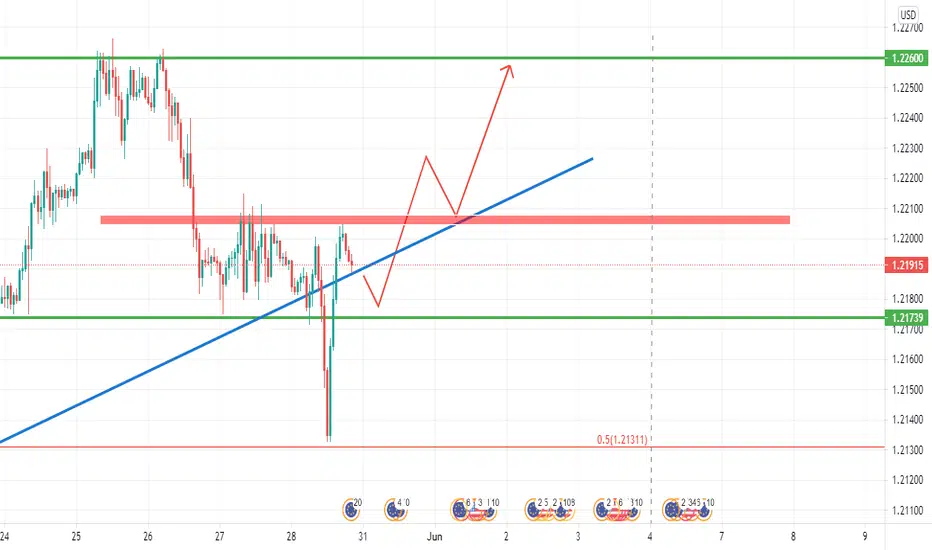
Eur/Usd Long idea hello to dear traders
we have eurusd chart here and I think long position can be a wise decision!
WHY?
1-Beacuse we had a 50 percent pullback ( the red line ( you can see 50 right of it ))
2-Beacuse we have a fail breakout and the price is back to the bullish channel
TARGETS
1___1.22050-1.22080
2___1.226
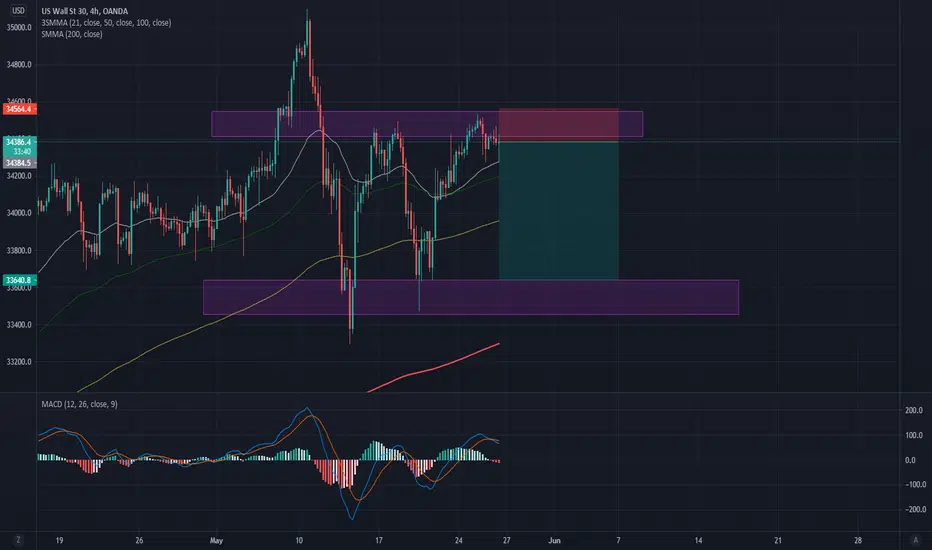
US30this is my first analysis about us30 let me know what you think
the strategy im using is supply and demend with the macd waiting for a crossover
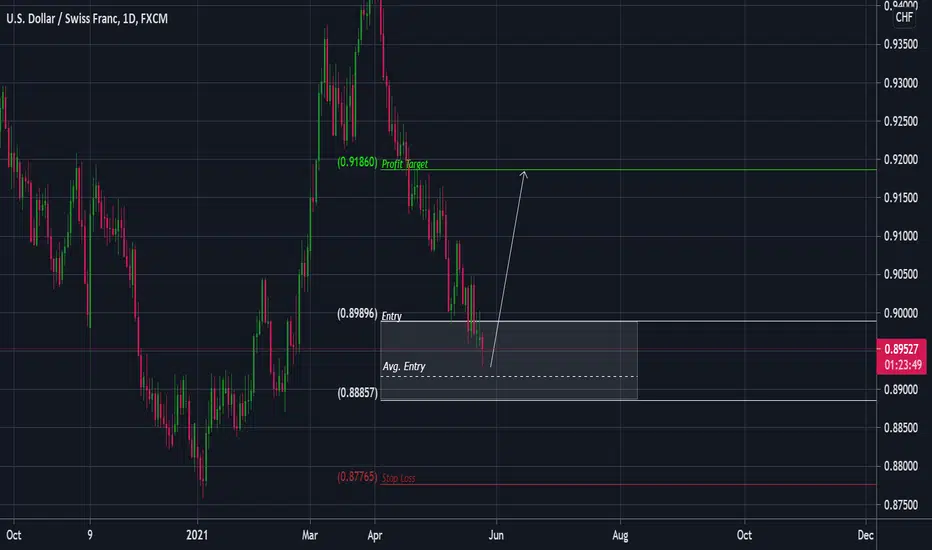
USDCHF | LONG-Values-
Entry Range: 0.89896 - 0.88857
Average Entry: 0.89164 (RRR: 1.91)
Stop Loss: 0.87765
Profit Target: 0.91860
-HOW TO ENTER MY TRADES-
1. Ladder your entries.
You'll want to ladder place your orders exponentially within the Entry Range to the point your RRR is atleast 1.5 if fully filled.
2. Only first touches are valid.
If price is rebounding back into the entry zone after either the profit target or stop loss was hit the entry zone is no longer valid.
Example:
Trade Idea:
Valid and Invalid Entry:
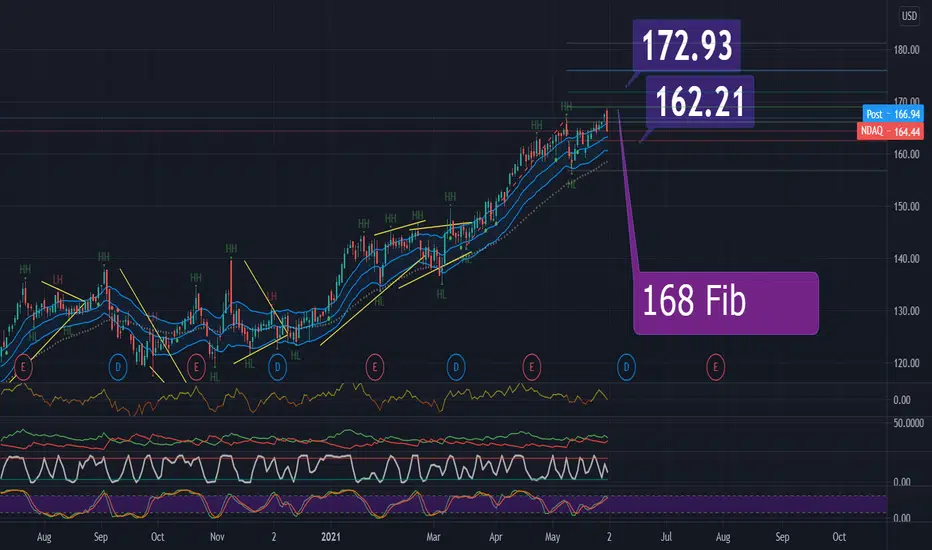
NASQAQ composite; trump's ending vs Biden's starting Greetings! It shows it all in the chart! Trump vs Biden! Than they say Trump was a great businessman, HAH! Just saying! I really do not support anyone though!

BUYERS REJECTION SETUP with bearish market the only way we have scalp with the expected rejection levels
by money management , keep an eye on breakeven
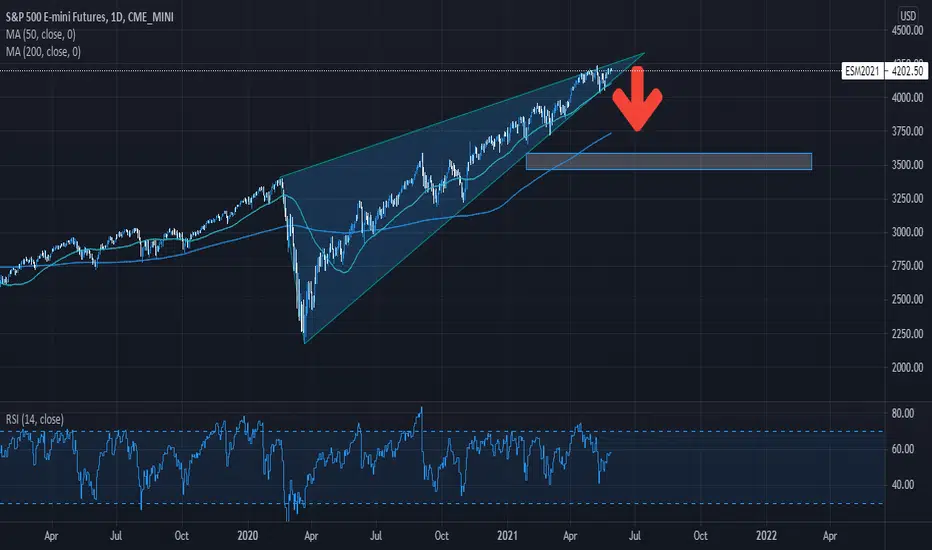
SP500 Crash will ContinueMy historical analogue is predicting a small move higher to 4250 before crashing all the way down to 3920.
This drop is a 7/8% move so something significant is going to happen. The previous drop I predicted turned out to be a "cyber attack" and price dropped 5% so who knows what it could be this time.
I will be shorting the reversal and the subsequent bounces all the way down to tp.

oil idea for this month we might see this path for oil the next weeks.
just an idea don't trade using my opinions im not a pro.

IZEA is it time for izea to go up once again?
as u can see, for the past 3 years the MA 50 in weekly chart worked as a support ALWAYS.
just put SL close below it, and you'll be fine
consider tho, that we have MA 200 close too (but lower ofc)
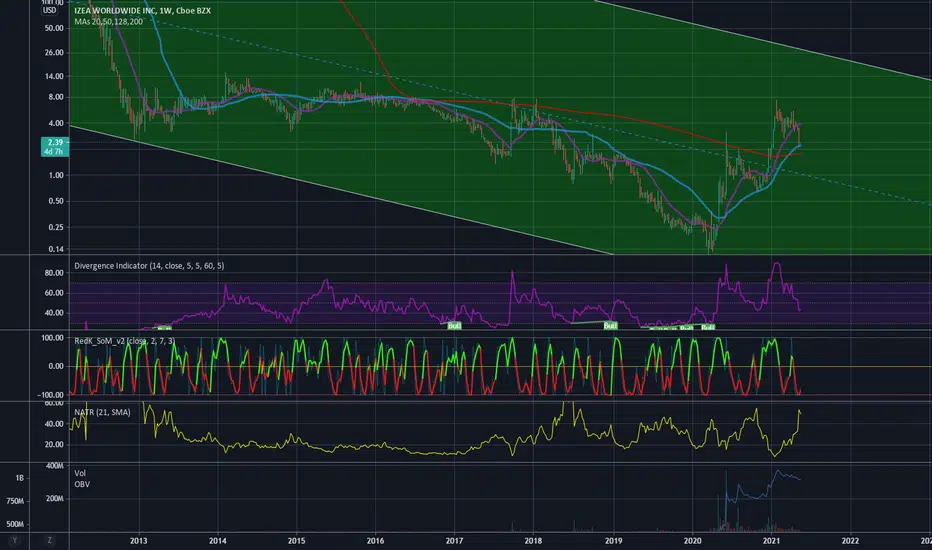
FRSX & IZEAIMO those 2 charts are pretty similar.
IF MA 50 weekly DOES NOT hold, we will also leave behind the channel.
so, if it does goes lower below green channel, I would suggest to stay OUT OF THIS.
otherwise, we MIGHT be buying the dip.
have fun and risk only what u can lose
PLS ALWAYS USE STOP LOSS.

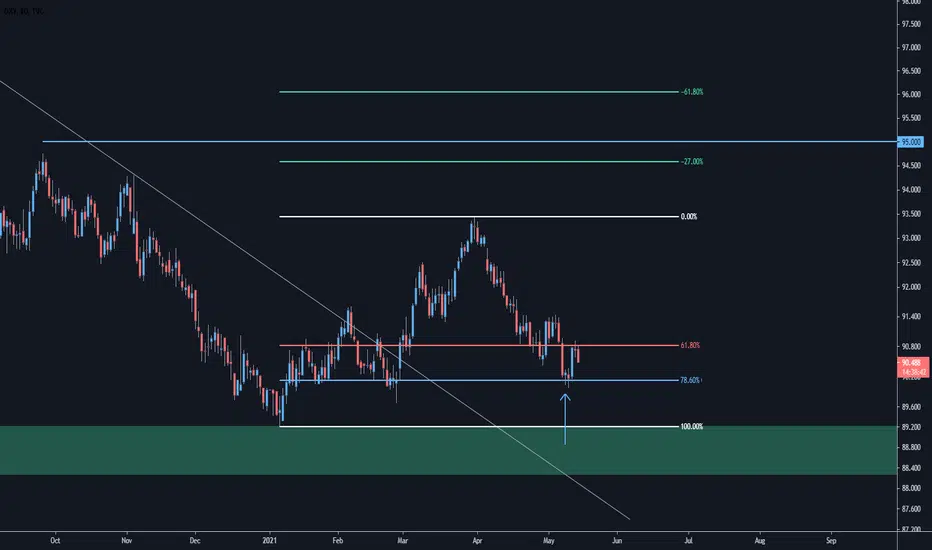
DXY - DailyZooming in further with the help of a fibonacci, we should see this continue up towards the 95.00 region should these retracements hold.
Originally meant to post when we were at the 78.6%, oops
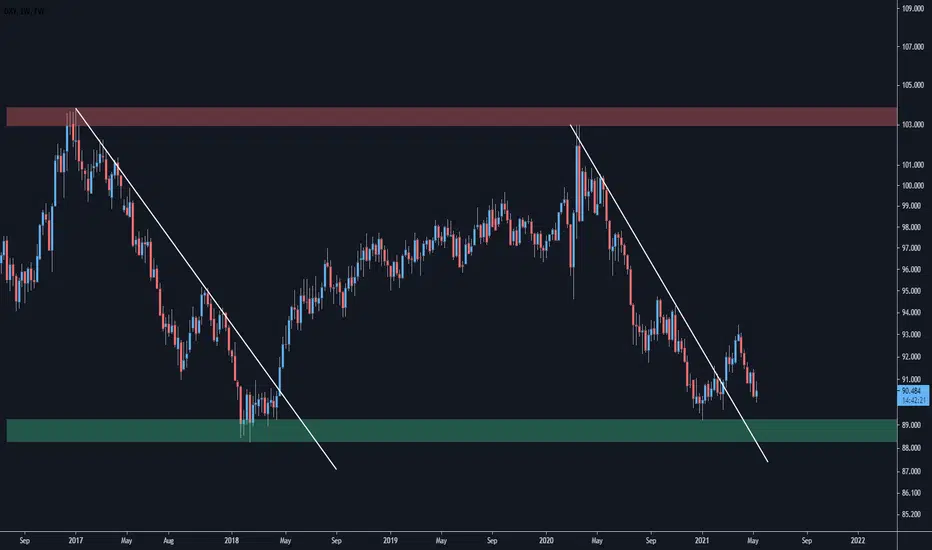
DXY - WeeklyFollowing the Monthly chart posted previously, which was abit dodgy...
Broken a downwards trendline and like previously with this pair I would expect this to be the start of a bullish trend.
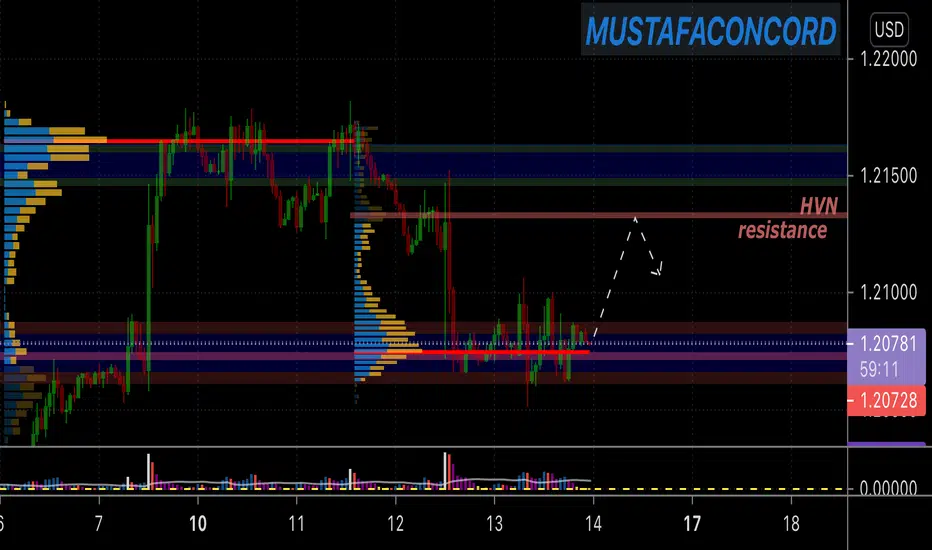
accumulating & rejection setup We expecting this sideway is accumulating to back to the strong sellers area then rejection as shown on the chart
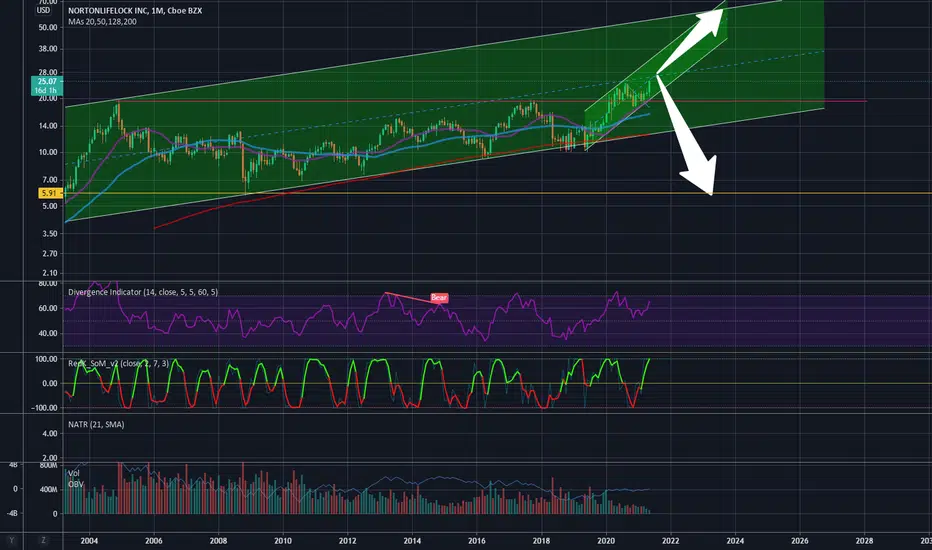
NLOKwe have scenario one, where the price hold and goes up, following the new little green channel.
in order to happen, this cybersecurity company has to receive something from the US government. which may happen, as cybersecurity is trending right now.
or
we have scenario two, where the price goes up a bit more, and eventually drops down, and after (if) losing the MA200 (IN THE MONTHLY CHART... HUGE), goes down maybe till 5 bucks.
if this has to happen, they should lose some funds or contracts from the government, which will have to go to one of their competitors.
PLS: use STOP LOSS. can save you a LOOOT of pain and from being stuck in something you don't like for a long time.
+ trade with what you can afford to lose.
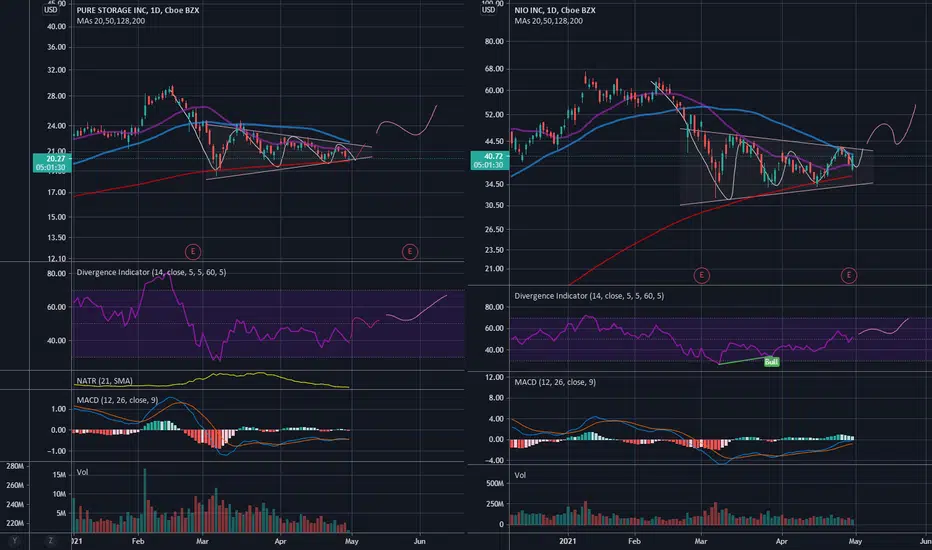
comparison between PSTG (pure storage) and NIO (nio).on the right we have nio, trying today to break over the MA 50 dynamic resistance, and on the left we have pure storage, trying to bounce off the MA 200.
as you can see, both of them bounced off the MA 200, but while nio did jump high today, pure storage didn't yet.
because of that, I believe we will see a jump within 2 weeks in pure storage too, not a big %, but yet not a trash can.
anyway, rejecting the MA 200 4 times is an amazing thing, and if the price can start to climb again, we may see it reaching a new high in both nio and pstg.
lastly, I would suggest you to check nio and compare it to pstg whenever it is possible, as long as the correlation between the 2 remains.
logarithmic chart
basic chart
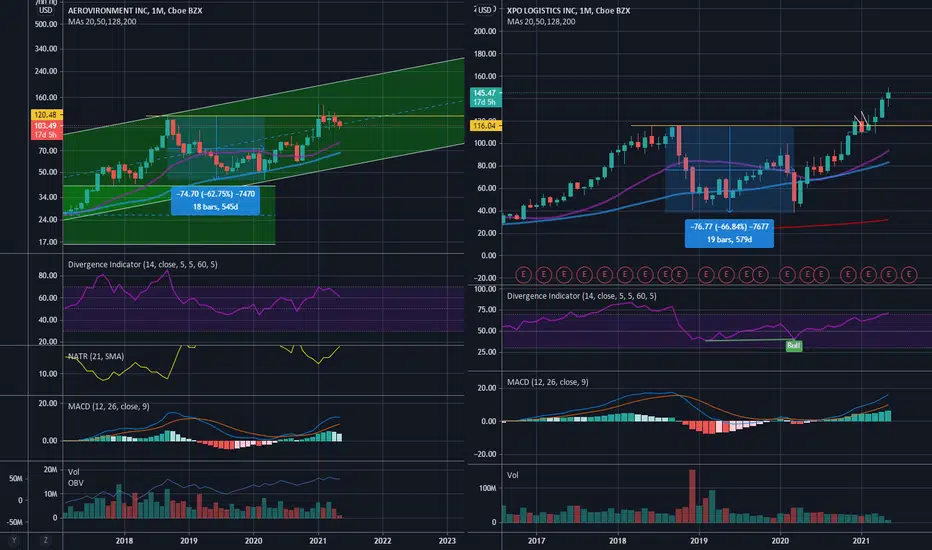
AVAV vs XPO2 different sectors, tho looking similar...
if AVAV breaks out as XPO did, might consider buying it.
US Dollar index (DXY) close to a key Support Zone (1)The US Dollar Index (DXY) is close to a key support zone (1).
-Maybe we will see a strong reaction there, not very probable though
-However, if the US Dollar loses this important support zone (1) things will turn very bad, and very fast
RSI Precision looks also similar to January 2008 and October 2017.
G. Protonotarios