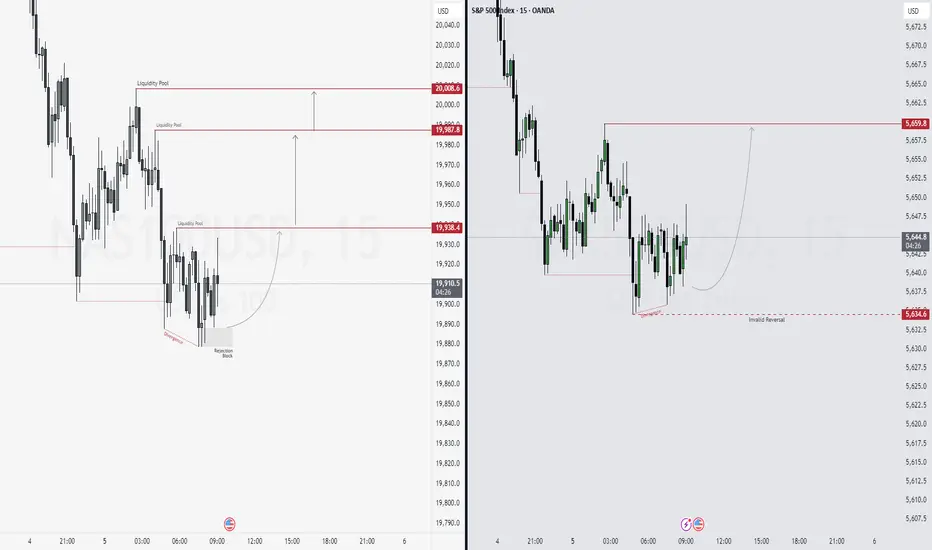
BTC – Liquidity Sweep, Fair Value Gap Reactions & Potential LongMarket context and structure
This BTCUSDT 1-hour chart from BYBIT illustrates a methodical transition from a phase of consolidation to bullish expansion, guided by smart money principles. Price initially consolidates beneath a well-defined resistance level, with an Imbalance Fair Value Gap (IFVG) forming inside the range. This IFVG signals an inefficient zone where institutional players may be positioned. The eventual breakout above this range indicates a structural shift and the beginning of a directional move, setting the stage for further bullish development.
Break of structure and liquidity sweep
Following the breakout, BTC sweeps the buy-side liquidity resting above a prior swing high. This liquidity grab is a common maneuver in smart money trading, designed to trigger stop orders and breakout entries to facilitate larger institutional fills. The aggressive price movement results in the creation of several Fair Value Gaps (FVGs), which are regions where price moved with such momentum that no overlap between candles occurred. These FVGs are crucial areas of interest where future re-entries or continuations might originate.
Fair value gaps and demand zones
The chart highlights multiple FVGs formed during the bullish impulse. The uppermost FVG, located just below the most recent liquidity sweep, acts as a shallow retracement zone and has already been partially mitigated. A mid-range FVG extends further down, providing a secondary support layer within the current price structure. The largest and deepest FVG lies closer to the breakout origin and represents a significant unfilled demand zone. These FVGs help to outline institutional footprints, revealing where unfulfilled orders may still reside and where price might return to rebalance.
Re-entry strategy and projection
An ideal re-entry area is labeled “Entry at IFVG,” situated near the recently swept liquidity. The projection suggests that price may retrace slightly into this IFVG, consolidate, and then continue its upward trajectory. This anticipated movement reflects a bullish continuation pattern rooted in the idea of reaccumulation, where price revisits areas of imbalance before pushing higher. The visual path drawn on the chart captures this idea, showing a measured retracement followed by a continuation of the trend.
Interpretation and tactical bias
The overall structure and price behavior support a smart money-based bullish outlook. The clean break of structure, the successful sweep of liquidity, and the presence of multiple fair value gaps provide a foundation for continued upside potential. Price respecting these imbalance zones on pullbacks reinforces demand and highlights ongoing institutional involvement. This setup encourages a patient, context-aware approach to trading, focusing on inefficiencies, order flow, and the narrative of price rather than arbitrary indicators.
Us100

NAS100USD: Volatility Opens Door for Sell Setup in NY SessionGreetings Traders,
As we enter the New York session—a period known for heightened volatility—we note that NAS100USD remains in a broader bullish environment. However, current price action suggests the potential for a short-term reversal, prompting us to explore selling opportunities.
Key Observations:
1. Bearish Internal Structure Developing:
Despite the overall bullish trend, internal price action reveals a sequence of lower lows, indicating the formation of a bearish microstructure. This internal weakness is reflected in the way bearish arrays—such as mitigation blocks and fair value gaps (FVGs)—continue to act as resistance zones.
2. Mitigation Block & FVG Alignment:
Recently, price delivered a strong displacement to the downside, followed by a retracement into a mitigation block that aligns with a fair value gap. This confluence reinforces the bearish bias and suggests institutional selling may be active in this zone.
3. Downside Targets – Gap Fill & Liquidity Pools:
The first downside target is a nearby inefficiency (gap) in price action, which the market often seeks to fill. The second target lies below, where sell-side liquidity pools are likely resting.
Trading Plan:
Monitor price behavior within the current resistance zone. If confirmation of continued bearish momentum appears, short positions targeting the aforementioned levels may be viable.
Stay focused and wait for confirmation before committing to any positions.
Kind Regards,
The Architect
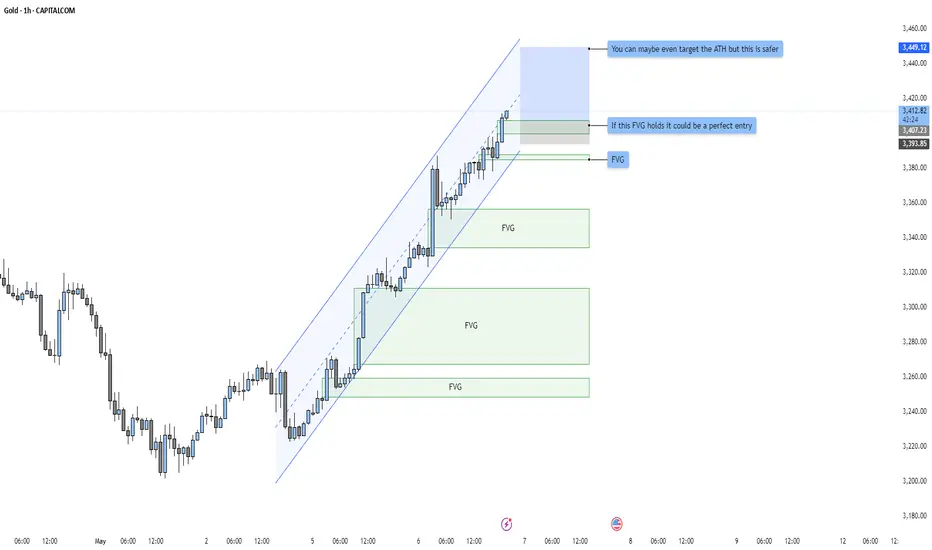
GOLD - Bullish Structure with Potential Continuation PlayThe current 1-hour chart of Gold (XAU/USD) demonstrates a clean bullish structure supported by an ascending channel and multiple unmitigated Fair Value Gaps (FVGs) acting as potential demand zones. This setup highlights the strength of the ongoing uptrend and offers insights into a high-probability continuation entry should price retrace.
Market Context and Trend Structure:
Following a prolonged downtrend visible in the earlier part of the chart, Gold reversed decisively with a bullish break of structure. Since then, price has been consistently printing higher highs and higher lows while respecting an ascending parallel channel. This channel, marked by two trendlines, encapsulates the short-term bullish momentum.
The current move is strong and impulsive, suggesting that institutional order flow is behind this leg. Candles are elongated with minimal wicks on the upside, reinforcing the idea of aggressive buying pressure.
Key Demand Zones and FVG Analysis:
Three major Fair Value Gaps (FVGs) have formed along the recent bullish leg, each potentially acting as a zone of reaccumulation. These FVGs are marked in green and correspond to areas where price left inefficiency after strong upward moves without immediate retracements.
* The most recent FVG, located just beneath current price, aligns with a minor structure support zone and overlaps partially with the lower boundary of the ascending channel. This area stands out as a prime candidate for a bullish continuation entry, particularly if price retraces and shows signs of holding.
* The middle FVG, slightly lower in the structure, represents a deeper mitigation level and could serve as a secondary entry in case the initial zone fails to hold.
* The lowest FVG is a broader inefficiency zone that formed near the base of the bullish reversal. If price returns this far, it would likely signify a temporary shift in momentum or deeper liquidity hunt before another leg upward.
Channel Structure and Momentum:
The ascending channel has been respected throughout the rally, offering visual confirmation of trend strength and the rhythm of pullbacks. The current price is near the upper boundary of the channel, and a short-term retracement is a logical expectation before continuation.
A pullback into the FVG + lower channel region would represent a convergence of structure, imbalance, and trendline support. These overlapping technical elements enhance the probability of a bounce from this zone.
Projected Path:
The chart also suggests a conservative bullish continuation projection, aiming toward the zone marked around 3449.12. This level appears to be a measured move extension and a safer target in relation to the overall structure. However, the note on the chart implies that the all-time high (ATH) could also be in play if momentum continues and market conditions remain supportive.
The key here is the behavior around the nearest FVG. If price retraces and holds this area—potentially forming a bullish engulfing or confirmation on lower timeframes—it may offer an ideal continuation entry with minimal drawdown.
Conclusion:
This Gold 1-hour chart reflects a strong bullish structure with clear institutional footprints left in the form of unmitigated FVGs. The alignment of ascending channel support and bullish imbalances creates a favorable setup for continuation traders. Watching the immediate FVG zone will be critical, as it may define the next impulsive leg toward higher targets. If that zone fails, deeper FVGs below offer secondary opportunities while maintaining the bullish bias as long as structural higher lows remain intact.
NASDAQ: Rebounding on the 4H MA50. New High for the Channel Up.Nasdaq is marginally bullish on its 1D technical outlook (RSI = 56.883, MACD = 127.320, ADX = 37.197) and is rebounding today on the 4H MA50, right before the HL of the Channel Up. This is a technical bottom that calls for a buy. We aim for a new +6% bullish wave (TP = 20,800).
## If you like our free content follow our profile to get more daily ideas. ##
## Comments and likes are greatly appreciated. ##

US100There’s a **Sell opportunity** forming on **US100**, but this one carries a bit more risk compared to the others.
That’s why I recommend opening the trade with a **smaller lot size** just for this setup.
🔍 **Criteria:**
✔️ Timeframe: 15M
✔️ Risk-to-Reward Ratio: 1:2
✔️ Trade Direction: Sell
✔️ Entry Price: 20021.8
✔️ Take Profit: 19945.8
✔️ Stop Loss: 20059.6
🔔 **Disclaimer:** This is not financial advice. It's a trade I’m taking based on my own system, shared purely for educational purposes.
📌 If you're also interested in systematic and data-driven trading strategies:
💡 Don’t forget to follow the page and subscribe to stay updated on future analyses.

US100 WILL GO DOWN|SHORT|
✅US100 price grew again to retest the resistance of 20,300
But it is a strong key level
And we are already seeing
A local bearish pullback
So I think that there is a high chance
That we will see a bearish move down
SHORT🔥
✅Like and subscribe to never miss a new idea!✅
Disclosure: I am part of Trade Nation's Influencer program and receive a monthly fee for using their TradingView charts in my analysis.
NAS100USD: SMT Divergence Hints at Potential ReversalGreetings Traders,
In today’s analysis of NAS100USD, although the current market structure reflects bearish institutional order flow, there are growing signs that a potential reversal may be forming.
Key Observations:
1. Smart Money Technique (SMT) Divergence:
We are currently observing SMT divergence—a strategy where the underlying asset (NAS100) is compared against its benchmark (US500). These indices typically maintain a 90–100% correlation. However, when this correlation breaks down, it often signals that a reversal may be imminent. In this case, while NAS100 continues to show bearish momentum, the divergence from US500 suggests the possibility of bullish interest building.
2. Institutional Support at the Rejection Block:
Further confluence for a potential reversal lies in the presence of a rejection block acting as a strong institutional support level. This is a zone where smart money previously defended price, and if confirmed, it could provide an optimal entry for long positions.
Trading Plan:
We will monitor the rejection block for confirmation of bullish intent before entering any trades. If confirmed, the idea is to target the buy-side liquidity residing in premium pricing zones.
Invalidation Level : This reversal idea will be invalidated if NAS500 breaks below its most recent swing low.
Stay alert for confirmation, and always ensure the idea fits within your broader trading framework.
Kind regards,
The Architect
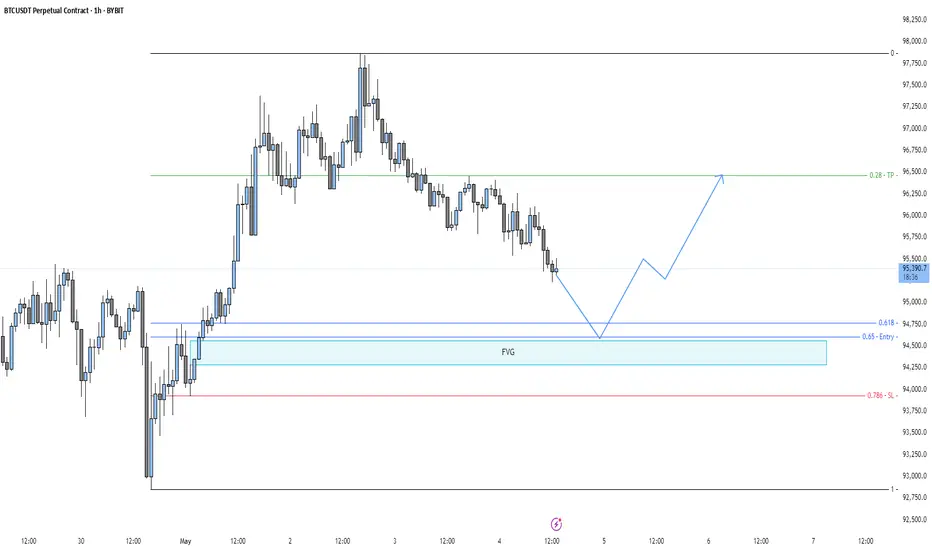
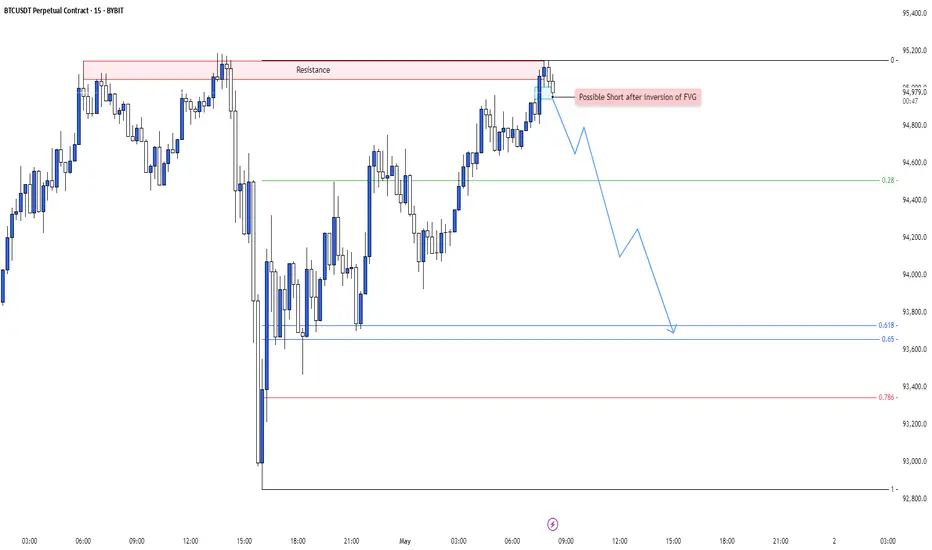
BTCUSDT - Potential Long Setup Developing from FVG and Fib levelOverview:
Bitcoin (BTCUSDT) on the 1H timeframe is currently exhibiting a controlled retracement following a local top. This structure presents a potential opportunity for a long setup based on confluence between an FVG (Fair Value Gap) and key Fibonacci retracement levels. The chart highlights a likely scenario where price may continue to correct lower into a defined area of interest before resuming bullish momentum.
Market Context:
After a strong impulsive move upward, BTC appears to be in a corrective phase. The recent price action has formed a series of lower highs and lower lows, which is characteristic of a short-term downtrend within a broader uptrend context. This kind of pullback behavior is often necessary for healthy continuation to the upside and can offer high-probability entries for trend continuation traders.
Fair Value Gap (FVG):
A notable fair value gap has been identified in the 94,250–94,700 zone. This zone represents an inefficiency in the market where price rapidly moved without significant opposition, leaving behind a gap between wicks of adjacent candles. Price often returns to such areas to rebalance order flow before making its next decisive move.
Fibonacci Confluence:
The chart includes key Fibonacci retracement levels drawn from the recent swing low to swing high.
* The 0.618 Fibonacci retracement level lies just above the FVG, providing strong technical confluence.
* The 0.65 level is marked as the ideal entry zone and sits within the FVG, further validating it as a high-probability support region.
* The 0.786 level is also marked, and although deeper, it represents the final line of defense for this bullish scenario.
Anticipated Price Action:
A bullish projection is illustrated on the chart where price is expected to:
1. Continue declining toward the 0.65–0.618 Fibonacci confluence zone.
2. Wick into the FVG and reject from that level.
3. Form a short-term higher low structure and push back to reclaim prior structure highs.
4. Confirm bullish structure continuation with an impulsive breakout from the descending channel.
Market Structure and Liquidity Outlook:
The broader structure remains bullish on higher timeframes. The retracement into the FVG would serve the dual purpose of:
* Grabbing liquidity below recent lows.
* Mitigating unfilled buy-side inefficiency.
Such a development would suggest that institutional participants are filling long orders in the discounted price region, setting the stage for a potential continuation of the broader bullish trend.
Key Technical Zones:
* FVG Zone: 94,250 – 94,700
* Fibonacci Confluence: 0.618–0.65 retracement levels
* Liquidity Pool: Below current swing lows leading into the FVG
Conclusion:
BTCUSDT is approaching a critical decision zone. A move into the FVG combined with Fibonacci retracement confluence presents an attractive area for potential long entries. Confirmation of bullish reversal structure within this zone could offer a strong trade opportunity in alignment with the broader trend. Patience and precision will be key in waiting for the price to tap into this area and show intent to reverse.
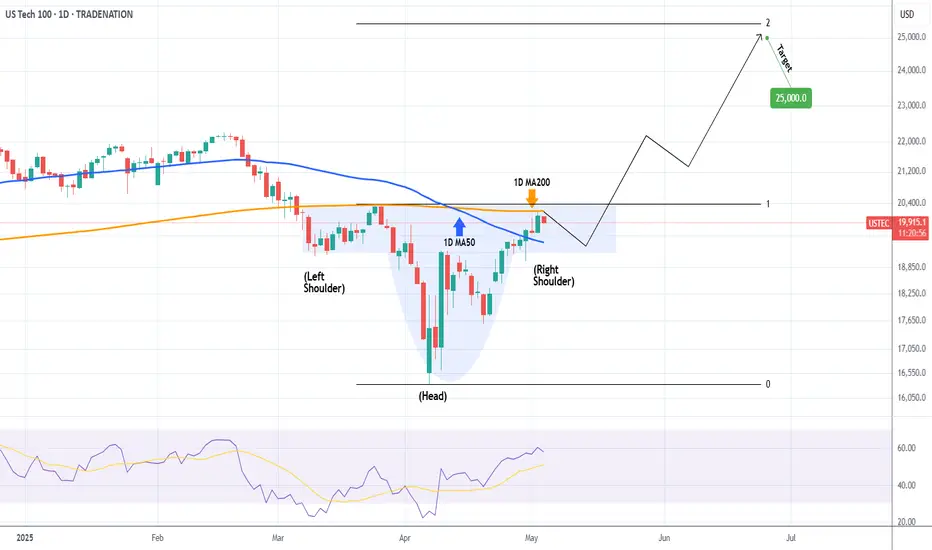
NASDAQ's Inverse H&S that targets $25000Nasdaq (NDX) is forming the Right Shoulder of a potential Inverse Head and Shoulders (IH&S) pattern. The price action is 'stuck' within the 1D MA200 (orange trend-line), which got tested on Friday for the first time since March, and the 1D MA50 (blue trend-line).
Since the 1D MA200 was the level that initiated the March 26 rejection, it is possible to see a short-term pull-back now, all in the process of forming the Right Shoulder and after the market digests the new Fed Rate Decision, starts the next Leg Up. Note that the 1D RSI is already on its February highs.
As a result, our long-term Target is at 25000, just below the 2.0 Fibonacci extension level, which is a standard technical target for IH&S patterns.
-------------------------------------------------------------------------------
** Please LIKE 👍, FOLLOW ✅, SHARE 🙌 and COMMENT ✍ if you enjoy this idea! Also share your ideas and charts in the comments section below! This is best way to keep it relevant, support us, keep the content here free and allow the idea to reach as many people as possible. **
-------------------------------------------------------------------------------
Disclosure: I am part of Trade Nation's Influencer program and receive a monthly fee for using their TradingView charts in my analysis.
💸💸💸💸💸💸
👇 👇 👇 👇 👇 👇
NAS100 - Stock Market, Waiting for FOMC?!The index is above the EMA200 and EMA50 on the 4-hour timeframe and is trading in its ascending channel. I expect corrective moves from the specified range, but if the index continues to move upwards towards 21,000 points, we can look for the next Nasdaq short positions with a risk-reward ratio.
Last week, U.S. equity markets experienced $8.9 billion in capital outflows, while equity markets in Japan and the European Union saw net inflows. Additionally, U.S. Treasury bonds recorded an outflow of $4.5 billion—the largest since December 2023. Meanwhile, the gold market witnessed its first weekly investment decline since January.
Looking ahead, financial markets are focused on the upcoming earnings reports from major companies across sectors such as technology, healthcare, automotive, energy, and financial services. These reports are expected to significantly influence equity trends, investment strategies, and corporate outlooks. Below is a daily breakdown of key companies set to release earnings this week:
Monday, May 5, 2025
The week starts with a focus on the healthcare and biotech sectors:
• Before market open: Companies such as Palantir, Ford, Onsemi, and Tyson Foods will report earnings. Palantir and Ford are particularly noteworthy for investors in the tech and auto sectors.
• After market close: Healthcare firms like Hims & Hers Health, Axsome Therapeutics, and financial company CNA Financial will report.
Tuesday, May 6, 2025
Tuesday highlights several key tech earnings:
• Before market open: Celsius, Datadog, Rivian, and Tempus will publish their results. Rivian’s report is especially anticipated due to the intense competition in the electric vehicle space.
• After market close: Tech giants like AMD and Arista Networks will release earnings, along with Marriott from the hospitality sector.
Wednesday, May 7, 2025
A packed day for earnings reports:
• Before market open: Reports from Uber and Teva are expected, along with ARM Holdings, a key player in semiconductors.
• After market close: AppLovin, Unity, and Robinhood will release their reports—representing digital gaming, software, and fintech respectively.
Thursday, May 8, 2025
This day centers on digital health, cryptocurrency, and e-commerce:
• Before market open: Peloton and Shopify will report. Shopify’s performance is particularly critical in the online retail sector.
• After market close: Crypto firm Coinbase and online sports betting platform DraftKings are in focus.
Friday, May 9, 2025
Fewer companies will report, but some are of strategic interest:
• Firms like 1stdibs, Ani Pharmaceuticals, and Embecta are scheduled, as well as Telos and Algonquin—key names in energy and cybersecurity investing.
This week, markets are closely monitoring Wednesday’s FOMC meeting. At the March session, the Fed left rates unchanged and signaled only two potential cuts totaling 50 basis points for the year, based on its dot plot—suggesting a cautious approach to monetary easing.
Simultaneously, April’s U.S. Services PMI is set to be released today, providing clearer insights into post-tariff business activity.
Amazon’s CEO stated that, so far, there is no indication of reduced demand due to tariff concerns. Some inventory spikes were noted in specific categories, likely driven by stockpiling ahead of tariff implementation. Retail prices, on average, have not significantly increased, and most sellers have yet to raise prices—though that could change depending on how tariff policies evolve. Notably, essential goods have grown at twice the rate of other categories and now account for a third of all unit sales in the U.S.
Following April’s jobs report, the likelihood of a Fed rate cut in June dropped from 75% to 42%. With only one more employment report due before the June 18 meeting, hopes for an early policy shift have faded. Some analysts argue that without the tariff conflict, the Fed might already be cutting rates, given the downward trend in inflation, steady growth, and Congressional focus on fiscal measures.
The April jobs data showed that the U.S. labor market remains resilient—neither too strong to spark inflation fears nor too weak to trigger panic. After the release, with market confidence rebounding, Goldman Sachs forecasted the Fed’s first rate cut to come at the July 30 meeting.
The consensus expectation is for the Fed funds rate to remain in the current 4.25%-4.5% range, unchanged since January. The CME FedWatch tool currently assigns just a 1.8% chance of a rate cut at the upcoming meeting.
Economists warn that Trump’s newly imposed tariffs—active since April—could drive up prices and hurt employment, challenging the Fed’s dual mandate of controlling both inflation and joblessness. However, recent data shows inflation remained mild in March and the labor market held steady in April.
Nancy Vanden Houten, Chief U.S. Economist at Oxford Economics, wrote: “The data is strong enough for the Fed to stay on the sidelines and monitor how tariffs influence inflation and expectations.” While hard data remains stable, forecasts and sentiment surveys signal looming challenges. Business leaders and individuals express concern that rising costs may burden consumers and businesses in the coming months or years, possibly even tipping the economy into recession.
NAS100USD: Bearish Setup Builds as Price Retests Key Supply ZoneGreetings Traders,
In today’s analysis on NAS100USD, we continue to observe bearish institutional order flow, and as such, our objective is to align our trading opportunities with this directional bias.
Key Observations:
1. Bearish Break of Structure and Retracement:
Following a clear bearish break of structure, price has retraced into a mitigation block. This zone represents an area where institutional buying previously occurred. As price trades back into it, institutions often mitigate those earlier positions and reintroduce sell-side interest—offering us an opportunity to follow their lead.
2. Confluence at the Mitigation Block:
The mitigation block is further reinforced by the presence of a bearish order block, adding strength to the resistance zone. This alignment suggests the area may serve as a high-probability reversal point for bearish continuation.
Liquidity Sweep Scenario:
There remains a possibility that price may take out nearby buy-side liquidity (buy stops) before continuing downward. If this occurs, we will wait for confirmation before entering short positions, maintaining alignment with the overall bearish narrative.
Trading Plan:
Upon confirmation of rejection at the mitigation zone, we will seek to engage in short setups targeting liquidity pools in discount pricing zones.
Remain patient, disciplined, and ensure each trade aligns with your strategy.
Kind Regards,
The Architect

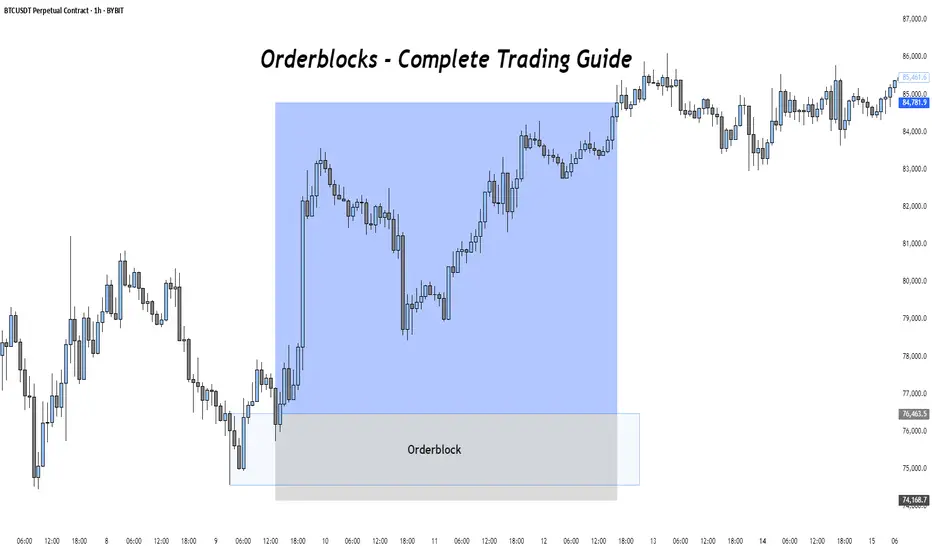
Mastering Order Blocks: How to Trade Like Smart MoneyIntroduction
Order Blocks (OBs) are one of the most critical concepts in Smart Money trading. They represent areas where institutional traders have entered the market with significant volume, typically leading to strong price movements. Identifying and trading Order Blocks gives traders an edge by aligning with the footprints of Smart Money.
What is an Order Block?
An Order Block is the last bearish candle before a bullish move for bullish OBs, or the last bullish candle before a bearish move for bearish OBs. These candles represent areas where institutions accumulated or distributed large positions, leading to a market shift.
Types of Order Blocks
A Bullish Order Block appears at the end of a downtrend or during a retracement just before the price moves sharply upward. It is typically represented by the last bearish candle prior to an impulsive bullish move. Price will often return to this level to mitigate institutional orders before continuing upward.
A Bearish Order Block, in contrast, forms at the end of an uptrend or retracement where price begins a downward reversal. It is characterized by the last bullish candle before a strong bearish move. Price tends to revisit this level to mitigate before continuing lower.
How to Identify a Valid Order Block
The key to identifying a valid Order Block is first observing a strong impulsive move, also known as displacement, that follows the OB candle. The move must also result in a break of market structure or a significant shift in direction. Order Blocks that produce Fair Value Gaps (FVGs) or Market Structure Shifts (MSS) tend to be more reliable. Another important sign is when price returns to the OB for mitigation, offering a potential entry.
Entry Model Using Order Blocks
After locating a valid OB, the next step is to wait for price to return to this area. The ideal entry happens within the OB body or near its 50% level. For extra confirmation, look for a Market Structure Shift or Break of Structure on a lower timeframe. Entries are more powerful when combined with additional elements like Fair Value Gaps, liquidity grabs, or SMT Divergences. The stop-loss should be placed just beyond the OB’s high or low, depending on the direction of the trade.
Refinement Techniques
To increase precision, higher timeframe OBs can be refined by zooming into lower timeframes like the 1M or 5M chart. Within a broad OB zone, identify internal market structure, displacement candles, or embedded FVGs to determine a more precise entry point. One effective refinement is the Optimal Trade Entry (OTE), which is often found at the 50% level of the Order Block.
Order Blocks vs. Supply and Demand Zones
While they may seem similar, Order Blocks are more narrowly defined and specifically related to institutional order flow. Supply and Demand zones are broader and typically drawn around areas of price reaction, but OBs are derived from the final institutional candle before a large move and are often confirmed by structure shifts or displacement. This makes OBs more precise and actionable in the context of Smart Money concepts.
Target Setting from Order Blocks
Targets after entering from an OB should align with liquidity objectives. Common targets include internal liquidity like equal highs or lows, or consolidation zones just beyond the OB. External liquidity targets such as previous major swing highs or lows are also ideal, especially when they align with imbalances or Fair Value Gaps. It's important to adjust targets based on the current market structure and trading session.
Common Mistakes to Avoid
A frequent mistake is treating any candle before a move as an OB without verifying key signals like displacement or a Break of Structure. Entering without other confirmations, such as an MSS or liquidity sweep, can lead to poor trades. Another common error is placing the stop-loss too tightly within the OB, instead of just beyond it, increasing the chance of premature stop-outs. Traders should also avoid executing OB trades during low-liquidity sessions where price action can be unpredictable and wicky.
Final Thoughts
Order Blocks are foundational to Smart Money trading. They allow you to enter where institutions have placed large positions and offer clear invalidation and entry logic. With practice, you can identify high-quality OBs and combine them with other concepts like FVGs, MSS, and SMT for powerful, precise trades.
Practice on different timeframes and assets, and always look for clean displacement and structure confirmation. Mastering OBs is a big step toward becoming a consistently profitable trader.
Trust the Blocks. Trade with Intention.
BTC - Golden Pocket & Strong FVG Resistance for a Short SetupThe current 15-minute chart of BTCUSDT reveals a textbook bearish setup forming as price retraces into a well-defined supply zone. This analysis focuses on structural breakdowns, liquidity engineering, and key Fibonacci confluences that may lead to a short-term reversal within intraday price action.
Overview of Market Structure:
BTCUSDT has been in a clear intraday downtrend with consistent lower highs and lower lows being formed. The recent price action reflects a temporary consolidation phase following the creation of a new swing low. This minor pullback appears to be corrective in nature, moving upward toward a previously established zone of inefficiency.
At the center of this setup is a well-marked bearish fair value gap (FVG), highlighted with a blue shaded rectangle, where institutional selling is expected to have previously occurred. This FVG formed after a strong displacement candle, suggesting unmitigated sell-side imbalance left in the market.
Retracement Zone and Fibonacci Confluence:
As price retraces upward, it enters the equilibrium region of the recent bearish impulse, with notable confluences around the 0.618 and 0.65 Fibonacci retracement levels. These retracement levels are critical markers where smart money algorithms often execute continuation plays during trending phases.
Both the 0.618 and 0.65 levels fall within the center of the FVG zone, further strengthening the case for this being a valid supply area. These levels are plotted with horizontal lines on the chart and serve as ideal zones to monitor for signs of rejection or bearish order flow resumption.
The 0.786 retracement, marked just above the upper boundary of the FVG, acts as a final extremity level. This level often coincides with liquidity pools where stop hunts are engineered before the actual move begins. Its proximity to a recent swing high makes it an area of interest for potential liquidity grabs prior to a deeper move down.
Projected Price Path and Liquidity Targets:
The projected blue path illustrates an expected liquidity sweep into the FVG zone, followed by a sharp rejection. This aligns with the idea of engineered liquidity collection before continuation in the original trend direction. The move anticipates price reaching back into the area of prior support, targeting unmitigated demand near recent lows.
Of particular interest is the area around the 0.28 Fibonacci extension level, which acts as a probable magnet for price in the event of a successful rejection. The chart structure suggests that once the short-term retracement completes, there is room for a new impulse leg lower.
Internal Structure Observation:
The current lower timeframe structure shows rising momentum toward the FVG. However, this upward push lacks aggressive bullish volume and appears corrective rather than impulsive. This suggests that buyers are likely exhausting themselves as price nears the supply zone.
Additionally, the structure within this move is developing lower-timeframe liquidity pools (equal highs and tight consolidation), which could act as inducement for a sweep before the potential reversal occurs.
Conclusion:
This chart offers a well-structured short setup based on supply zone rejection, Fibonacci confluence, and a bearish market structure. The fair value gap zone between the 0.618 and 0.65 retracement levels is key, and price action within this area will be crucial in determining the next directional leg. If bearish confirmation such as an engulfing pattern or break of market structure occurs within or after tapping this zone, it would validate the bearish outlook for a short-term continuation to the downside.
This setup is ideal for intraday traders focused on precision-based entries rooted in institutional order flow principles.

US100 BEST PLACE TO SELL FROM|SHORT
US100 SIGNAL
Trade Direction: short
Entry Level: 20,101.6
Target Level: 18,779.9
Stop Loss: 20,975.6
RISK PROFILE
Risk level: medium
Suggested risk: 1%
Timeframe: 12h
Disclosure: I am part of Trade Nation's Influencer program and receive a monthly fee for using their TradingView charts in my analysis.
✅LIKE AND COMMENT MY IDEAS✅

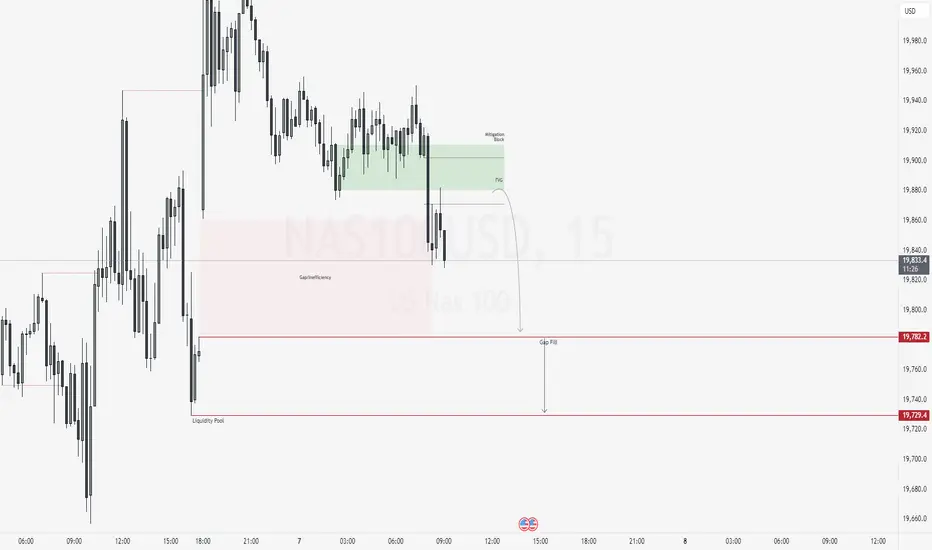
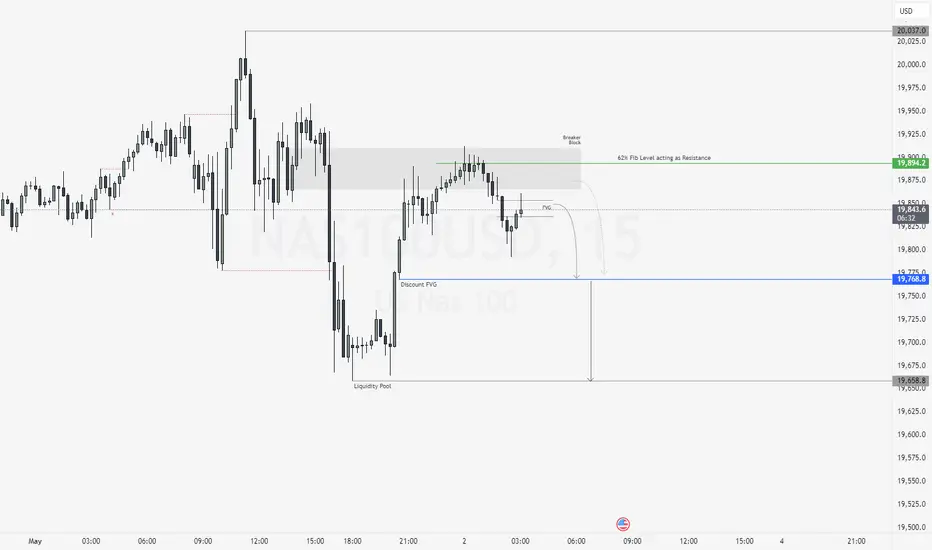
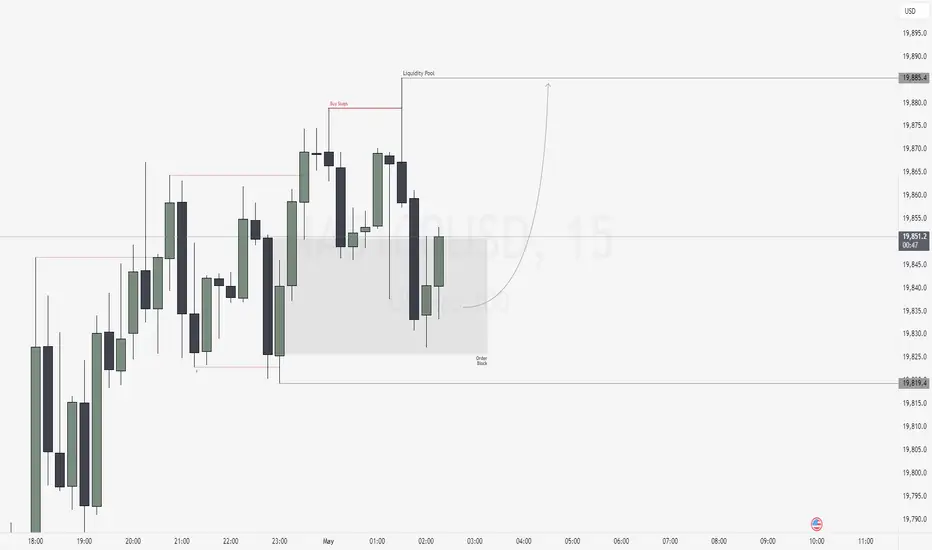
US100 - Perfect Long Opportunities Unfolding?This chart illustrates a high-probability bullish setup based on a combination of market structure shifts, fair value gaps (FVGs), Fibonacci retracement confluence, and order block interaction. We are analyzing the US Tech 100 on the 1-hour timeframe, focusing on recent price action development and a potential reversal scenario forming after a corrective move.
Context and Market Structure:
Price action has been in a corrective downtrend after printing a local high near the 19,950–20,000 range. This move led to a break in short-term bullish structure as sell-side liquidity was swept. A series of bearish candles followed, confirming a shift in momentum to the downside.
However, the retracement stalled upon entering a prior area of imbalance—highlighted here as a larger fair value gap (FVG) zone. This FVG zone acted as a significant demand area, with price reacting strongly upon entry. The zone is marked with a light blue shaded rectangle and aligns with a 1-hour bullish order block.
Price created a swing low in this FVG area before forming higher lows, suggesting the possibility of a short-term reversal.
Golden Pocket & Liquidity Sweep:
A key zone of interest is the "Golden Pocket downtrend" area, which is derived from the 0.618–0.65 Fibonacci retracement levels of the last impulse down. Price previously respected this zone, leading to a rejection and continuation lower. This makes it a notable supply area. Price may revisit this zone as a target or potential reaction point on the next bullish leg.
Note how the initial reaction from the FVG brought the market back into a smaller 1H FVG, situated just beneath the 0.5 retracement level. The internal structure within this zone supports a bullish outlook due to the formation of a higher low followed by a bullish engulfing candle.
Fibonacci Confluence & Execution Levels:
The 0.618 Fibonacci retracement level of the recent move aligns closely with the midpoint of the bullish FVG, providing confluence for a potential re-entry or continuation point. This level is annotated on the chart and highlighted with a horizontal line labeled "0.618 - Entry." This suggests it may act as a magnet for price before further continuation to the upside.
The 0.786 retracement level, also plotted on the chart, indicates the deeper end of the retracement spectrum and lies just above a major structural low. This region, though aggressive, would represent a final line of defense for bullish continuation.
Projection and Price Path:
Based on the current structure and bullish reaction from the FVG zone, a potential price path is drawn on the chart. It suggests one more liquidity grab into the FVG area followed by an impulsive move to the upside.
The blue projection line outlines a potential retracement to fill the nearby FVG (which remains partially unmitigated), followed by a resumption of bullish momentum that targets a revisit to the previous high area around 19,875.
Additional Notes:
* Multiple FVGs are actively interacting in this region, giving layered confluence for demand zones.
* The reaction from the FVG zone is coupled with a bullish engulfing pattern on the 1-hour timeframe, signaling aggressive buying.
* Price remains above the internal bullish structure despite the earlier rejection from the Golden Pocket area.
Conclusion:
The chart setup represents a textbook example of FVG demand zone reaction, supported by Fibonacci confluence and market structure shifts. As price consolidates above this key FVG, a continuation to the upside becomes a strong probability if the internal structure remains intact. Traders should monitor price behavior on lower timeframes as it interacts with the 0.618 and FVG zones for confirmation of bullish continuation.

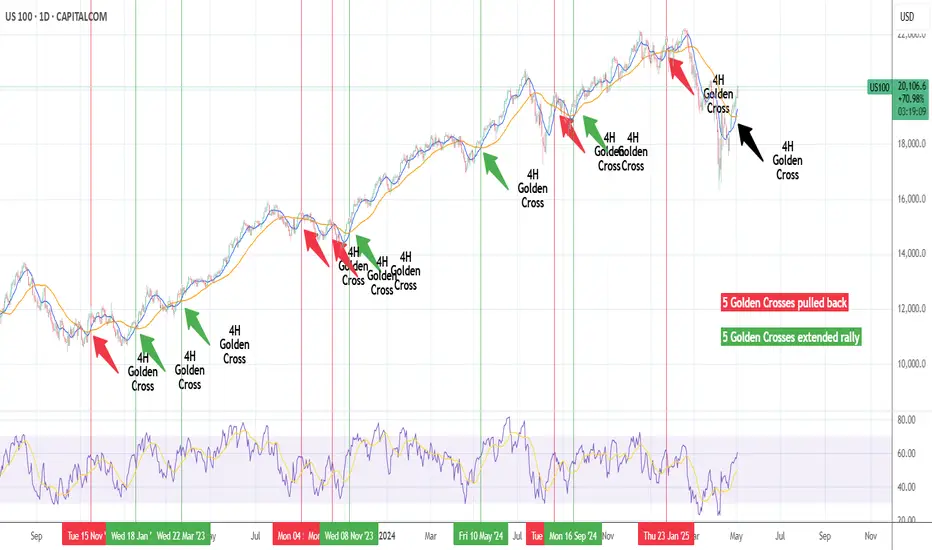
NASDAQ: 50% probability that this Golden Cross is bearish.Nasdaq is bullish on its 1D technical outlook (RSI = 60.920, MACD = 61.810, ADX = 33.031) as it continues its recovery from the Low of the previous month. In the meantime, it formed a 4H Golden Cross, the first since January 23rd. Even though this is a bullish pattern theoretically, it often doesn't deliver an immediate rise. More specifically, since the October 2022 market bottom, Nasdaq has had another 10 Golden Crosses on the 4H timeframe. The interesting statistic is that 5 have extended their rallies but the other 5 cuased a pullback (short or medium term). Consequently we call for caution in the next 2 weeks, as the market may correct towards the 4H MA200 before it resumes the long term uptrend.
## If you like our free content follow our profile to get more daily ideas. ##
## Comments and likes are greatly appreciated. ##
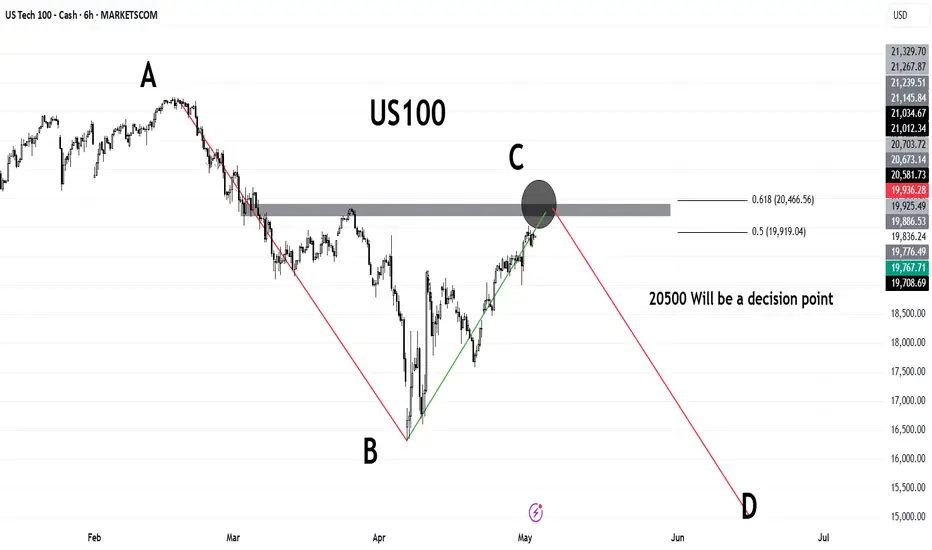
US100US100 has shown great strength after terrif news.
If we look at the bigger picture, recent bullish rally looks like a pull back. Currently it is heading towards very important region , 20500 which is also the 61% retracement level.
If the price close above 20500 then we can consider it a new bullish rally.
NAS100USD: Price Respects Bearish Structure at 62% FibGreetings Traders,
In today’s analysis on NAS100USD, we observe sustained bearish institutional order flow, and we aim to align with this directional bias by identifying high-probability selling opportunities.
KEY OBSERVATIONS:
1. Retracement into Premium Resistance:
Price has recently retraced into premium pricing levels, reaching the 62% Fibonacci retracement zone—a level that often acts as dynamic resistance. This retracement also aligned with a bearish breaker block, confirming institutional resistance at that level. The market has since shown signs of rejection, reinforcing the bearish narrative.
2. Emergence of Fair Value Gap (FVG) as a Key Resistance Array:
Following the rejection, a new FVG has formed, acting as a potential short-term resistance zone. This area provides a refined point of interest where institutions may look to re-engage in selling activity. The alignment of the FVG with previous resistance adds further confluence to the bearish setup.
TRADING PLAN:
We will monitor the newly formed FVG zone for signs of bearish confirmation. Upon confirmation, the plan is to execute short positions targeting liquidity pools in discounted price zones, in line with institutional price delivery patterns.
Remain focused, wait for confirmation, and make sure this idea aligns with your overall trading plan.
Kind Regards,
The Architect
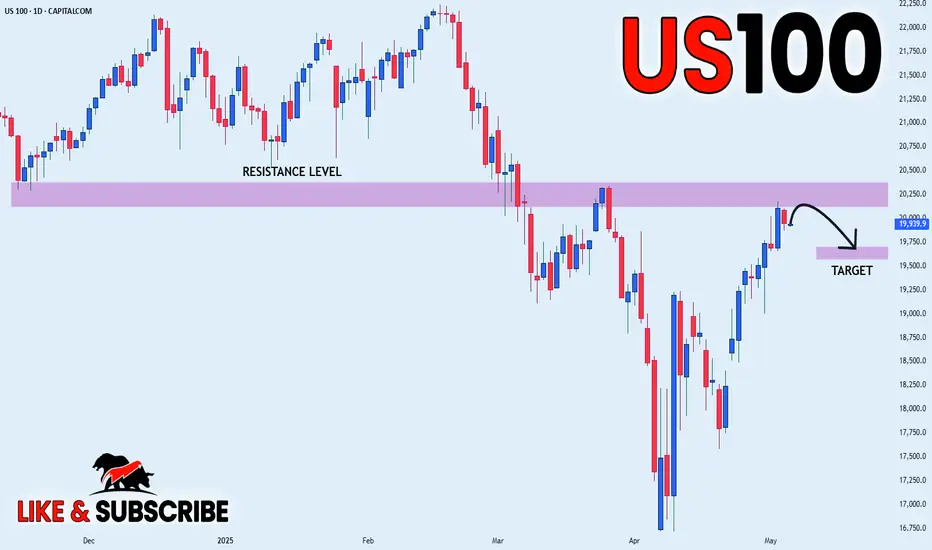
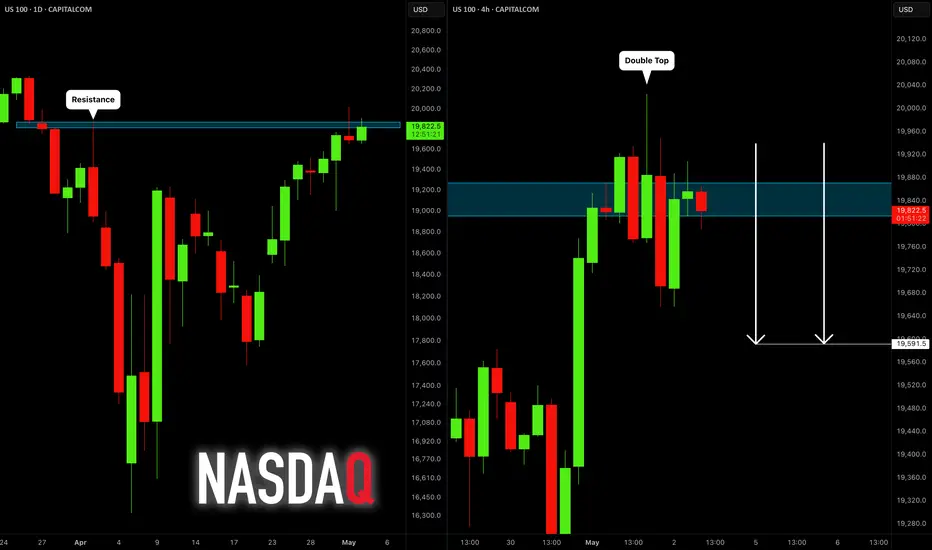
NASDAQ INDEX (US100): Time for Pullback
There is a high chance that US100 will retrace from the underlined
blue daily resistance.
I spotted a double top pattern on a 4h time frame after its test
and a nice bearish imbalance candle that was formed
during the NY session yesterday as confirmations.
Goal - 19590
❤️Please, support my work with like, thank you!❤️
BTC - Inversion Play at Resistance With IFVG Breakdown PotentialPrice has tapped into a previously established resistance zone and is now showing signs of exhaustion. A reactive short setup is in play, contingent on further bearish confirmation.
---
1. Resistance Zone — Key Supply Area
The marked red zone above highlights:
- Repeated Rejections: Price has failed multiple times to break and hold above this level.
- Order Block & Liquidity: Likely an area where institutional selling interest remains.
This zone offers a prime location for short setups, especially if price fails to hold above it and begins to roll over.
---
2. IFVG Inversion — Breaker-Type Setup
We are watching for:
- Inversion of a Bullish IFVG: A common signal of shifting order flow.
- Breaker Behavior: A previously supportive zone now acting as resistance — a hallmark of smart money reversals.
This structure suggests an intent to trap late longs and transition into lower pricing.
---
3. Internal Liquidity Sweep — Fuel for the Drop
The local high served to:
- Clear Short-Term Liquidity: Wick just above resistance suggests engineered breakout bait.
- Trigger Buyer Commitment: Which could now get trapped if momentum fails.
This liquidity event sets up the conditions for a more sustained push downward.
---
4. Downside Targeting the Discount Zone
Price is projected to revisit the blue discount zone:
- 0.618–0.65 Retracement Levels: Classic Fibonacci discount area often targeted after a premium rejection.
- Reaccumulation Potential: Watch for signs of buyer interest returning here.
This forms the logical destination for price following a confirmed rejection.
---
5. Summary:
- Price Rejecting Resistance & IFVG Inversion Signals Reversal Bias
- Liquidity Sweep Confirms Trap Setup
- Discount Zone Below Offers High-Probability Reaction Area
A strong short scenario may unfold if bearish order flow confirms beneath the resistance region.
NASDAQ testing its 1D MA50. Break-out or Fake-out?Nasdaq (NDX) has reached its 1D MA50 (blue trend-line) for the first time since February 24. Following the (near) rebound on the 1W MA200 (orange trend-line), this looks like a textbook recovery from a correction to a new long-term Bullish Leg.
Chronologically the last such correction was the March 2020 COVID flash crash, which after it almost touched the 1W MA200, it recovered as fast as the current rebound and when it broke above its 1D MA50, it turned it into the Support of the new long-term Bullish Leg.
What wasn't a break-out but a fake-out was the rebound after the June 13 2022 (near) 1W MA200 rebound, when the break above the 1D MA50 was false as it produced a new rejection and sell-off later on. The difference is that 2022 was a technical Bear Cycle both in terms of length and strength.
Whatever the case, Nasdaq has seen the lowest 1W RSI (oversold) reading among those 3 bottoms. So do you think today's 1D MA50 test is a break-out or fake-out?
-------------------------------------------------------------------------------
** Please LIKE 👍, FOLLOW ✅, SHARE 🙌 and COMMENT ✍ if you enjoy this idea! Also share your ideas and charts in the comments section below! This is best way to keep it relevant, support us, keep the content here free and allow the idea to reach as many people as possible. **
-------------------------------------------------------------------------------
💸💸💸💸💸💸
👇 👇 👇 👇 👇 👇

NAS100USD: Bullish Scalping Opportunity from SupportGreetings Traders,
In today’s analysis of NAS100USD, we identify bullish institutional order flow, and as such, we aim to align with this narrative by seeking buying opportunities.
This setup presents a scalping opportunity on the lower timeframes, with price currently reacting to a bullish order block serving as a key institutional support zone. Upon confirmation, we anticipate a move toward the liquidity pool in premium pricing, which will serve as our target zone for profit-taking.
As always, remain disciplined, wait for clear confirmation, and manage risk accordingly.
Kind Regards,
The Architect
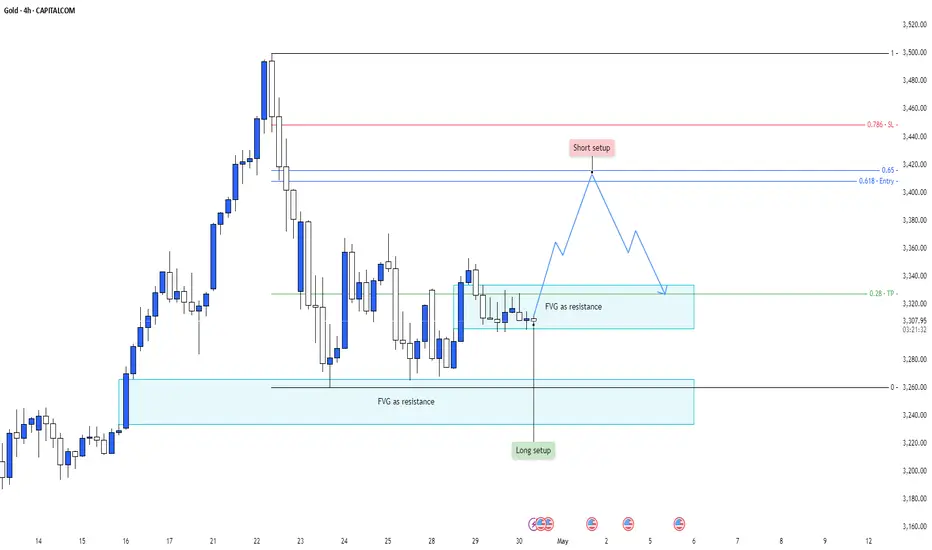
GOLD - FVG-Based Long & Short Setup Within Range ContextPrice action remains range-bound with well-defined FVG zones acting as both support and resistance, offering reactive trading opportunities on both sides.
---
1. Upper FVG as Resistance — Short Setup Trigger Zone
The highlighted upper green zone marks:
- Fair Value Gap (FVG): A clear inefficiency from the previous bearish impulse.
- Structural Significance: Price has struggled to break and hold above, showing signs of supply reactivation.
This zone is likely to attract sellers upon revisit, offering a clean risk-defined short opportunity.
---
2. Lower FVG as Support — Long Setup Zone
The lower blue zone serves as:
- FVG Rebalance Area: A region where price previously left inefficiency, now acting as strong support.
- Accumulation Interest: Smart money often reloads in such imbalanced areas on retests.
This zone is optimal for positioning into the next bullish leg should price dip lower.
---
3. Liquidity Sweep Mechanics — Trap Both Sides
The market structure hints at:
- Step 1: Induce buyers into breakout longs into resistance.
- Step 2: Reverse from FVG, triggering short entries and trapping longs.
- Step 3: Collect liquidity from lower range, potentially initiating new accumulation.
This movement pattern is characteristic of engineered liquidity grabs in both directions.
---
4. Mid-Range Reaction — Key Pivot Area
Price currently hovers around the mid-range zone:
- Serving as a temporary balance point before volatility expansion.
- Acting as a launchpad for the next impulsive move, depending on order flow dominance.
Patience here is key — waiting for clean confirmations near FVGs provides optimal entry quality.
---
5. Summary:
- Upper FVG Resistance → Short Bias
- Lower FVG Support → Long Bias
- Structured Reactions Around Imbalances Suggest Smart Money Activity
This is a dual-sided setup ideal for reaction-based traders awaiting price confirmation at extremes.