US100 4HR TimeframeIt might be a good opportunity to buy at 11780
Its forming an inverted Head And Sholder
And breaking a strong resistance
And its gonna be breaking 0.382 Fibonacci
Us100signal

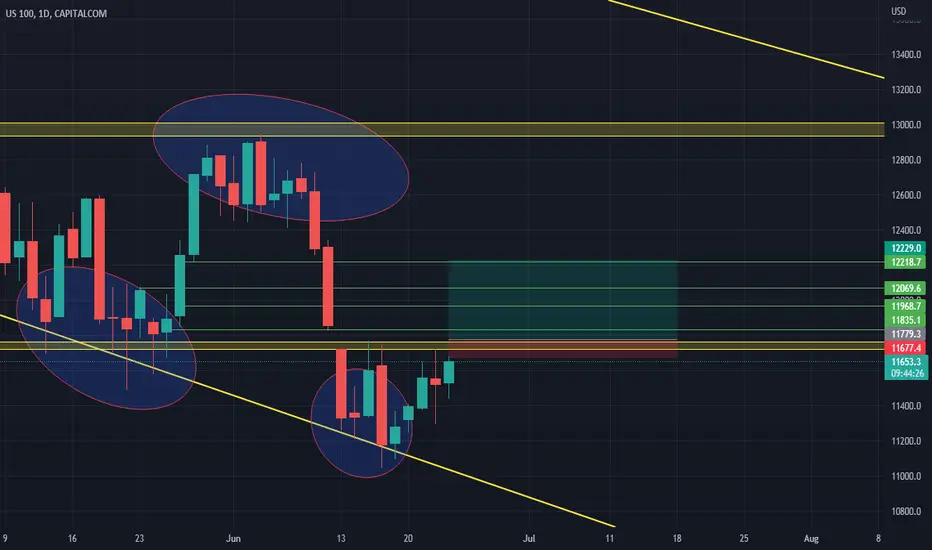
US100 DAILY TIMEFRAMEUS100 might have a good sell after it break 11780 that is 0.382 on fibonacci target 12210 that is 0.618 on fibonnacci
after reaching historical level it reversed now breaking that resistance is good and its still have gap to fill
and its still bouncing between the channel
as on the weekly timeframe we have divergence on cci and %R
have confirmations before taking the trade when it brake see how its breaking and the candles
and do ur own risk management and secure profits always
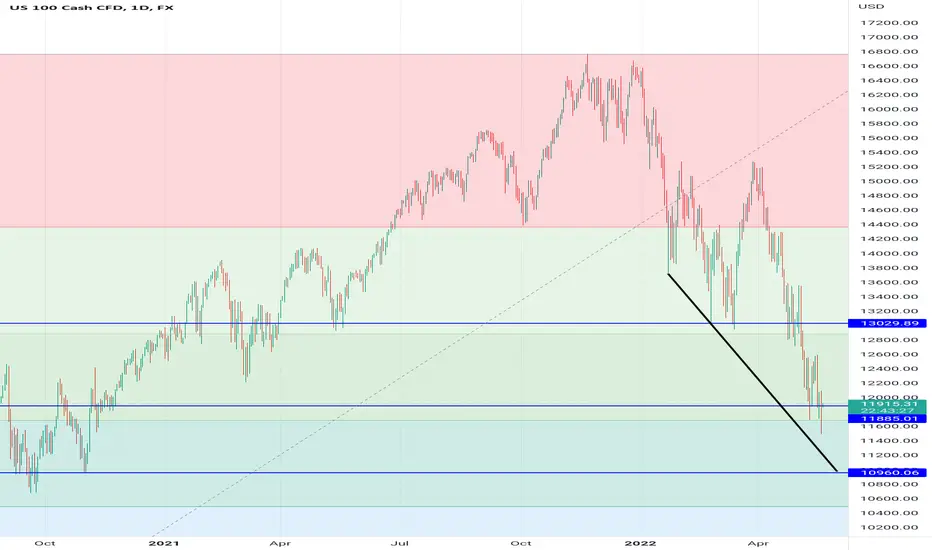
US100 bearishprice respected The horizontal resistance & falling trendline. expected continue fall to next support at 11210 level

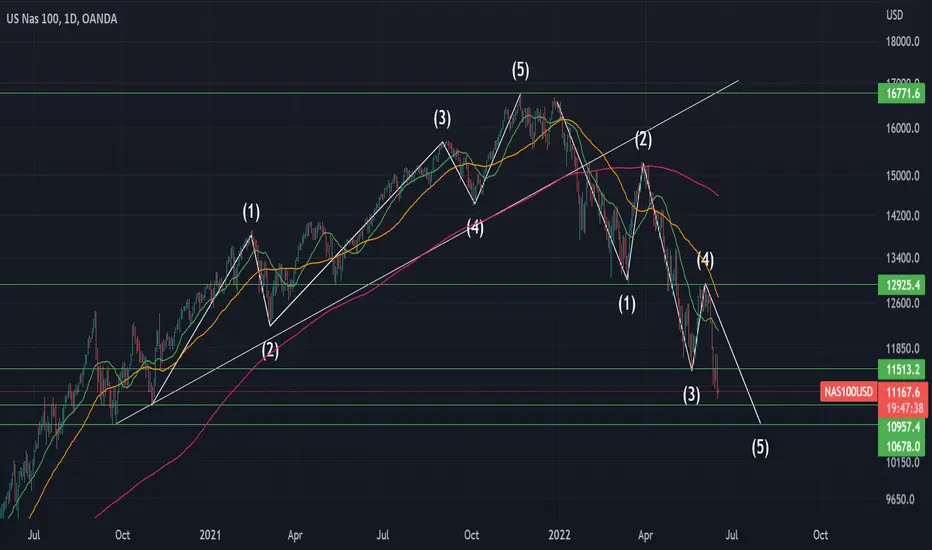
NASDAQ / US100According to The Illiote Stock Market's continued decline , we have no signs of rising right now .
NAS100 [US100] Daily Outlook | 08-JuneHolla Team,
Here is my plan today. Hope you make money with you.
Se you all during livestream/trading today @ 8:45AM EST.
Kings
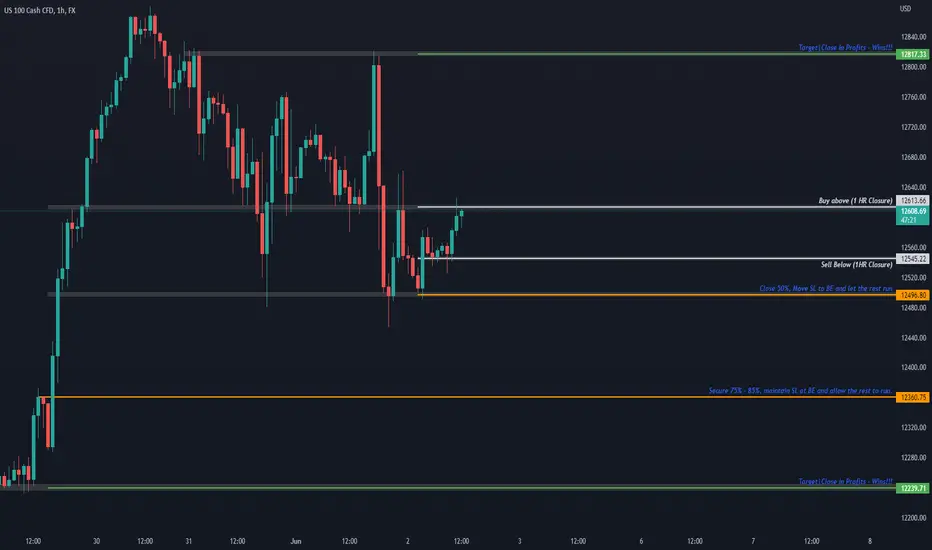
NAS100 [US100] Daily Outlook | 06-JuneHi Everyone,
Today's plan is pretty straight forward; 'Keep it simple', 'stick to the plan', 'use good risk management' and 'target only the levels i have drawn'. If it drives, it drives!
Update coming as expected.
Kings.

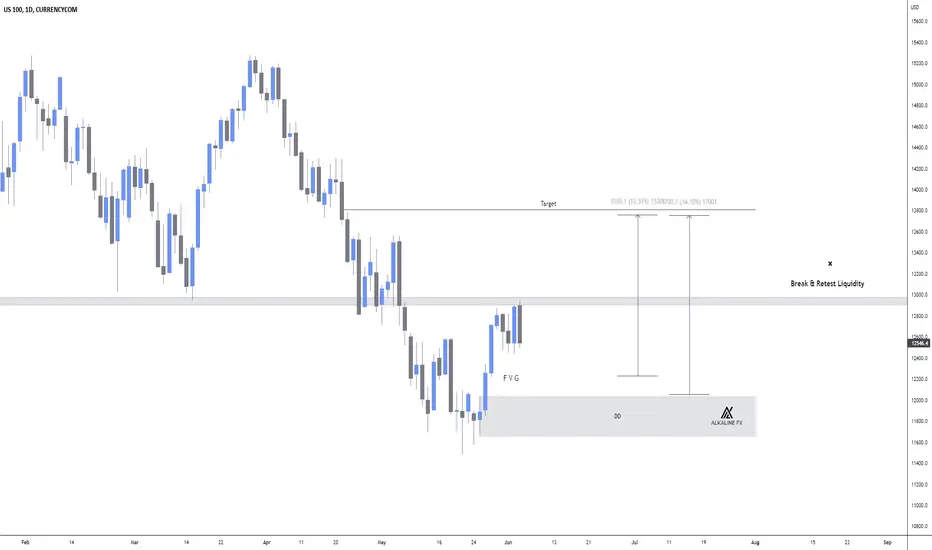
US100: Buyers Takeover 🚀Price is currently using the previous structure as a barrier to lure sellers into the market.
Sellers may get slightly hope but it is likely that buyers will take control once the fair value gap and daily demand are met.
My alerts are set and ready to join buyers when the time is right.
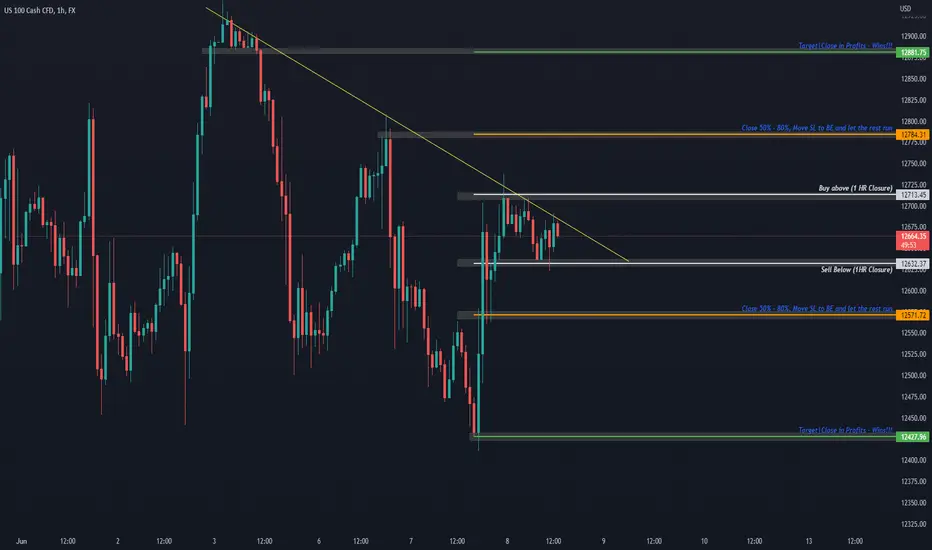
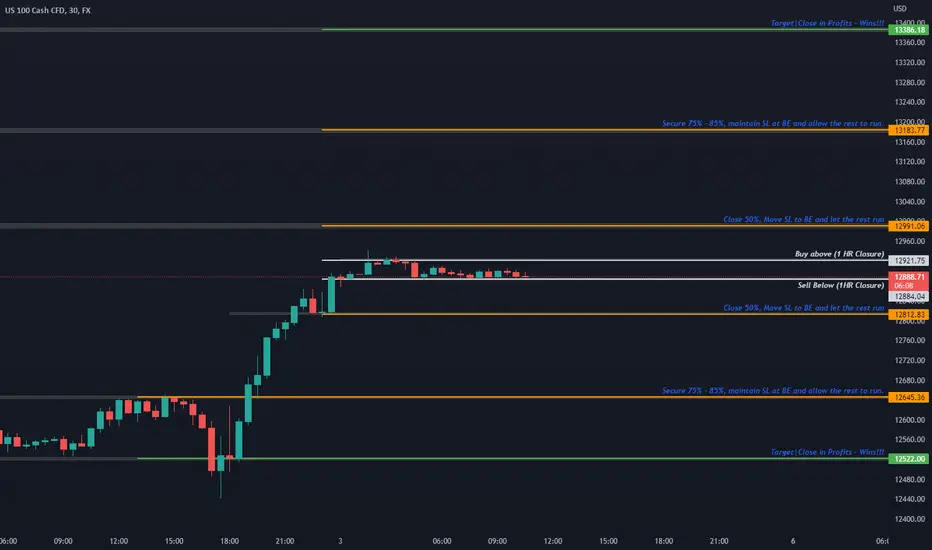
NAS100 [US100] Daily Outlook | 03-JuneHolla Amigos,
As seen in the chart, here is what am looking at today.
Hopefully NFP release will drive price to our TP.
Update will be shared accordingly.
NAS100 Live Trade Streaming at 8:45AM EST (Mon-Fri)
Kings.
NAS100 [US100] Daily Outlook | 02-JuneThe plan today is pretty simple. Follow it with keen attention to your capital and risk management.
Lets see how it plays out.
Kings
NAS100 [US100] Daily Outlook | 1-JuneWelcome to JUNE Amigos!
Here is what am looking at today.
made +100pips✅ (before NYSE open)+80pips ✅(Live trading during NYSE Open) yesterday.
See you all during today's live streaming (8:45AM EST)
I will update intermittently.
Kings.

US100 - Long Ideahello again guys,
we were in a downtrend with US100 , but on Daily timeframe US100 break the counter trendline and on retest we can find a great buying opportunity as I marked in my analysis.
great Risk to Reward ratio I am waiting to dive in :) this is only for education purpose not any financial advice.

NAS100 [US100] Daily Outlook | 30-MayHappy New Week Friends,
Hope you had a dream filled holidays?
Here is what am looking at for today. I will most likely close at partial TP zones as i don't expect volume today.
See you at 8:45 AM EST live streaming
Updates will be shared accordingly.
Kings
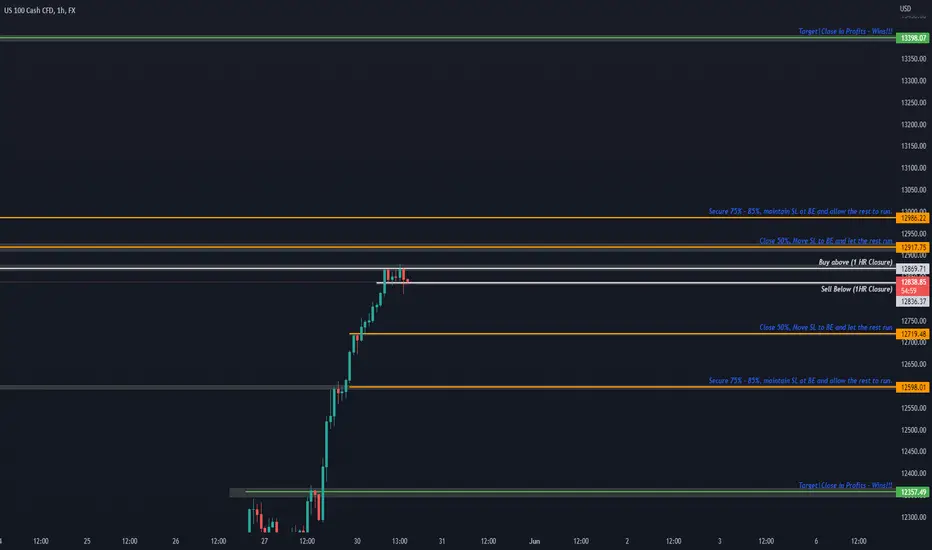
NAS100 [US100] Daily Outlook | 27-MayHolla Amigos,
Here is what am looking at today. Will will be streaming live for educational purposes at 8:45 AM EST.
Intermediate updates coming soon.
Kings

NAS100 [US100] Daily Outlook | 26-MayHolla,
My main bias today is 'SELL' but i have to be very careful not to miss out on any 'BUY' moves that may take over my bearish bias.
I will update in-between trades.
Kings.

US 100US 100 i will take LONG Position around
ENTRY - 11728.00
TP 1- 11928.00 ( +200 PIPS )
TP 2 - 12128.00 ( +400 PIPS )
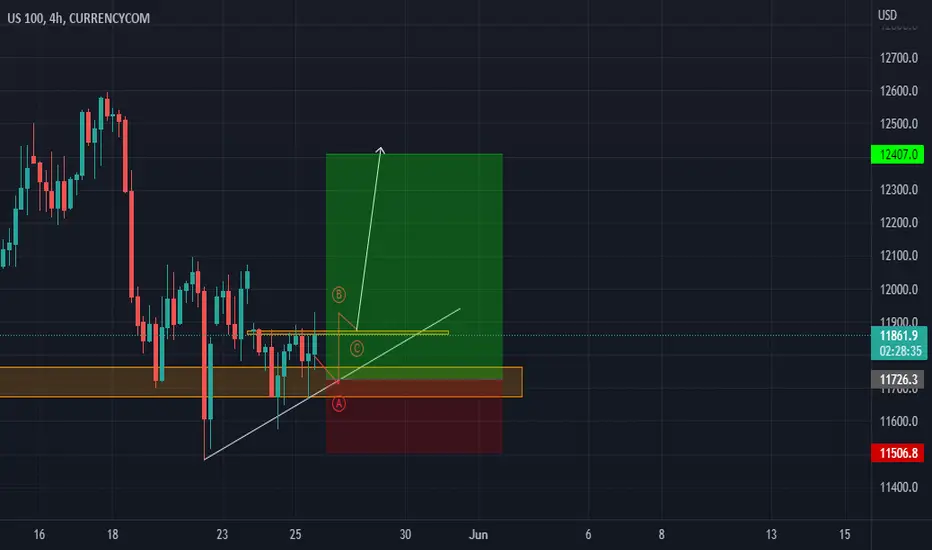
NAS100 [US100] Daily Outlook | 25-MayHolla Amigos,
A quick look at 4Hr timeframe shows that we might have a very clear buy today.
Reason:
1. Fakeout play in 4hr TF thus indicating that price may drive majorly upwards.
You might want to stick with price direction to avoid compounding losses.
I will update here as usual.
Kings

SHORTING US100Looking for a short signal with US100. The market failed to move up on 23rd May at 8pm GMT. Which resulted in market jump. market failed to correct that jump hence I’m continuing this jump with a Sell

NAS100 Daily Outlook | 23-MayHow was your weekend?
Here is what am waiting for today. Hopefully we will see a good confirmation to help us make much out of the move.
Will submit my updates accordingly if i should take positions.
Kings

nas100|possible senario for short price in a bearish channel we can expect long setup till 13000 after that we should look for short setup and good context first tp 10444


US100 IS AT FIB50. WHAT NEXTThere might be a fall to the trendline, pull back and then fall to the next FIB61.8
We await what the market will birth
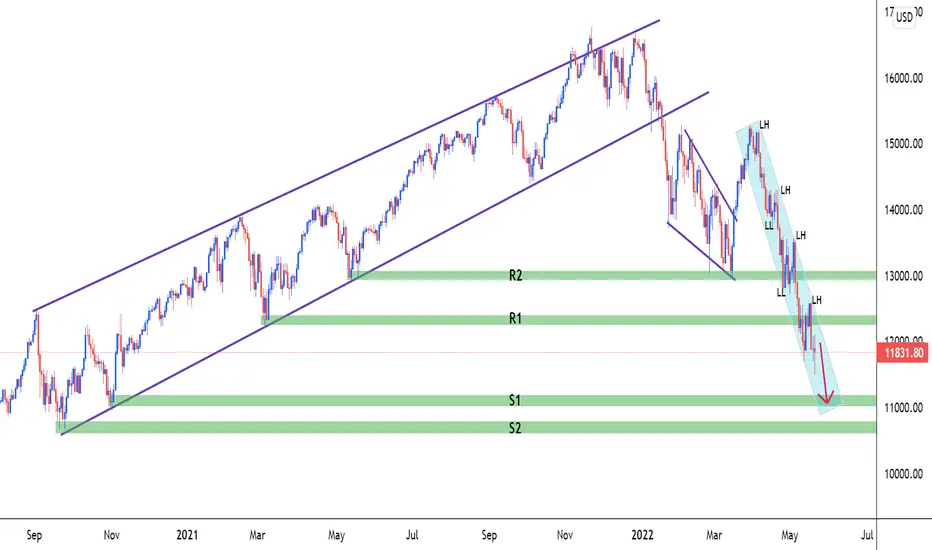
NAS100| Expect more selling pressure!Nas100 is still bearish. Last week, bulls failed to take the market higher, instead the market printed another lower high (as we can see that the market has already printed a series of lower highs and lower lows).
Nearby resistance is seen at around 12300, second resistance is seen at 13000. In case of a bullish move this coming week, buyers would have difficulties to violate the first resistance. On the other hand, bears continuing to dominate will send price lower and they would be eyeing 11000 as the first nearby support. Second support is seen at around 10690.00. I have a strong bearish bias and as long as price continues to trade below 12300.00 we can be certain that 11000 would be an easy target for sellers.
If you find my ideas helpful, please support my work with likes.
If you have any question or opinion feel free to write in the comment section below.
Do not forget to follow to continue receiving ideas likes this.
NAS100 [US100] Daily Outlook | 20-MayHere are my plans for NAS100 .
Will provide more update within the day.
Kings.
