Story behind EURUSD chart and US10Y and DE10Y risk premiumLet’s have a look at the Currency and Bond markets today after an eventful last few weeks in both markets. After Moody’s downgrade of the US Gov bonds the markets look seemingly quiet. There has been no sudden spike in the US10Y. But it makes lot of sense to look beneath the hood and compare the Bond and the currency markets. Today we are looking into the 2 largest currency pairs, i.e. FX:EURUSD and the largest bond markets i.e. US10Y and German 10Y.
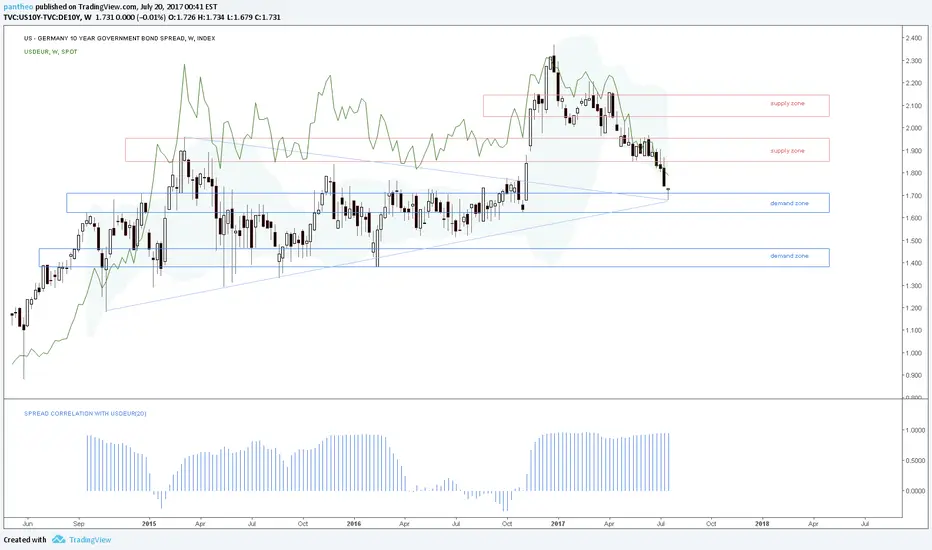
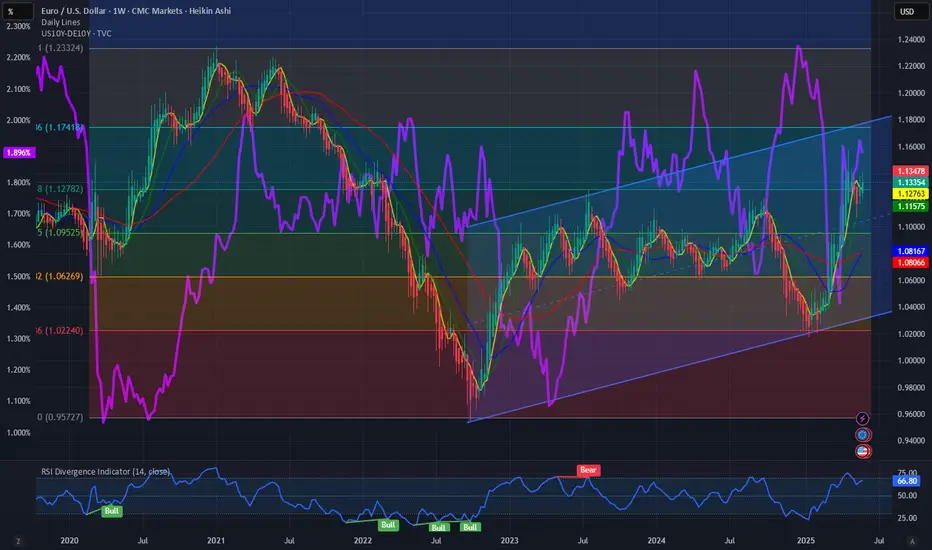
It is astounding to observe how the Fib retracement levels from the peak and troughs in the FX:EURUSD and TVC:US10 - TVC:DE10Y charts coincide. Both indicators at @ 0.618 Fib levels. As anyone would expect when the FX:EURUSD makes new highs the diff between TVC:US10Y and TVC:DE10Y hits new highs as investors long the FX:EURUSD chart and in that way hedge the risk in the TVC:US10Y without going short TVC:US10Y which will then adversely affect the investors portfolio. Institutional investors have been unwinding the long position in the TVC:US10Y by going long EUR, YEN and CHF in the currency markets without explicitly selling the US10Y.
Going back to the charts, what can we expect in the medium to long term? In my expectation both the charts can reach 0.786 Fib level and subsequently the 1.0 Levels. This will take the FX:EURUSD from 1.13 to 1.18 by the end of 2025 and then to our long-term target of 1.25. If those levels hold onto in the currency markets, then the risk premium of TVC:US10Y over TVC:DE10Y which is denoted in the chart by TVC:US10Y - TVC:DE10Y will go from 1.9% to 2.1% and then top out at 2.3%. May be this is the way USD will lose some of its market share as world reserve currency status.
Verdict: USD Reserve currency status weakening. Buoyant FX:EURUSD marching towards 1.25. TVC:US10Y - TVC:DE10Y can reach 2.3%.
US10Y-DE10Y
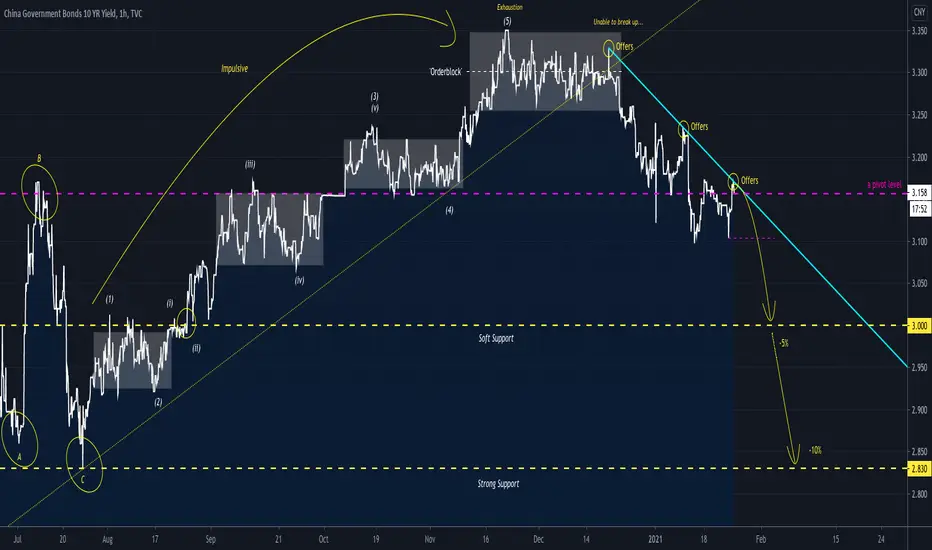
ridethepig | Chinese Yields Struggling📌 A Pullback for Chinese Yields
This illustrates the notion of development in a change in trend for China's sovereign bond market . Sellers avoided a breakout and are aiming to test 3.00%.
On the fundamental side , China is outperforming as expectations are skewed towards favouring their management of the virus and recognisable weakness of the West!
Strong LT push factors remain in play, putting the renminbi into SDR was a g ame-changer , as with the Saudi's allowing issuing Oil in CNY contracts; 2020 was the year of the Yuan while 2021 looks more like a game of two halves. H1 2021 we have another deflation storm cooking while H2 2021 rate markets are showing early hints of inflation and rate hikes.
On the technical side, sellers now have the attacking position in the highs. This is a definite advantage . Here the weakness comes from a breach of our diagonal resistance (light blue). With this move, sellers see themselves as obliged to continue by playing an initial test of 3.00% which will unlock a sweep of July 2020 lows at 2.83%.
Thanks as usual for keeping the support coming 👍 or 👎
ridethepig | Rate Differentials Pausing via Italian Politics 📌 ridethepig | Rate Differentials Pausing via Italian Politics
An important chart update here as we are talking "differentials" in the abstract concept of waves and TA.
We must first take notes of the previous leg which was the 1st wave and far from easy to spot, in the early game of rate differential turns, it takes a lot of energy to exploit one side the whole business involves activity. Think of the complicated setup, above the orderblock as a breakout, and remember we are playing a whitespace game!
On the other hand, operations on the FX board are quite simple and natural to follow. There have been some signs of a temp high cooking in EURUSD and with Italian politics entering back under the spotlight it will likely be used as a blockader. Remember ECB may, when the occasion demands it, possibly send forward false flags to clear the ground of infiltration above 1.25.
A pullback in rate differentials towards 1.25 will be enough to clear the board and by the apparently primitive sequence an ABC pullback should materialise. The pullback should cap the highs in EURUSD for now until the summer to gather energy before we can launch decisively higher.
Thanks as usual for keeping the feedback coming 👍 or 👎
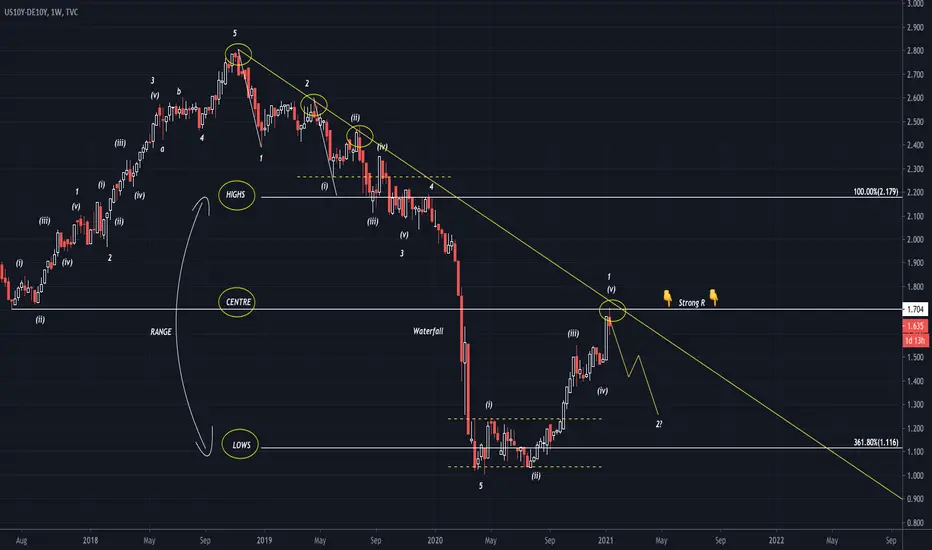
ridethepig | Rate Differentials 📍 A quick update here on the elements of EUR and USD
Ending the 'C' part in the swing down has been a hard struggle and with such a problem a surprising retreat is expected. Buyers are threatening to bottle up their opponent.
A pullback in EURUSD towards 1.15/1.14 will make things a lot easier:
Inflation is demanding a return, after sufficient preparation, watch out on the battlefield (see my explanation in the recession strategy). The other theoretically plan of attack is a flank attack in USD which must be nipped in the bud via FED but they will lag behind now.
Real money understands the point behind this move. Firstly, the test of 1.70 is starting to be considered from the point of view that the current block is settled to the topside.
As usual thanks for keeping the feedback coming 👍 or 👎

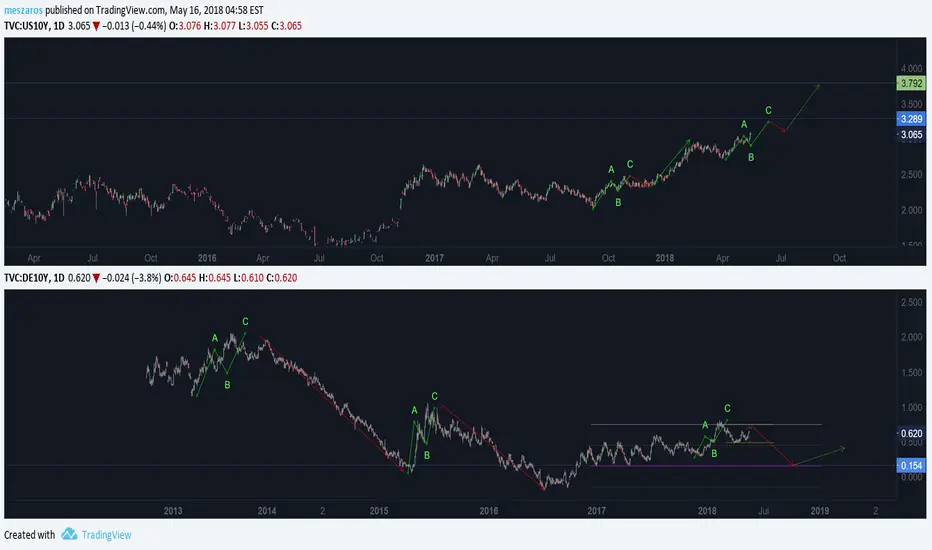
10-year yield curve US-German comparison...10-year yield curve US-German comparison. The comparison aims at further understanding the EURUSD track. The DE10Y yield curve shows that the decreasing correction structure (red line) is shorter. But it can also be seen that the size of the fractals (green wave) before them is getting smaller. It can have two consequences. The first is that a drop in yields is expected in the short term. Then there will be a very flat rise in yield. Conversely, the US10Y yield curve surpassed 3% and showed a strong upward trend. Currently it has a target level of 3.75%. This difference may favor the dollar. The conclusion is that the US dollar may continue to strengthen in the short to medium term.
Possible reaction zone in US-GER 10Y spread $DXYWorking on daily swing low, weekly hammer $ZN_F, $FGBL, $EURUSD