History repeatsFrom 1900
history always repeats.
learn history.
long explaination is not helpful.
wisdom is taken only by soul walkers
źzzzzzzzzzzzzzzzzzzzzzz
zzzzzzzzzzzzzzzzzzzzzzzz
US RUSS 2000
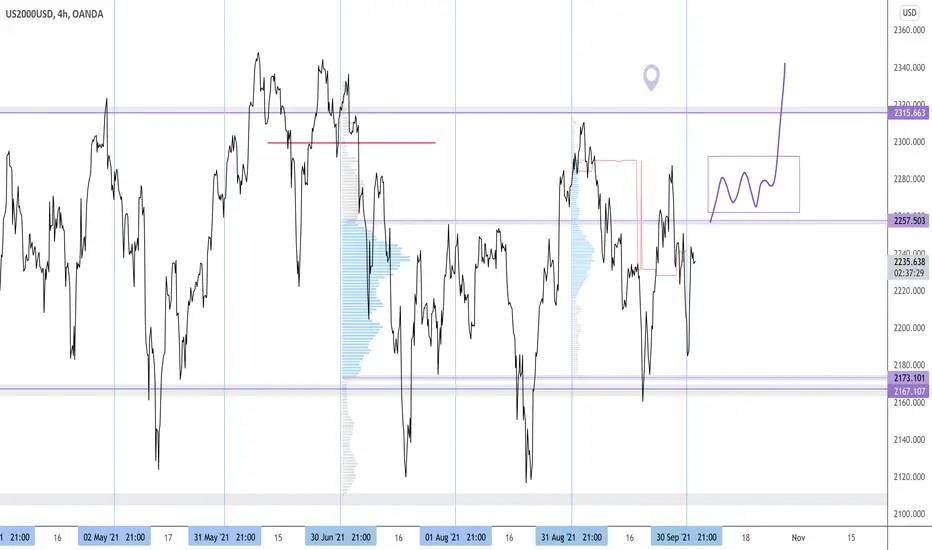
RUSSELL BREAK COMING SOON!!The Russell 2000 has been in a year long consolidation pattern - w/ price finding supply above 2315 & demand below 2165 - We are currently opening the month inside last months & last quarters value - which makes price action neutral at the moment - BUT price held up well durning this latest equity selloff showing some relative strength & a possible short term higher low - looking for a break & buildup above 2257 top setup for another test of the highs w/ probability of finally breaking out of this range increasing - however price action below this months open should b considered negative and any bullish setups would have to wait till we move back above.
Watch & see how it plays out!!!

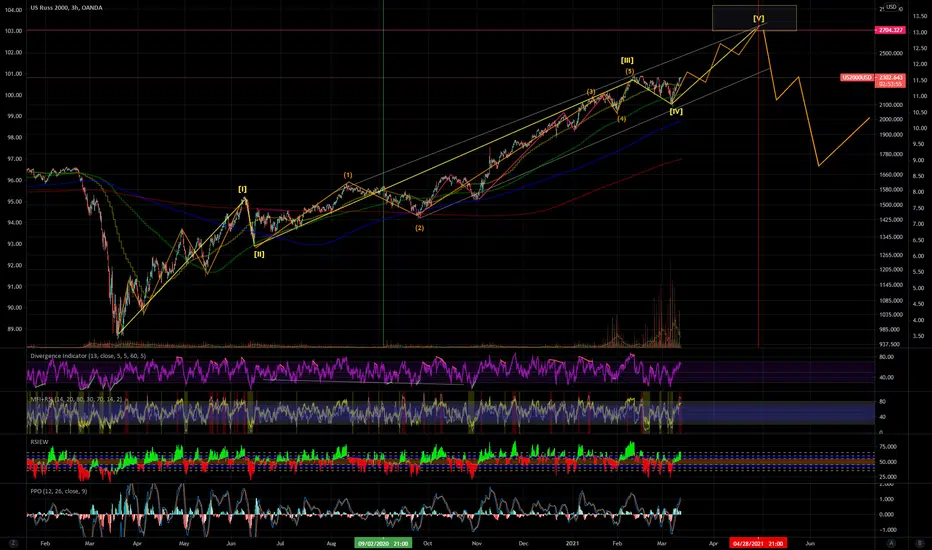
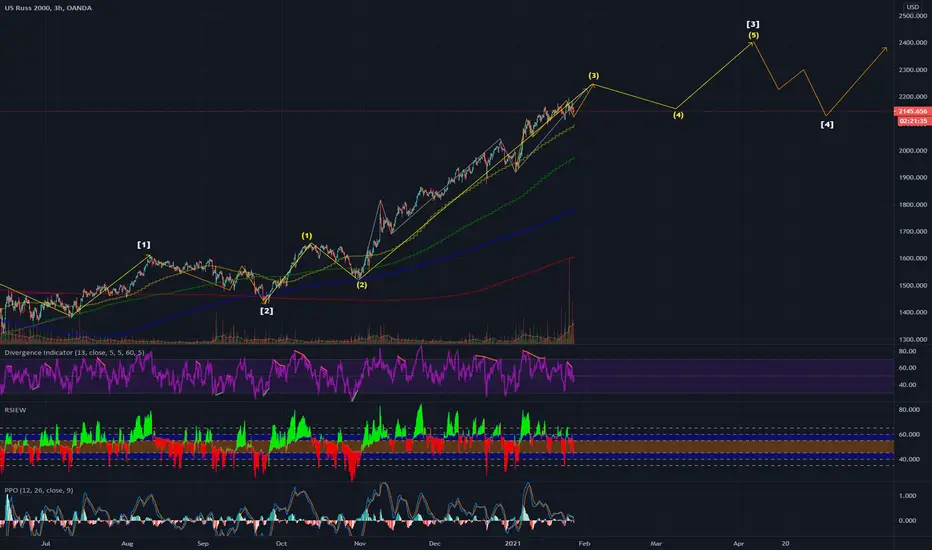
US200USD: RUSSELL 2000 updated COUNTShort-term = SHORT.
Mid-term = LONG.
This is my PERSONAL trading CHART, with no further educational explanations.
BUYING STRATEGY: Take 50% profit at 50% of previous WAVE (just do it) and place stop at purchase price.
IF price reverses lower YOUR EVEN,.... IF price continues UP-TREND then, re-buy at NEXT CORRECTIVE WAVE.
This is actually a very aggressive strategy for going in early that is why 50% "hedge" PROFIT is taken EARLY in the TRADE.
Combining ELLIOTT WAVE and THIS strategy , has SAVED my account 3-TMES during the past 3-weeks.
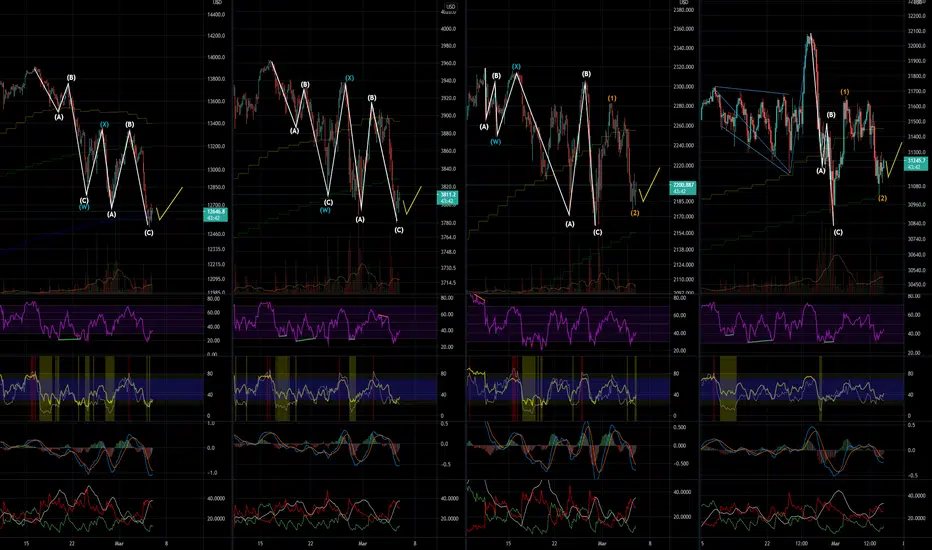

US-MARKETS : CORECTION NEARNG COMPLETIONDuring CORRECTIONS it is inciteful to create a CHART, where YOU can watch ALL the INDICES at once.
This is my PERSONAL trading CHART, with no further educational explanations.
IF you get it, YOU GET IT, if you don't, YOU DON'T. I really don't care.
We use ELLIOTT WAVE theory to determine WHAT we are looking for, (i.e. TOP or BOTTOM). THEN technical MULTI-TIME-FRAME Indicator analysis
To fine-tune to what extent price will and when. Enter and exit TRADES in steps ... NEVER go all-in or all-out at ONCE.

US-MARKET CORRECTION NEARLY COMPLETEDuring CORRECTIONS I find it useful to create a CHART, where YOU can watch ALL the INDICES at once.
This is my PERSONAL trading CHART, with no further educational explanations.
IF you get it, YOU GET IT, if you don't, YOU DON'T. I really don't care.
We use ELLIOTT WAVE theory to determine WHAT we are looking for, (i.e. TOP or BOTTOM). THEN technical MULTI-TIME-FRAME Indicator analysis
To fine-tune the expected move in terms of PRICE and TIMING. Enter and exit TRADES in steps ... NEVER go all-in or all-out at ONCE.

Russel small cap 2000 short ideaRussel small cap 2000 moving upside in a paralell channel and now the price arrived to the Channel upper line at 2300 usd. I think it will go down to previously support/resistance at ~2200.
Trade at your own risk.
If you like my idea, dont forget to leave a comment, follow, and like.

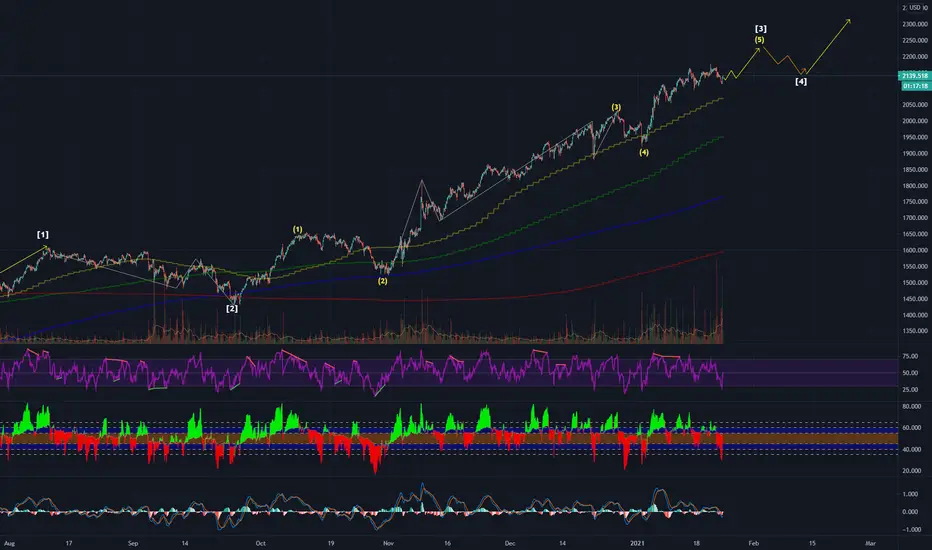
US200USD: RUSSEL looks kinda BULLISH to me = LONGThe RUT corrective structure LOOKs soooo BULLISH, I just had to PUBLISH it.
LONG

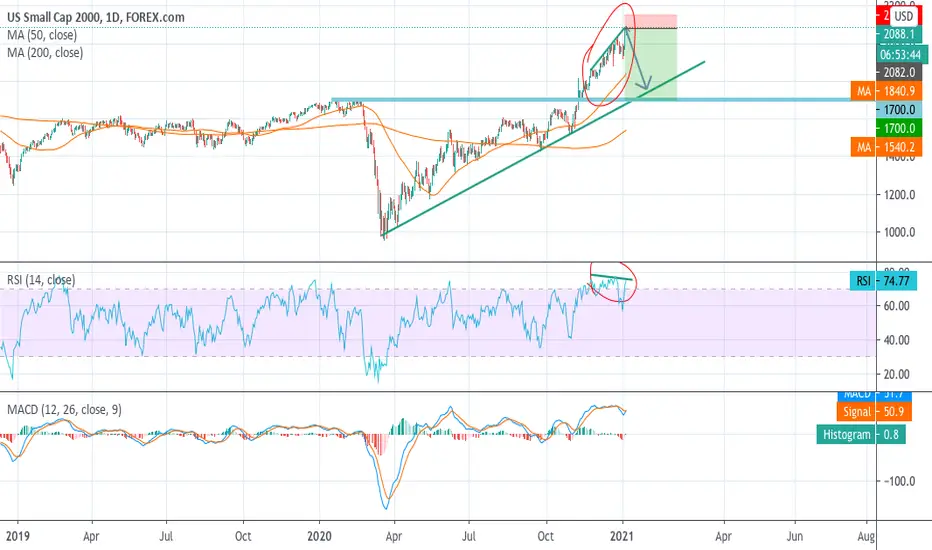
US2000 RSI divergenceUS2000 shows RSI divergence on the daily chart. In my opinion the price will fall to February 2020 highest price around 1700.
Open: Market open
SL: 2155
TP: around 1700
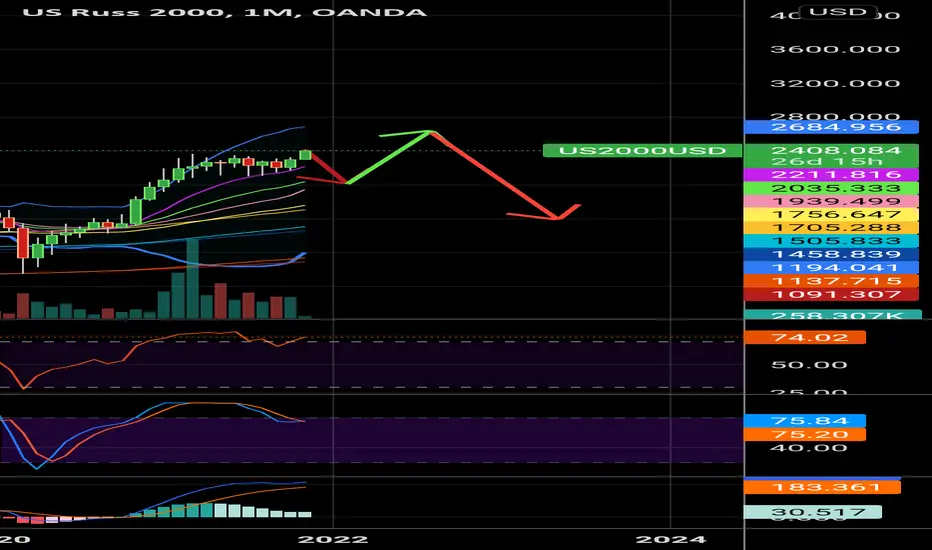
US2000USD: RUSSELL 2000 correction COMMINGUPDATED COUNT looks primed for CORRECTION
HOW upcoming STIMULAS DEAL will affect COUNT ?

US200USD: RUT SIDEWAYS then CORRECTION commingExpect Russel to trade sideways until other indices align then Correction as shown

US2000USD: RUSSELL 2000 5H-WAVE COMPLETEDAS SOON AS the DOLLAR's FALL starts to slow DOWN .... Get ready for the BIG-BOYS to Bail (take profits) on the MARKET

Russel 2000 Bull Flag Long OpportunityRussel 2000 broke out of bull flag, will look for bullish continuation.

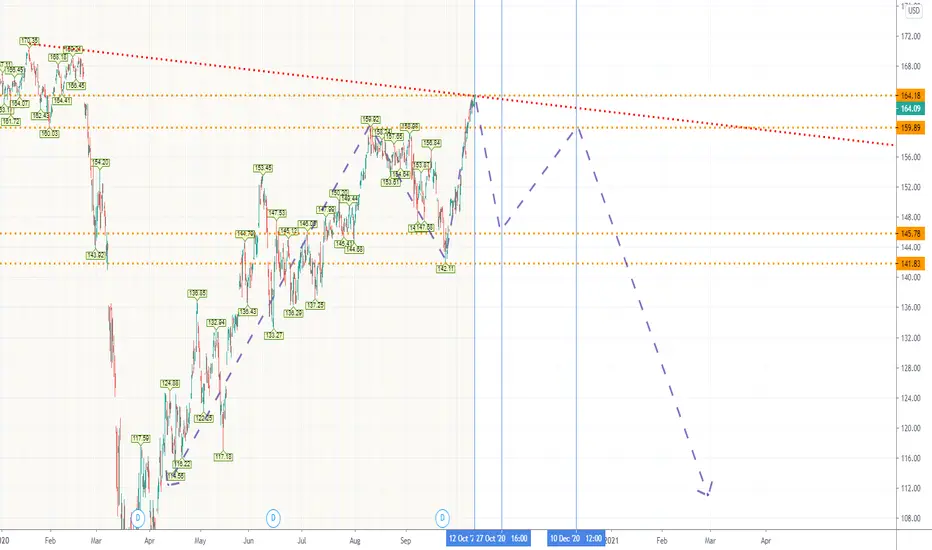
IWM - a TOP of massive H&S!
a massive H&S for IWM/Russell is forming
next days SHORT to 148/141 levels
LONG from there to a second shoulder till mid December
final DROP to March lows in December
RUT - a diamond on Mt Everest TOP!
a DIAMOND reversal patterns on H&S top 1647
a DROP expect today or tomorrow
see more in my previous analysis

RUT US2000USD - Mt Everest top 1647!
Mt Everest reached! Officially 1647
This should be a TOP of a massive H&S 1608 - 1647 - 1608 pattern
Short to 1550/1520/1490/1430 levels UP and ZIG ZAG from there to 1608+
Nov 6th - the presidential election - should reach the second shoulder levels
the BIG DROP should be around 8th/9th December in this scenario

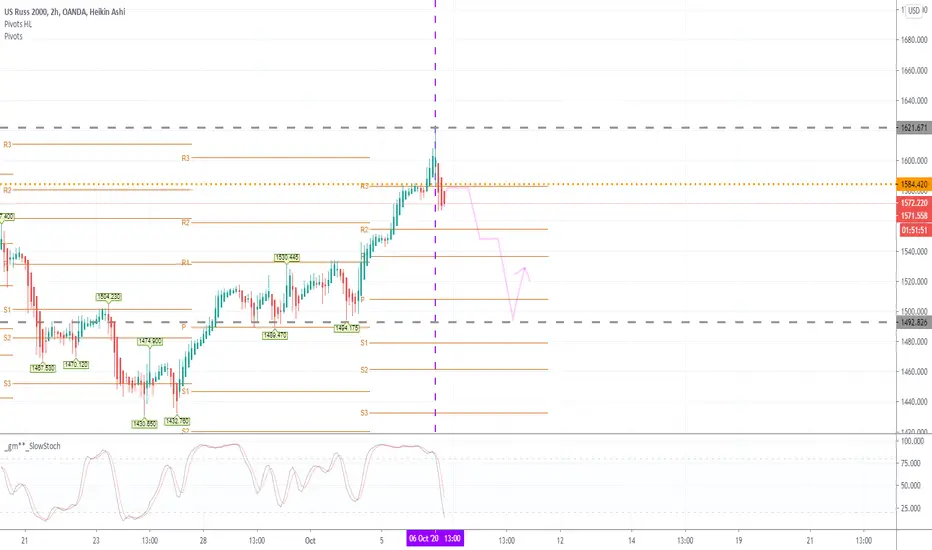
RUT 1620 TOP heading down to 1490 in H&S pattern next few days
1620 is local top on RUT
H&S pattern to 1490 levels
after that ZIG ZAG uptrend to 1620 levels
final crash after Nov 6th from 1620
SPX, NQ in similar pattern
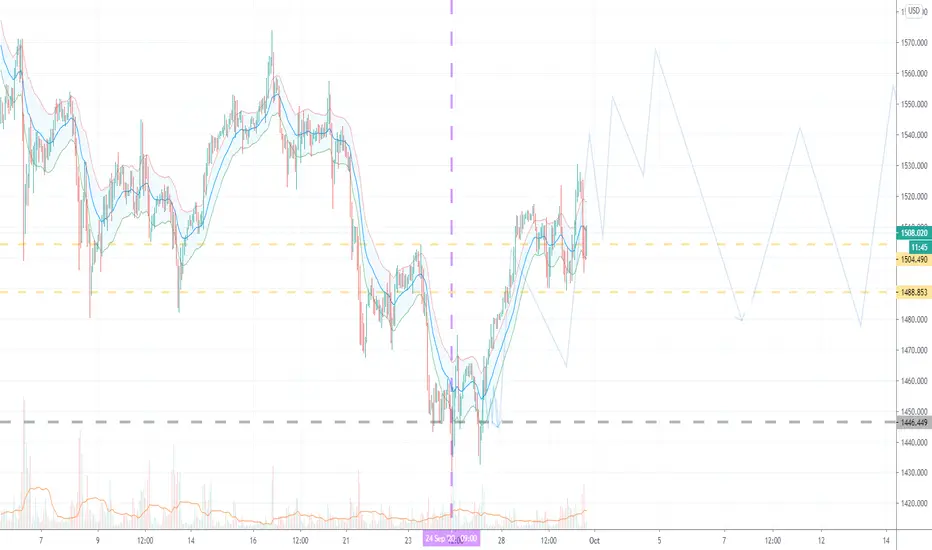
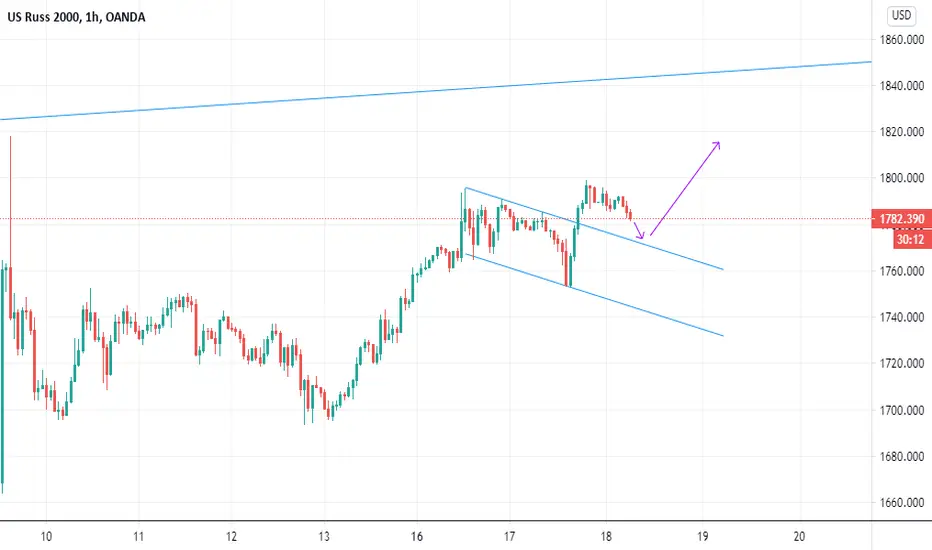
RUT up to 1550, 1570 next days AND than another bottom 1480
next days UP to 1550 and 1570
Oct 7th local BOTTOM 1480
long term UP /ZIG ZAG sideways/ to 1600 election day 6th November
SPX, NQ tracking a same pattern