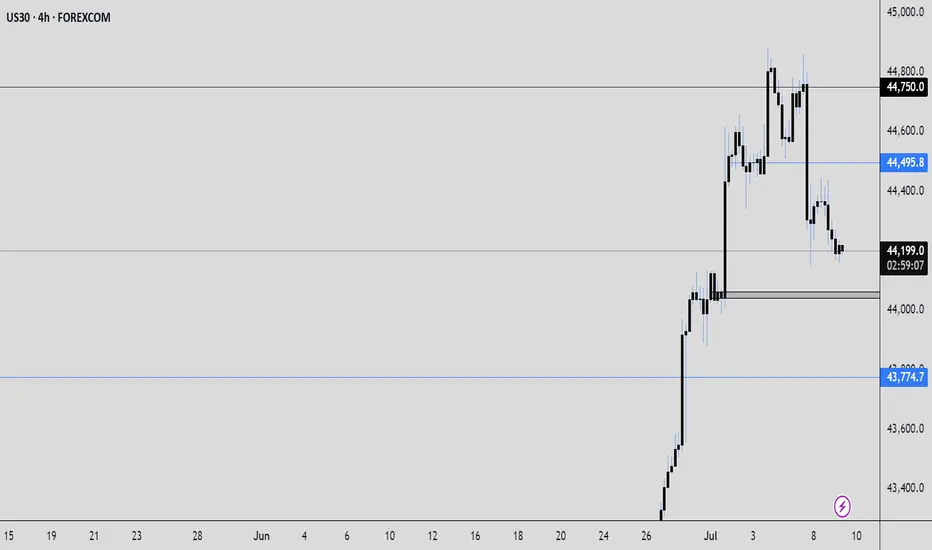
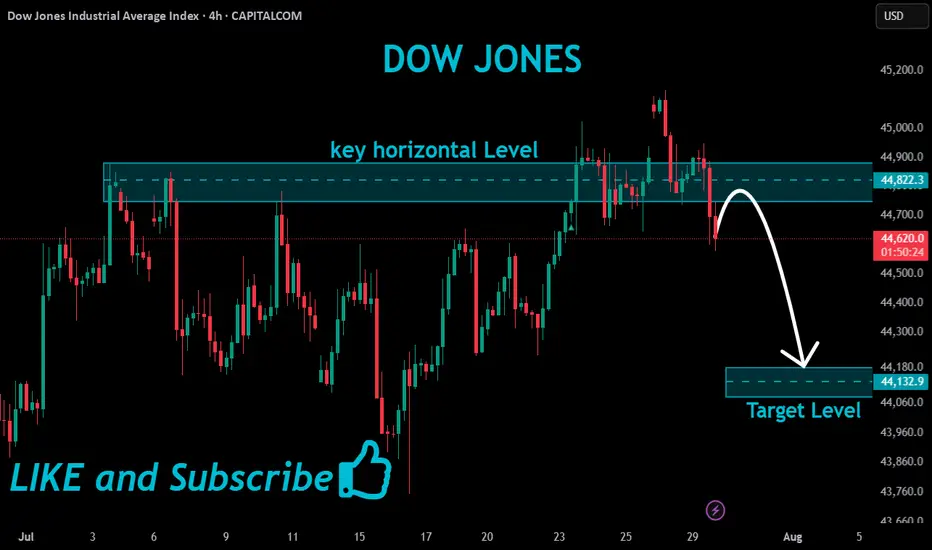
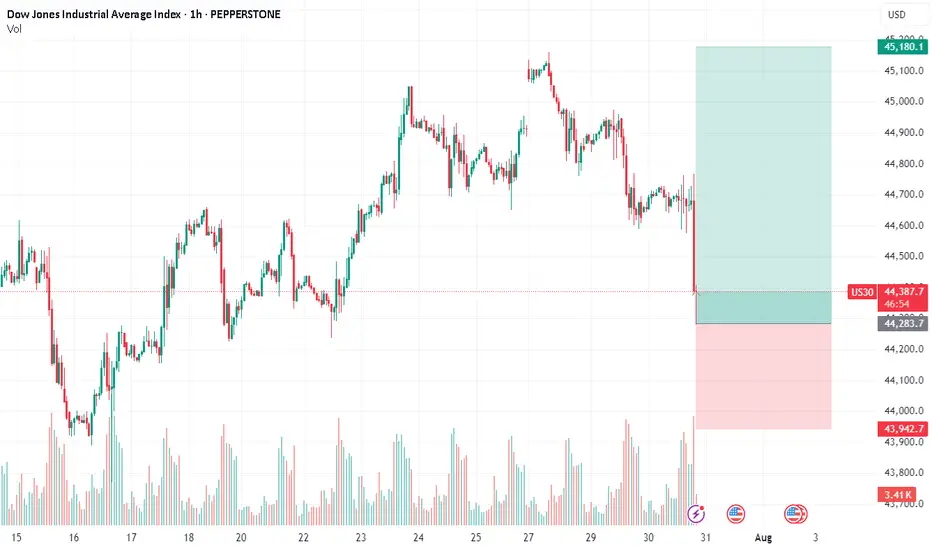
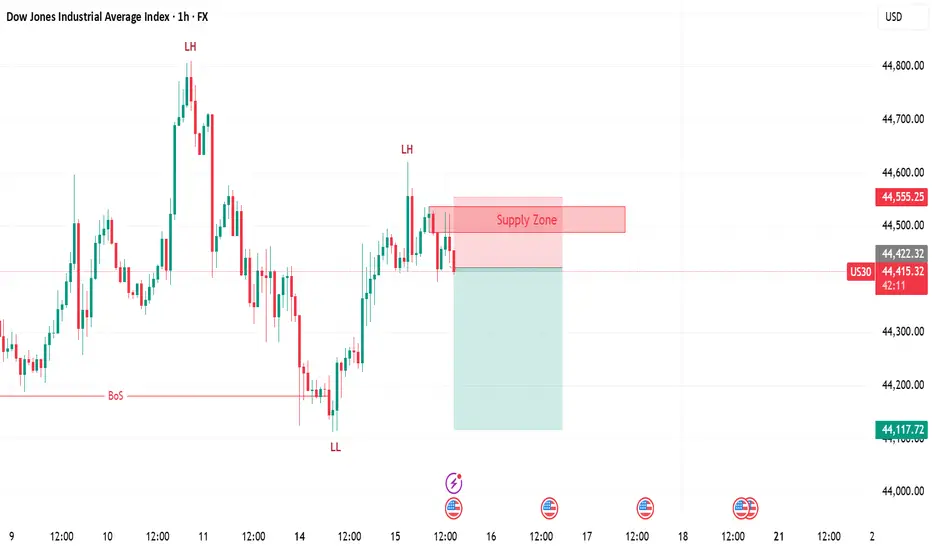
US30 Bearish Breakout!
HI,Traders !
#US30 made a bearish
Breakout of the key horizontal
Level of 44822.3which also
Seems to have been a neckline
Of the small H&S pattern so
We are locally bearish biased
And we will be expecting a
Further bearish move down !
Comment and subscribe to help us grow !
Us30analysis
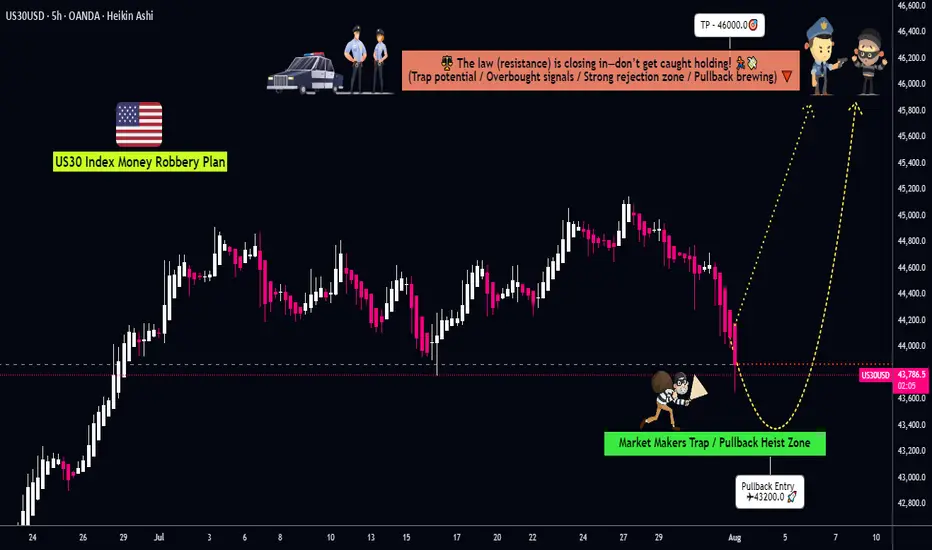
Dow Jones: Explosive US30 Trade Setup – Entry,Trap & Exit Mapped💎 Dow Jones Robbery Blueprint: The US30 Vault Crack Plan 💎
(Maximized for reach — within TradingView title limit)
🌟Hi! Hola! Ola! Bonjour! Hallo! Marhaba!🌟
Dear Market Robbers & Money Movers 🕵️♂️💰🚨
This ain't your average analysis — it’s a Thief Trader-style 🔥tactical mission🔥 aimed at the mighty "US30/DJI" (Dow Jones Industrial Average). We're talkin' about a precision heist with a full blueprint: entry zones, trap setups, and escape exits. Read carefully — this ain’t for the faint-hearted traders! 🧠🦾
🧠 Entry Zones (The Break-In) 📈
🛠 ENTRY 1: Candle wick near 44200.0 – that’s the resistance gate. Wait for confirmation.
🎯 ENTRY 2: Sneak in at the Market Makers’ Trap around 43200.00 – a dirty zone where retailers get baited. Perfect time to strike long!
🧱 DCA/Layering strategy recommended. Stack those buy orders like a thief layering explosives on a safe. 💣💸
🛑 Risk Levels (Escape Routes/Stop Loss)
🔊 "Listen up, vault raiders! Never drop your SL until breakout is confirmed. If you jump early, you might land in a bear trap! 🪤"
🔐 Stop Zones (Based on Strategy):
🔐 Max Risk SL (5H TF): If you're deep, your last stand is at 43000.0
☝️ SL depends on your position sizing, number of entries, and risk appetite. Trade like a thief, not a gambler.
🎯 Heist Target (Profit Exit)
🏁 Escape Point: 46000.0 — or exit before heat rises! Don’t be greedy. Rob and vanish. 💨💰
🔥 Market Mood: Why the Heist Is On
"US30/DJI" is bullish AF — thanks to:
📊 Macro-Economic Wind at Our Back
📈 Institutional momentum
📰 Strong sentiment and intermarket flows
Check your chart radar: Fundamentals + technicals aligning = green light for robbery! 🟢
⚠️ Tactical Reminder: News Can Jam the Plan
📵 Avoid new entries during major economic releases
🛡 Use trailing SLs to protect running trades
Stay alert, stay alive. 💡
❤️ Support the Robbery Crew
Hit that 💥BOOST💥 — your love fuels our next mission.
Join us and ride daily heist plans with Thief Trading Style 🏴☠️🚀💰
US30 Bullish Bias!
HI,Traders !
#US30 went down and
Retested a horizontal
Support of 43775.2 from
Where we are seeing a
Bullish rebound so as we
Are bullish biased and we
Will be expecting a further
Bullish move up !
Comment and subscribe to help us grow !

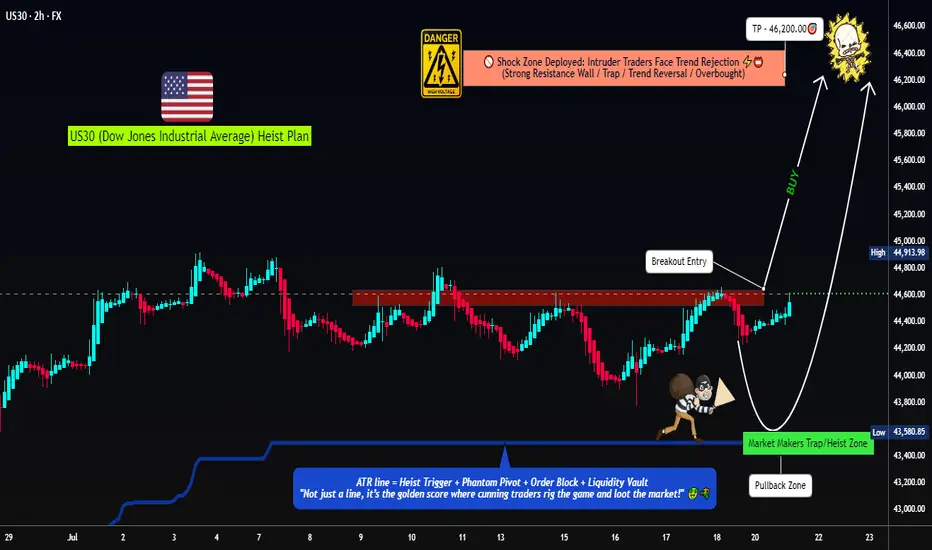
US30 Robbery Blueprint: Breakout, Pullback, Escape Setup💎 Dow Jones Robbery Blueprint: The US30 Vault Crack Plan 💎
(Maximized for reach — within TradingView title limit)
🌟Hi! Hola! Ola! Bonjour! Hallo! Marhaba!🌟
Dear Market Robbers & Money Movers 🕵️♂️💰🚨
This ain't your average analysis — it’s a Thief Trader-style 🔥tactical mission🔥 aimed at the mighty "US30/DJI" (Dow Jones Industrial Average). We're talkin' about a precision heist with a full blueprint: entry zones, trap setups, and escape exits. Read carefully — this ain’t for the faint-hearted traders! 🧠🦾
🧠 Entry Zones (The Break-In) 📈
🛠 ENTRY 1: Crack the wall near 44700.00 – that’s the resistance gate. Wait for confirmation.
🎯 ENTRY 2: Sneak in at the Market Makers’ Trap around 43500.00 – a dirty zone where retailers get baited. Perfect time to strike long!
🧱 DCA/Layering strategy recommended. Stack those buy orders like a thief layering explosives on a safe. 💣💸
🛑 Risk Levels (Escape Routes/Stop Loss)
🔊 "Listen up, vault raiders! Never drop your SL until breakout is confirmed. If you jump early, you might land in a bear trap! 🪤"
🔐 Stop Zones (Based on Strategy):
📌 Swing Buy SL (2H TF): Place at 44100.00 for the stealth buy.
🏦 Institutional SL (Swing Zone): Drop it around 43000.00
🔐 Max Risk SL (3H TF): If you're deep, your last stand is at 39200.00
☝️ SL depends on your position sizing, number of entries, and risk appetite. Trade like a thief, not a gambler.
🎯 Heist Target (Profit Exit)
🏁 Escape Point: 46200.00 — or exit before heat rises! Don’t be greedy. Rob and vanish. 💨💰
🔥 Market Mood: Why the Heist Is On
"US30/DJI" is bullish AF — thanks to:
📊 Macro-Economic Wind at Our Back
📈 Institutional momentum
📰 Strong sentiment and intermarket flows
Check your chart radar: Fundamentals + technicals aligning = green light for robbery! 🟢
⚠️ Tactical Reminder: News Can Jam the Plan
📵 Avoid new entries during major economic releases
🛡 Use trailing SLs to protect running trades
Stay alert, stay alive. 💡
❤️ Support the Robbery Crew
Hit that 💥BOOST💥 — your love fuels our next mission.
Join us and ride daily heist plans with Thief Trading Style 🏴☠️🚀💰
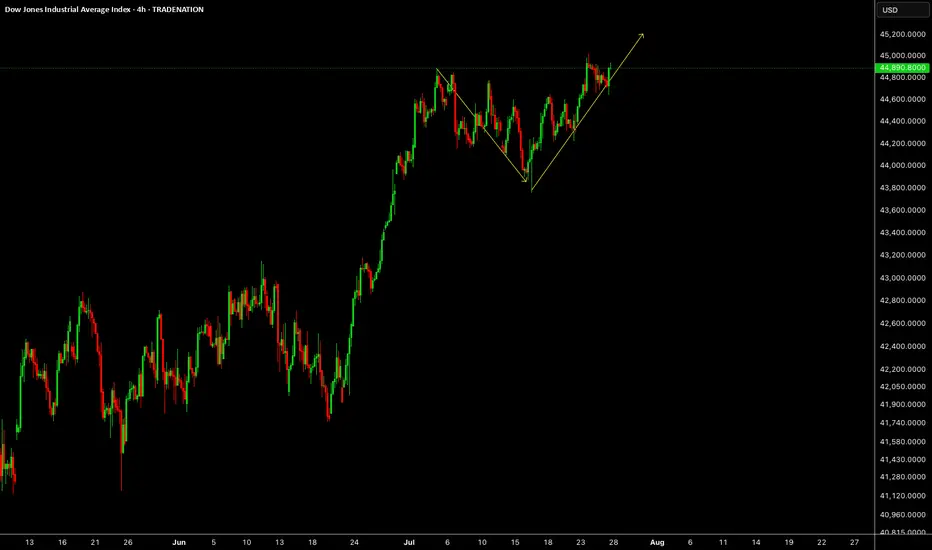
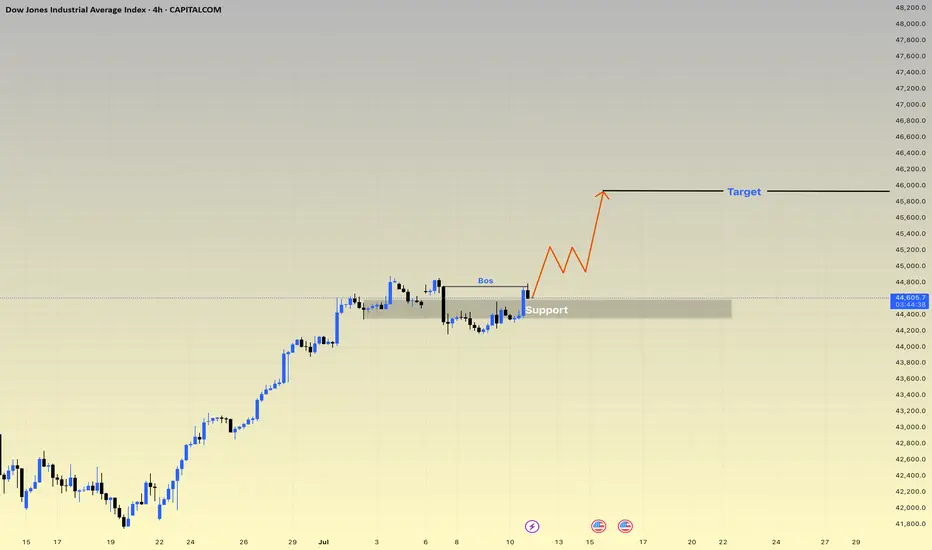
Dow Jones US30 Trend Analysis and Trade Plan Breakdown📈 US30 (Dow Jones) is currently in a strong bullish trend 🔥. This is clearly visible on the 4H chart, where we’re seeing a consistent pattern of higher highs and higher lows 🔼🔼.
👀 I’m watching for a potential long opportunity, especially since the higher timeframes remain firmly bullish 🟢.
🎥 In the video, we break it down:
A quick overview of the 4-hour structure
Then dive into a potential trade setup on the 30-minute chart ⏱️🔍
🧠 This is for educational purposes only and not financial advice ⚠️📚

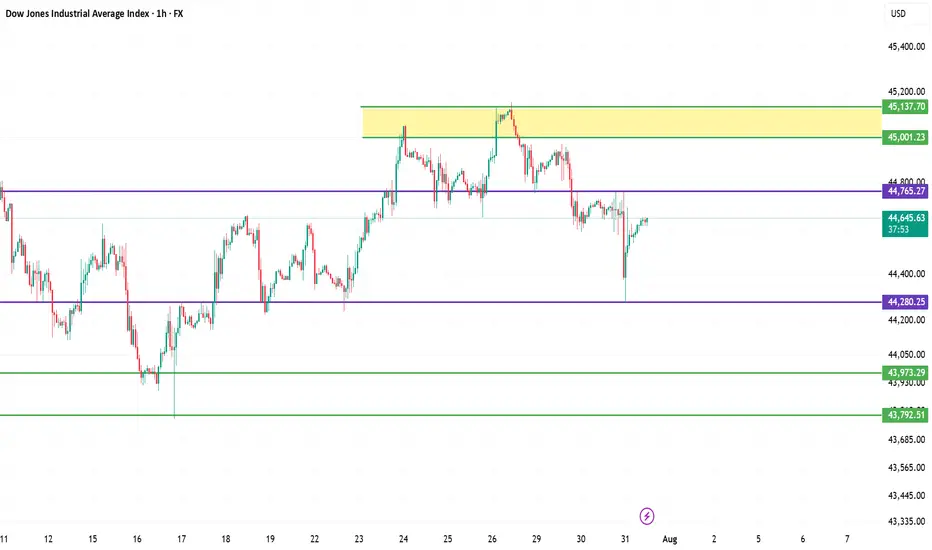
Dow Jones Industrial Average (DJI) – 1H Chart Analysis 1. Structure: Broad Range Consolidation
Price remains within a wide horizontal range between 45,137 resistance and 43,792 support. This shows indecision and distribution at highs.
2. Key Rejection Zone
The yellow zone around 45,001–45,137 acted as a strong supply area. Multiple rejections indicate heavy selling interest here.
3. Mid-Zone Compression
Current price is hovering just below 44,765 resistance — acting as a decision point. Break above it may retest the supply zone; rejection could send price lower.
4. Demand Holding at 44,280
The strong bounce from 44,280.25 shows buyers defending this demand zone. It's the key support to watch for bulls.
5. Next Play
Bullish: Break and hold above 44,765 targets 45,001–45,137.
Bearish: Failure leads to 44,280, then 43,973 → 43,792.
Neutral bias unless a clean breakout confirms direction.
DOW/US30 - PATIENCE IS THE KEYTeam, i expect the DOW/ NAS will be selling off due RATE unchange
i am going LONG now at 44335-44300 ranges
STOP LOSS at 44195
Target 1 at 44500-44550
Target 2 at 44600-44630
LETS GO
By the way, if you trade AUS200 today, both target hit on SHORT.
"We are going higher than 45,135.78The Dow Jones has the potential to start an upward move from the 44,811.77 and 44,732 levels, aiming for 45,135.78." CMCMARKETS:US30
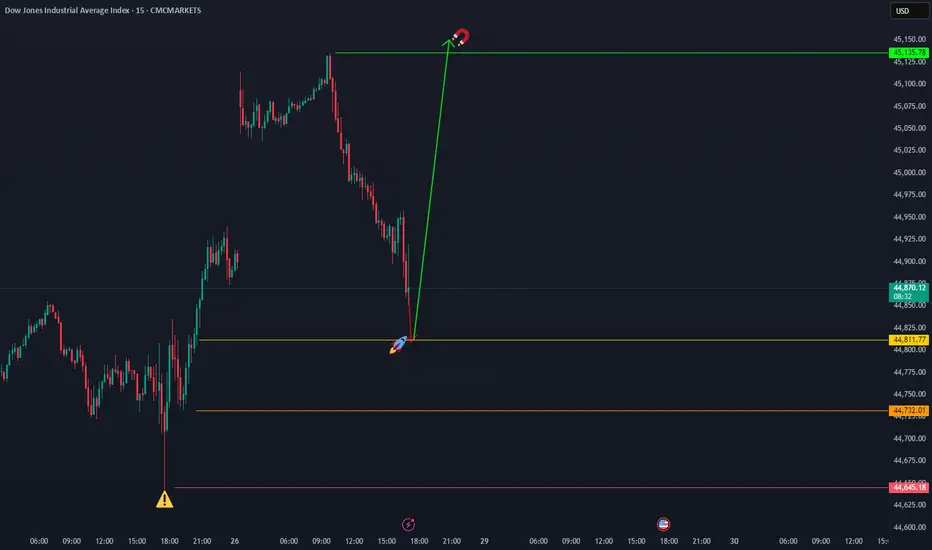
US30US30 needs some more upside short term towards 45.2K level.
Disclosure: We are part of Trade Nation's Influencer program and receive a monthly fee for using their TradingView charts in our analysis.
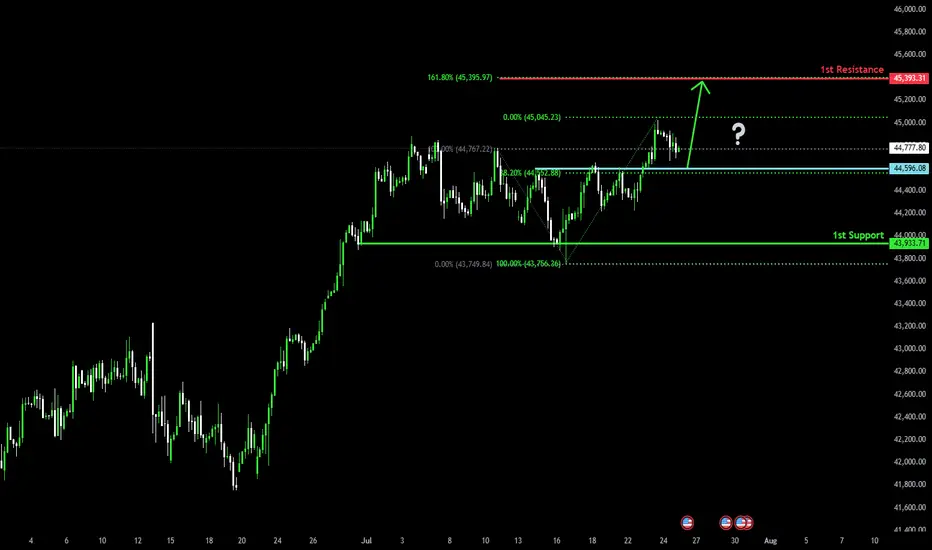
Bullish bounce off pullback support?Dow Jones (US30) is falling towards the pivot and could bounce to the 161.8% Fibonacci resistance.
Pivot: 44,596.08
1st Support: 43,933.71
1st Resistance: 45,393.31
Risk Warning:
Trading Forex and CFDs carries a high level of risk to your capital and you should only trade with money you can afford to lose. Trading Forex and CFDs may not be suitable for all investors, so please ensure that you fully understand the risks involved and seek independent advice if necessary.
Disclaimer:
The above opinions given constitute general market commentary, and do not constitute the opinion or advice of IC Markets or any form of personal or investment advice.
Any opinions, news, research, analyses, prices, other information, or links to third-party sites contained on this website are provided on an "as-is" basis, are intended only to be informative, is not an advice nor a recommendation, nor research, or a record of our trading prices, or an offer of, or solicitation for a transaction in any financial instrument and thus should not be treated as such. The information provided does not involve any specific investment objectives, financial situation and needs of any specific person who may receive it. Please be aware, that past performance is not a reliable indicator of future performance and/or results. Past Performance or Forward-looking scenarios based upon the reasonable beliefs of the third-party provider are not a guarantee of future performance. Actual results may differ materially from those anticipated in forward-looking or past performance statements. IC Markets makes no representation or warranty and assumes no liability as to the accuracy or completeness of the information provided, nor any loss arising from any investment based on a recommendation, forecast or any information supplied by any third-party.
US30 Massive Bullish Breakout!
HI,Traders !
#US30 is trading in a strong
Uptrend and the price just
Made a massive bullish
Breakout of the falling
Resistance line and the
Breakout is confirmed
So after a potential pullback
We will be expecting a
Further bullish continuation !
Comment and subscribe to help us grow !

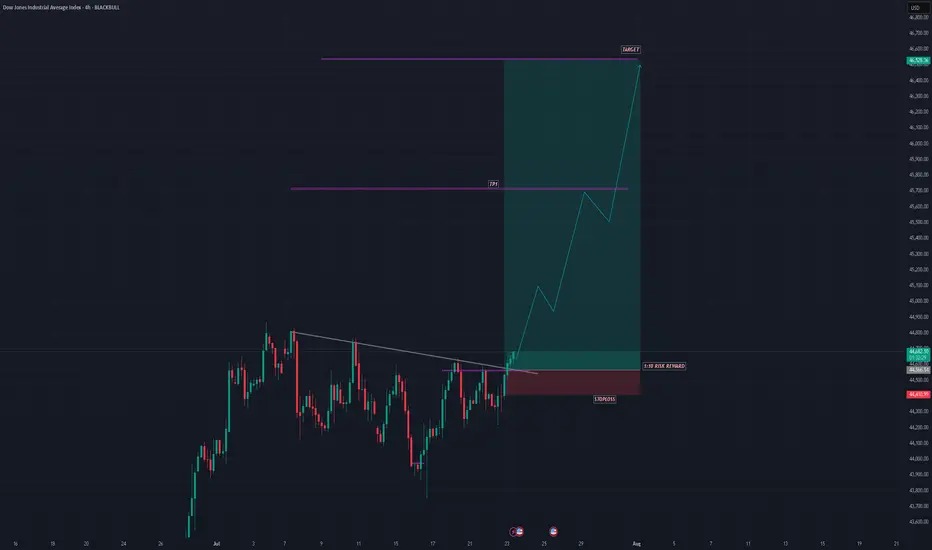
US30 SHOWING A GOOD UPWARD MOVE WITH 1:10 RISK REWARDUS30 SHOWING A GOOD UPWARD MOVE WITH 1:10 RISK REWARD
DUE TO THESE REASON
A. its following a rectangle pattern that stocked the market
which preventing the market to move any one direction now it trying to break the strong resistant lable
B. after the break of this rectangle it will boost the market potential for break
C. also its resisting from a strong neckline the neckline also got weeker ald the price is ready to break in the outer region
all of these reason are indicating the same thing its ready for breakout BREAKOUT trading are follows good risk reward
please dont use more than one percentage of your capital follow risk reward and tradeing rules
that will help you to to become a better trader
thank you
US30US30 needs some more correction, this week will be up and down both moves.
Disclosure: We are part of Trade Nation's Influencer program and receive a monthly fee for using their TradingView charts in our analysis.

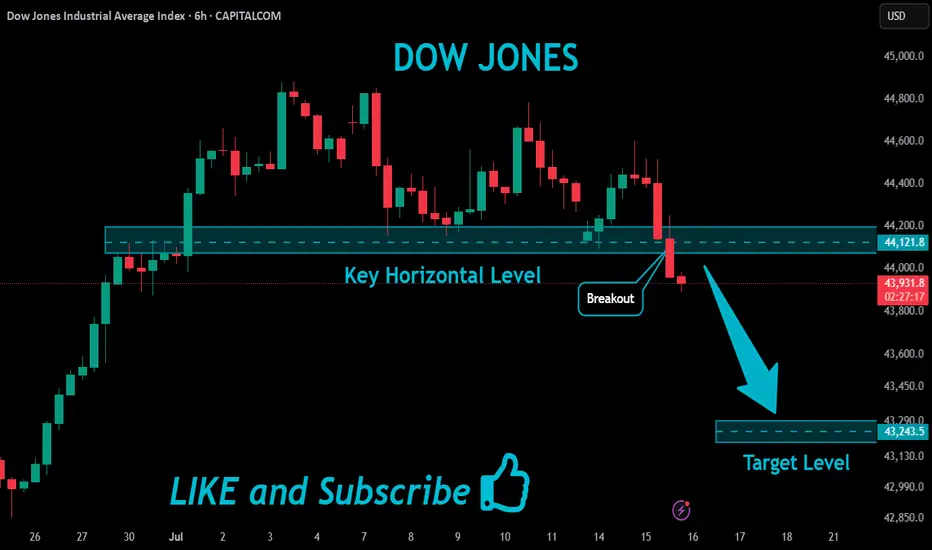
US30 Bearish Breakout!
HI,Traders !
#US30 index is trading in a strong downtrend,
and has broken through the key horizontal
level at 44121.8, reinforcing our bearish
outlook. We expect further declines !
Comment and subscribe to help us grow !
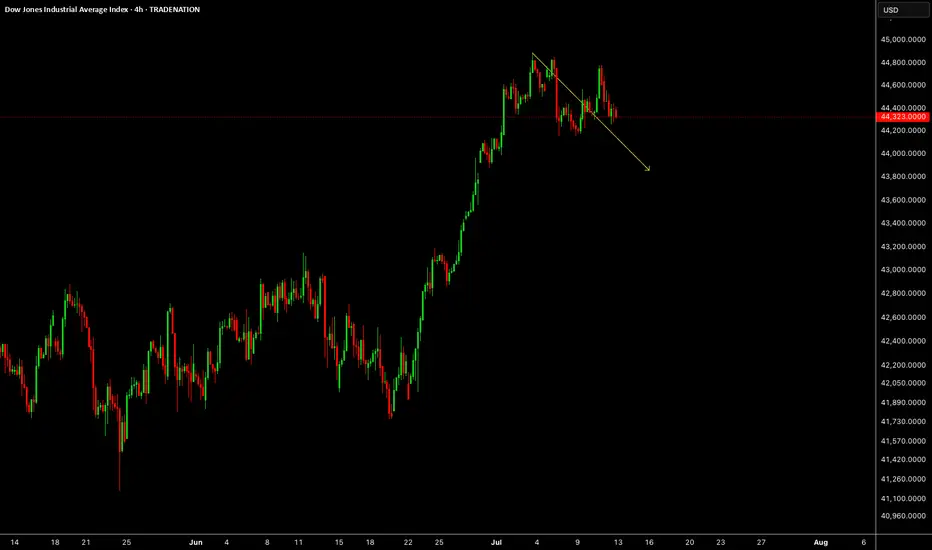
Dow Jones Industrial Average Index - 4 Hour Chart4-hour chart of the Dow Jones Industrial Average (US30) shows a recent price movement as of July 13, 2025. The index is currently at 44,315.0, reflecting a decline of 285.5 points (-0.64%). The chart highlights a sell signal at 44,312.0 and a buy signal at 44,318.0, with a shaded area indicating a potential downward trend from a recent peak. Key price levels include 44,855.7 (high) and 43,902.2 (low), with a support level around 44,315.0.
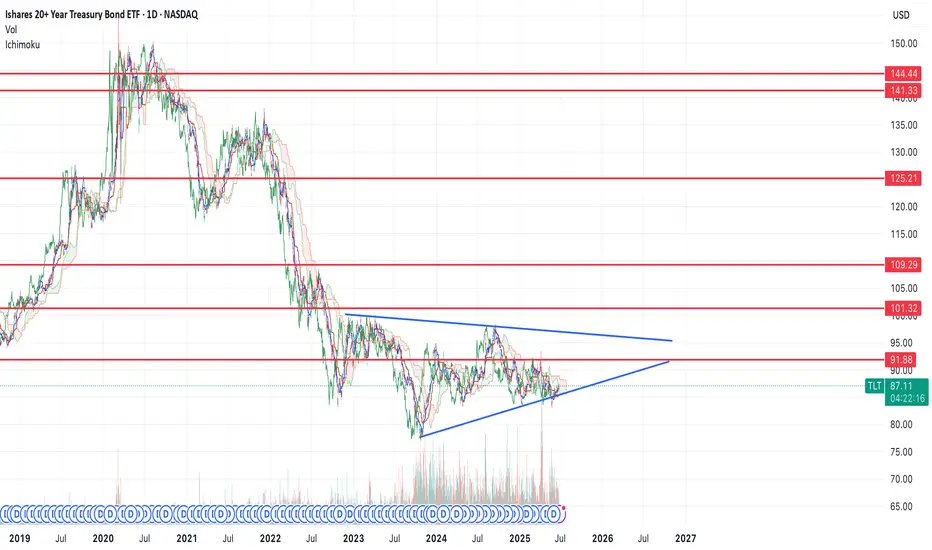
Bottom in for bonds, flight to safety trade coming soon $100+If we look at the chart of TLT, you can see that we're forming a bottoming reversal pattern.
We had a spike low down to $83 back to the middle of May and have now reclaimed the structure. I think that move marked the bottom.
I think it's very likely that bonds spike in the near future, if they can make it over the $92 resistance level, then I think price will see continuation and likely break the pattern finding the first resistance at that $101 level.
That said, I think this is the start of a larger move higher in bonds that will take us all the way up to the top resistance levels over the course of the next few years before the move is done and we start the long term trend in rates higher.
US30 | SELLConfirmation from 15 minute timeframe.
General trend in 1H is downward.
Trading with impulse.
US30US30 needs some more correction before we go bullish again.
Disclosure: We are part of Trade Nation's Influencer program and receive a monthly fee for using their TradingView charts in our analysis.
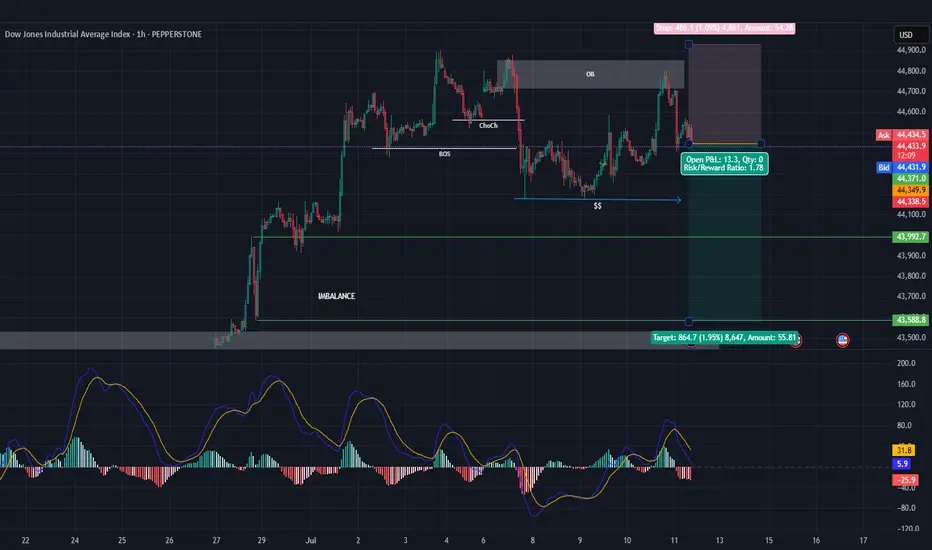
US30 - Short SellThe Dow Jones aka US30
* Overall trend is bullish
* Currently trading the retracement with the following points.
1. Valid OB
2. Liquidity to the sell side
3. Imbalance to the sell side
4. Price failed to break the previous HH activating the Bear positions, the question is How Deep The Retracement Will Be ? So we are closely monitoring the price action to adjust at any changes that the market might face.
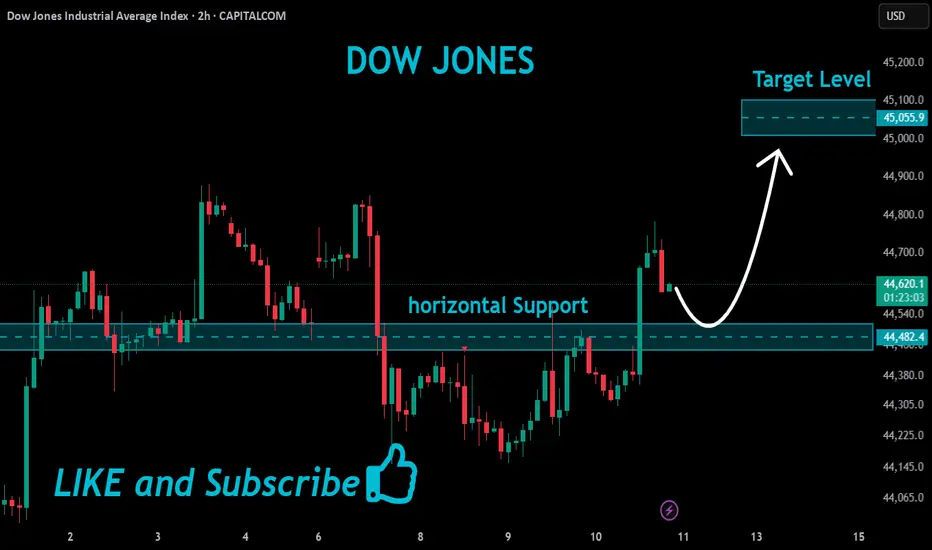
US30 Local Short!
HI,Traders !
US30 index is moving in a sideways
movement Over the medium term down
Again and will soon hit
A horizontal support
Of 44482.4 from where
We will be expecting a
Local bullish rebound !
Comment and subscribe to help us grow !
Us30 h4 next move Rejection near BoS
2. Break below support zone
3. Lower high formation
4. Bearish continuation towards 43,250
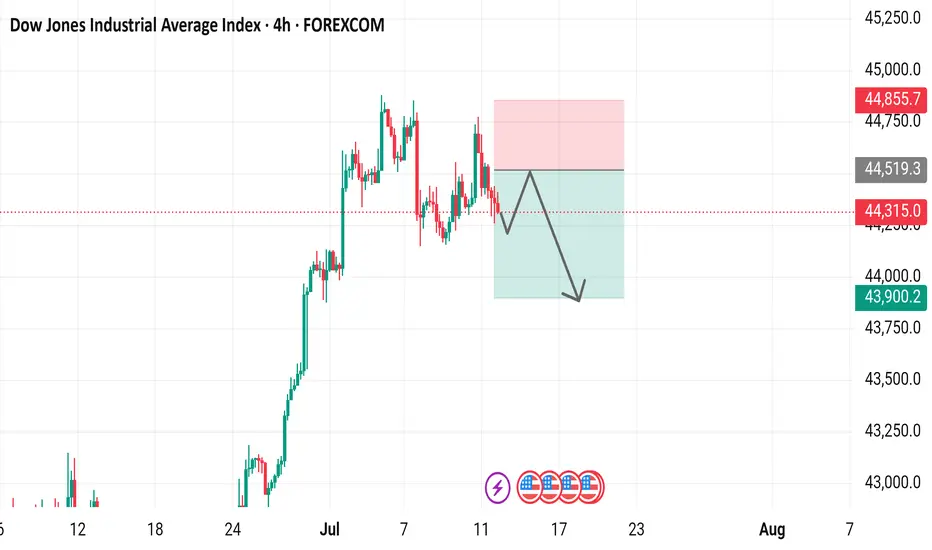
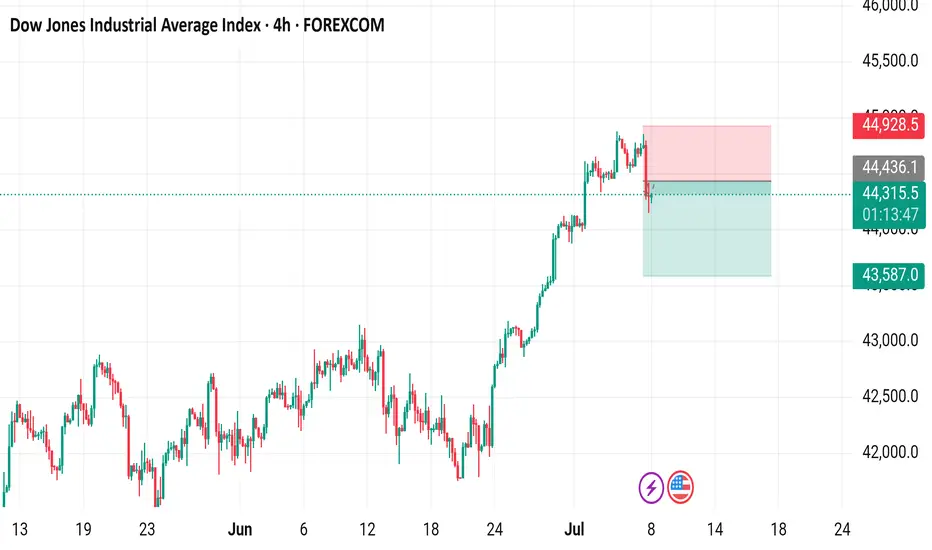
Dow Jones Industrial Average Index - 4h Chart (FOREXCOM)4-hour candlestick chart of the Dow Jones Industrial Average Index (US30) showing the price movement from late June to early July 2025. The current price is 44,314.0, with a slight increase of +23.0 (+0.05%). The chart includes buy and sell signals at 44,316.5 and 44,310.5 respectively, with highlighted resistance and support zones. The index has shown a general upward trend with some volatility over the period.
US30 short bias- 9th July 2025
I have conducted a comprehensive multi-timeframe analysis of the US30 index, with particular focus on its recent price action and structural context.
Quarterly Timeframe:
On the three-month timeframe, the second quarter’s candle close is notably bullish, having engulfed the previous ten quarterly candles. This significant engulfing pattern suggests strong underlying momentum. Importantly, there has not yet been a body closure above this quarterly candle, which indicates that price may attempt to break above its range to establish new all-time highs.
Recently, price action reached an all-time high near a major psychological level of 45,000 before retracing sharply to a liquidity region around 37,500. Since this retracement, there has been substantial accumulation of bullish orders, reinforcing the potential for price to retest and surpass prior highs.
Monthly Timeframe:
On the monthly timeframe, price has approached a key liquidity region around 44,500, where it is currently encountering resistance. While the higher timeframe bias remains firmly bullish, it is reasonable to expect healthy retracements before new all-time highs are made. It is worth noting that price has already broken above significant monthly levels at 41,750 and 42,600.
A retracement to these regions to collect further liquidity remains plausible, although this scenario is speculative rather than confirmed at present. Consequently, my bias on the monthly timeframe remains neutral in the short term, pending further developments.
Weekly Timeframe:
Price action on the weekly timeframe mirrors that of the monthly. There is little of note beyond the observation that price absorbed considerable bullish orders at 41,750 and has since encountered resistance near 44,750, leading to a modest retracement. Given this structure, I maintain a neutral outlook on the weekly timeframe.
Daily Timeframe:
On the daily chart, we can observe that the bullish momentum initiated from the 43,000 order block region faced resistance at approximately 44,500. Price briefly broke above this region on Thursday, 3rd July, but quickly closed below it on Monday, indicating a lack of sustained buying interest to propel price higher.
This retracement suggests that the market is searching for a deeper liquidity area to support its next upward move. Notably, a bearish three-pin formation is present, implying that price may break below the recent lows around 44,150. Accordingly, my bias for today is bearish.
4-Hour Timeframe:
In alignment with the daily bias, the 4-hour timeframe indicates that price is likely to target Monday’s low at approximately 44,155. The next key liquidity region lies around 44,000, where substantial bullish orders were previously filled. I am currently waiting for price to offer a suitable entry region to sell towards 44,000.
I am also mindful that the FOMC minutes are scheduled for release today, which could introduce significant volatility. Should a valid setup emerge, I will look to enter a short position. Specifically, if the current 4-hour candle closes bearish, I intend to consider shorts from around 44,220.
---
Disclaimer:
This analysis is for educational purposes only and does not constitute financial advice. Always conduct your own research and manage risk accordingly.