US30 Under Pressure: Possible Short Setup Brewing on the 4HI'm currently eyeing the US30 (Dow Jones Index) for a potential short opportunity based on multi-timeframe structure 📊.
🔍 Weekly Overview:
The weekly chart continues to show sustained pressure, with this week and last week both closing bearish. The sellers are clearly in control at the macro level. 🔻
📆 Daily & 4H Structure:
Drilling down to the daily and 4-hour charts, we can clearly see a break of structure (BOS). The 4H specifically is showing textbook signs of a bearish trend with lower highs and lower lows forming consecutively 🪜🔽.
🎯 Trade Plan:
I'm watching for a pullback into equilibrium, ideally near the 50% level of the recent Fibonacci range. If price revisits that zone, I’ll be looking for short confirmations to ride the momentum back toward the previous lows, as marked on the chart. 🧠💸.
Us30idea

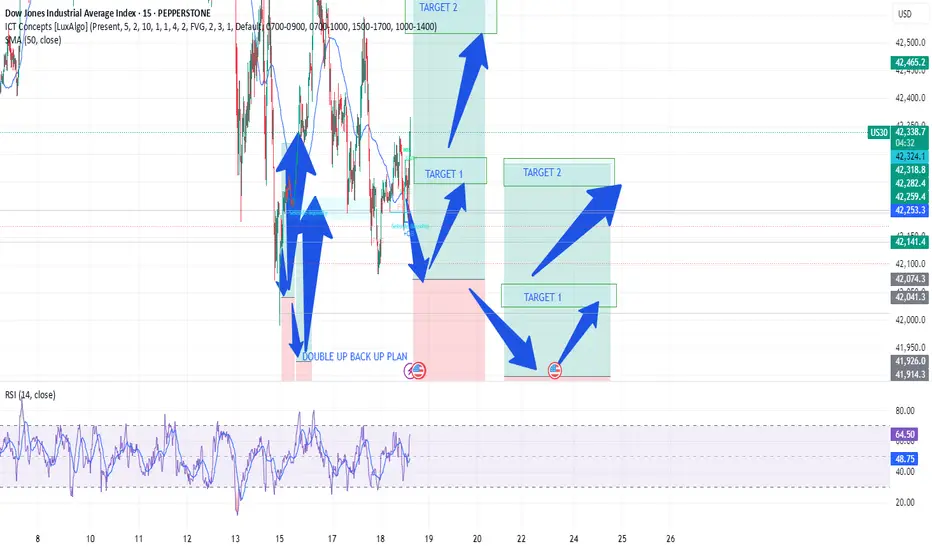
DOW30/US30 - ACTIVE TRADE - PROFITABLE SET UP TRADETeam,
today I have provide LIVE trading today provide you i did a good trade for
NAS100, DOW30 AND DAX30 - in real LIVE trading
OK, I prefer to SET UP my limit order today only. Remember, the market will be very volatile in the next 4 hours.
I expect the RATE should cut 25 points at least. Why
the employment data come out remain the same
inflation last week look under control
Retails is poorly come out today
The FED does not care about the America, they just care about taking advantage of America.
Lets now focus on the SETTING BUY LIMIT ORDER
I order small volume at 41975-42075
However I will double up at LIMIT BUY ORDER
The 1st target are looking at 4227542300
Target 2 - 42575-42675
REMEMBER - IF IT DOES NOT HIT YOUR ENTRY, JUST WALK AWAY.
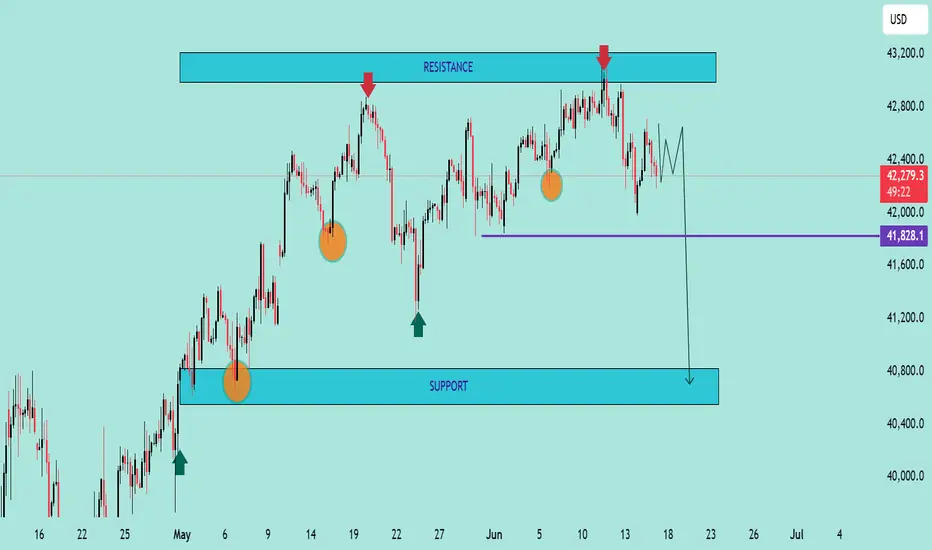
US30 – Bearish Setup Below Resistance Zone US30 – Bearish Setup Below Resistance Zone 🚨🟥
The US30 index is exhibiting signs of bearish momentum after repeated rejections from the key resistance zone near 43,200. Let's break down the technical picture:
🔍 Technical Analysis
📌 Resistance Zone (🟥 43,200 area)
Price was rejected twice from this resistance (marked by red arrows), showing strong seller presence.
Bearish candlesticks followed each touch, confirming exhaustion near this level.
📌 Support Zone (🟦 40,800 area)
The area around 40,800 has acted as a strong demand zone in the past (highlighted with green arrows and orange circles).
Price might revisit this area if current bearish structure continues.
📌 Intermediate Support (🟪 41,828)
This level serves as short-term support.
If broken, it could accelerate the decline toward the major support.
📌 Market Structure
Lower highs forming after each bounce indicate weakening bullish strength.
A potential bearish breakout pattern is forming (highlighted by the projected path).
📈 Conclusion & Trade Outlook
Bias: Bearish 📉
Trigger: Break below 41,828 support
Target: 40,800 zone
Invalidation: Break and close above 43,200 resistance
DOW/US30 - TIME FOR RECOVER DURING UK MARKET OPENINGTeam, very sad day to see Israel missle flying
We can only hope the world in peace
We are now finding opportunity to entry LONG DOW/US30
Please set your target 1 and 2 ranges
Make sure take 50-70% at first target and bring stop loss to BE
then second target
Please review the chart carefully and pricing target
Good luck.
US30 Analysis: Liquidity Dip or Deeper Correction?📉 US30 (Dow Jones) Trade Idea 📉
Currently analysing US30 – the Dow Jones Index 🏛️, and there are some key developments worth noting…
On the 4-hour timeframe, we’re observing a clear shift in market structure, with price breaking through previous lows ⚠️. This raises two possibilities:
🔹 It could be a liquidity grab before a rally 🚀
🔹 Or, it may be the beginning of a deeper end-of-week sell-off targeting levels below 🔻
At this stage, I’m watching for a potential counter-trend short position — but only if the conditions outlined in the video are met with precision 🎯.
🧠 As always, it’s about waiting for confirmation, not jumping in early. Disciplined execution is key. 🧩💼
⚠️ Disclaimer: This is not financial advice. The information provided is for educational purposes only. Always do your own analysis and manage risk accordingly.

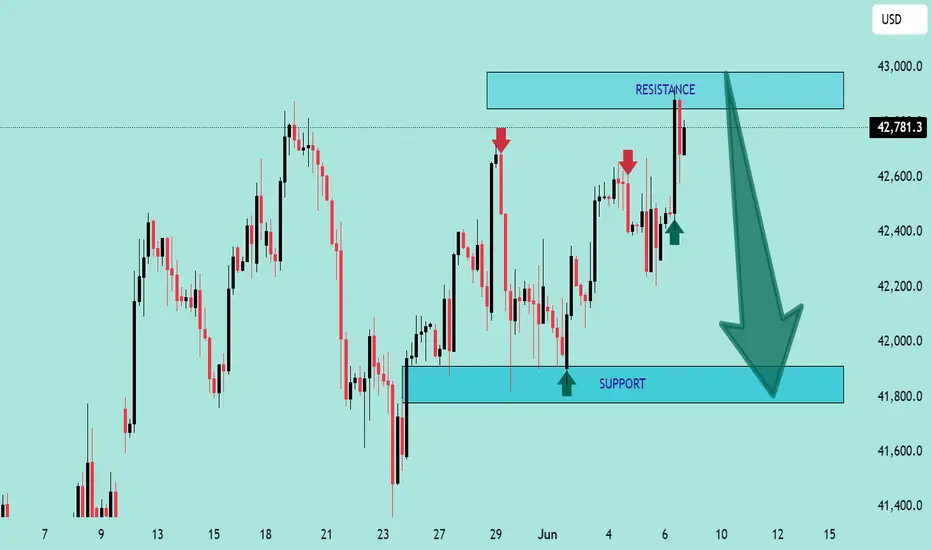
US30 Technical Analysis – 8th June 2025c US30 Technical Analysis – 8th June 2025
🔍 Chart Overview:
The chart shows a classic range-bound structure with clearly defined support and resistance zones.
📍 Key Zones:
🔼 Resistance Zone: ~$42,900 – $43,000
Marked by multiple rejections (🔴 red arrows).
Price has failed to close above this area convincingly.
Sellers are actively defending this level.
⚠️ Bearish pressure likely to increase if price stays below this level.
🔽 Support Zone: ~$41,750 – $41,850
Marked by strong bullish reactions (🟢 green arrows).
Buyers have stepped in consistently in this demand zone.
A breakdown below this level could trigger further downside momentum.
📈 Current Price Action:
The price is hovering around $42,781.3, just below the resistance zone.
The latest candlestick shows rejection from the top, forming a bearish wick, indicating potential reversal pressure.
The large downward arrow (⬇️) on the chart suggests a bearish bias is expected by the analyst.
📉 Outlook & Strategy:
🔻 Bearish Scenario (High Probability):
If price fails to break and sustain above $43,000, expect a move back down towards the support zone at ~$41,800.
A breakdown below support could lead to deeper downside, targeting $41,500 or lower.
🛑 Invalidation:
A clean breakout and daily close above $43,000 would invalidate the bearish setup and suggest potential continuation higher.
🎯 Trading Tips:
🔹 Short Bias: Look for short entries near resistance with tight stops above $43,000.
🔹 Target: $42,200 → $41,800
🔹 Risk Management: Always maintain a good risk-to-reward ratio and use proper stop-loss.
📌 Conclusion:
⚠️ The chart favors a bearish reversal from resistance unless bulls can push decisively above $43,000. Traders should watch for rejection patterns or breakdown confirmations to align with the bearish move
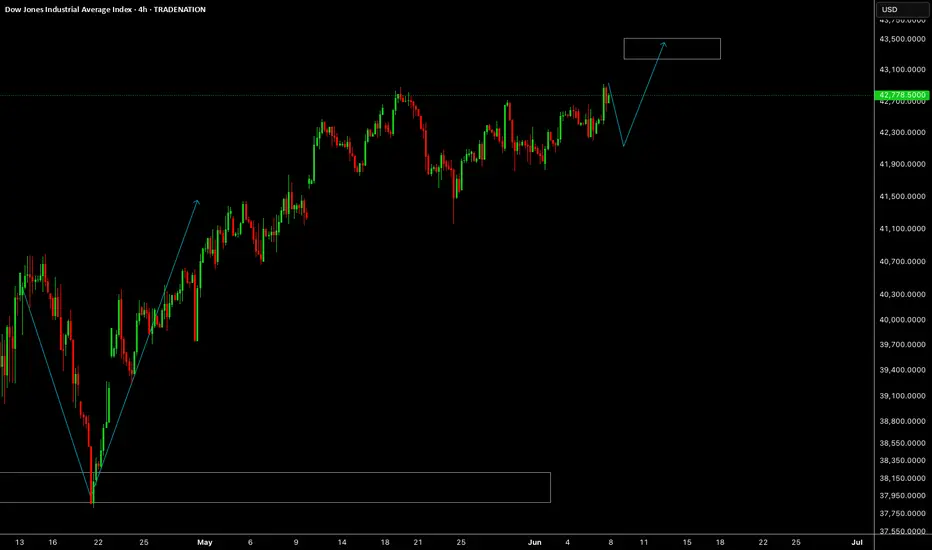
US30US30 getting ready for another push up towards 43.5K.
Disclosure: We are part of Trade Nation's Influencer program and receive a monthly fee for using their TradingView charts in our analysis.
US30 Bearish Rejection at Resistance – Potential Drop Ahead📉 US30 Bearish Rejection at Resistance – Potential Drop Ahead 🚨
The US30 (Dow Jones Industrial Average) is exhibiting signs of bearish weakness after rejecting a strong resistance zone around 42,898.9 - 43,800.8. Here's a breakdown of the current market structure and outlook:
🔍 Technical Analysis
📌 Resistance Zone (Sell Pressure)
Price has failed to break above the marked resistance area multiple times.
Strong wicks and rejections indicate seller dominance near the top.
A short-term bounce into the resistance is anticipated before a likely reversal.
📌 Support Zone (Buy Interest)
The key support is at 39,396.2 - 39,585.5.
This zone has previously served as a strong demand area, with multiple bullish reversals in the past.
📌 Bearish Projection Path
Chart shows a potential rejection pattern playing out.
Price is expected to retest the resistance, then decline towards the support zone.
Intermediate support levels:
41,225.0
40,630.2
🔄 Outlook
🛑 Scenario A (Likely):
Price tests the upper resistance again and forms a double top or shooting star before declining toward the 39.5k support zone.
✅ Scenario B (Invalidation):
If price closes above 43,800 with strong volume, bearish bias will be invalidated, and a bullish continuation can be expected.
🧭 Trade Idea (Not Financial Advice)
🔹 Entry: Short near 42,800–43,000 (after confirmation)
🔹 Target 1: 41,225
🔹 Target 2: 40,630
🔹 Final Target: 39,585
🔹 Stop Loss: Above 43,800
Conclusion:
⚠️ The chart indicates a high-probability short setup unless bulls manage a strong breakout above resistance. Eyes on the price action near resistance for confirmation. 📉📊

"US30/DJI" Index Market Bullish Robbery (Swing Trade Plan)🌟Hi! Hola! Ola! Bonjour! Hallo! Marhaba!🌟
Dear Money Makers & Robbers, 🤑 💰💸✈️
Based on 🔥Thief Trading style technical and fundamental analysis🔥, here is our master plan to heist the "US30/DJI" Index Market Heist. Please adhere to the strategy I've outlined in the chart, which emphasizes long entry. Our aim is to escape near the high-risk YELLOW MA Zone. It's a Risky level, overbought market, consolidation, trend reversal, trap at the level where traders and bearish robbers are stronger. 🏆💸"Take profit and treat yourself, traders. You deserve it!💪🏆🎉
Entry 📈 : "The vault is wide open! Swipe the Bullish loot at any price - the heist is on!
however I advise to Place buy limit orders within a 15 or 30 minute timeframe most recent or swing, low or high level. I Highly recommended you to put alert in your chart.
Stop Loss 🛑:
Thief SL placed at the Nearest / Swing low level Using the 3H timeframe (39200) Day/Swing trade basis.
SL is based on your risk of the trade, lot size and how many multiple orders you have to take.
🏴☠️Target 🎯: 42400
💰💵💸"US30/DJI" Index Money Heist Plan is currently experiencing a bullishness,., driven by several key factors. .☝☝☝
📰🗞️Get & Read the Fundamental, Macro Economics, COT Report, Geopolitical and News Analysis, Sentimental Outlook, Intermarket Analysis, Index-Specific Analysis, Future trend targets with Overall outlook score... go ahead to check 👉👉👉🔗🔗🌎🌏🗺
⚠️Trading Alert : News Releases and Position Management 📰🗞️🚫🚏
As a reminder, news releases can have a significant impact on market prices and volatility. To minimize potential losses and protect your running positions,
we recommend the following:
Avoid taking new trades during news releases
Use trailing stop-loss orders to protect your running positions and lock in profits
💖Supporting our robbery plan 💥Hit the Boost Button💥 will enable us to effortlessly make and steal money 💰💵. Boost the strength of our robbery team. Every day in this market make money with ease by using the Thief Trading Style.🏆💪🤝❤️🎉🚀
I'll see you soon with another heist plan, so stay tuned 🤑🐱👤🤗🤩
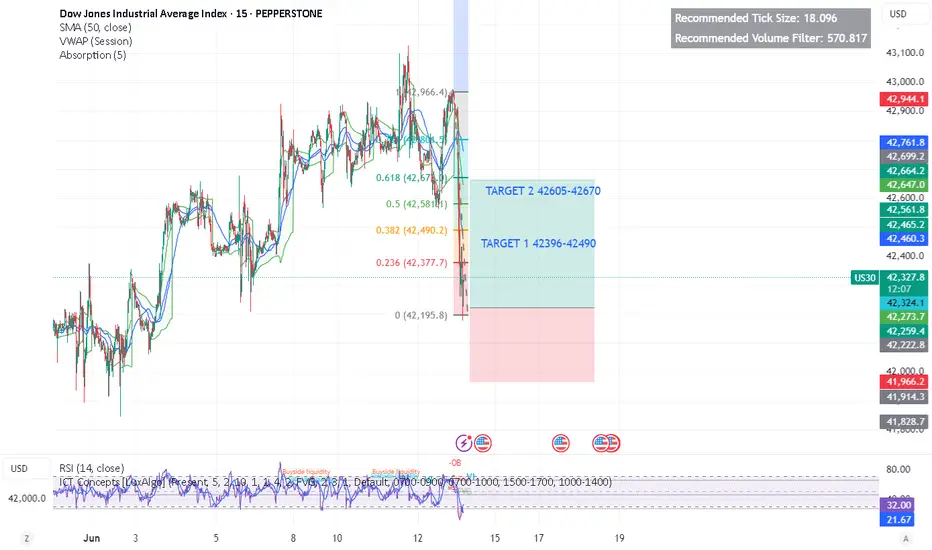
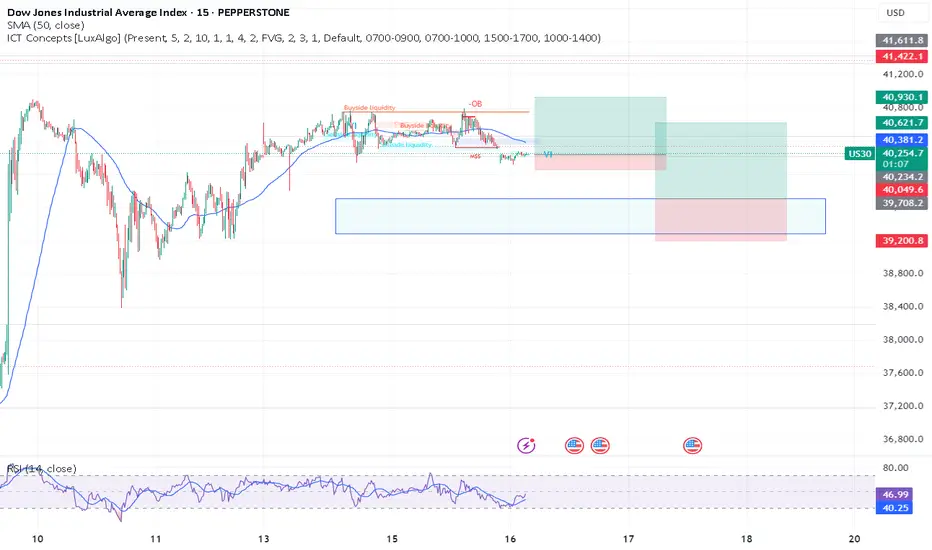
Dow Jones Short Term Sell Trading PlanM15 - Strong bearish momentum
Lower lows on the moving averages of the MACD indicator.
Until the two Fibonacci resistance zones hold I expect the price to continue lower further.
If you enjoy this idea, don’t forget to LIKE 👍, FOLLOW ✅, SHARE 🙌, and COMMENT ✍! Drop your thoughts and charts below to keep the discussion going. Your support helps keep this content free and reach more people! 🚀
--------------------------------------------------------------------------------------------------------------------
Disclosure: I am part of Trade Nation's Influencer program and receive a monthly fee for using their TradingView charts in my analysis.

US30 Locked & Loaded – Get In, Get Profit, Get Out!**💰 Market Heist Alert: US30 Setup 🔥**
Yo Money Raiders & Chart Bandits! 🏴☠️📈
US30 is ripe for the taking, and we’re rollin’ in with the *Thief Trading Style*—a slick mix of sniper-level technicals and street-smart fundamentals. Whether it’s bull or bear, we strike fast, grab profit, and vanish! 💨💸
---
**🧠 The Blueprint – US30 Hit Plan**
**📍 Entry Zones:**
🔹 **Bullish Strike 1**: Look for a pullback and **buy at 42400** – clean signal to enter the action!
🔹 **Bullish Strike 2**: Set your sights on **40900 - 40800**, inside the Institutional Buy Zone. Wait for an MA pullback, then hit it hard. Fortune favors the bold! ⚔️
🔹 **Bearish Ambush**: If price breaks down below **41600**, it’s time to ride that bear wave 🐻💨
💡 **Pro Bandit Tip**: Set alerts on key levels so you never miss the moment! 🔔
---
**🛑 Stop Loss Defense:**
Protect the stash! Use the **nearest 4H low** as your SL for day/swing trades.
Tweak based on your risk level, lot size, and open positions. 🛡️
---
**🎯 Profit Targets – Take the Loot:**
💥 **Bullish Goal**: Lock in at **44200** – or escape early if momentum cools 😎
💥 **Bearish Goal**: Target **40600** – but don’t overstay if signs reverse 🚪
🚨 Watch out for overbought/oversold traps – this is where many fall.
---
**⚠️ Risk Alert – News Incoming!**
News events = wild moves. Handle with care:
📰 Avoid new entries during major news drops
📉 Use **trailing SL** to secure profits and manage risk like a pro
Stay smart. Stay ready. This is a heist, not a gamble! 💼💣
---
**🚀 Boost the Thief Trading Movement!**
If this setup hits your style, smash that **boost** and show love to the Thief Crew! 💪
We raid charts daily with precision, profit, and a bit of outlaw swagger. Let’s own the US30 together! 🤝💵
Stay sharp, alerts on, and eyes wide—more setups coming soon.
Catch you in the green, bandits! 🤑🎉📊
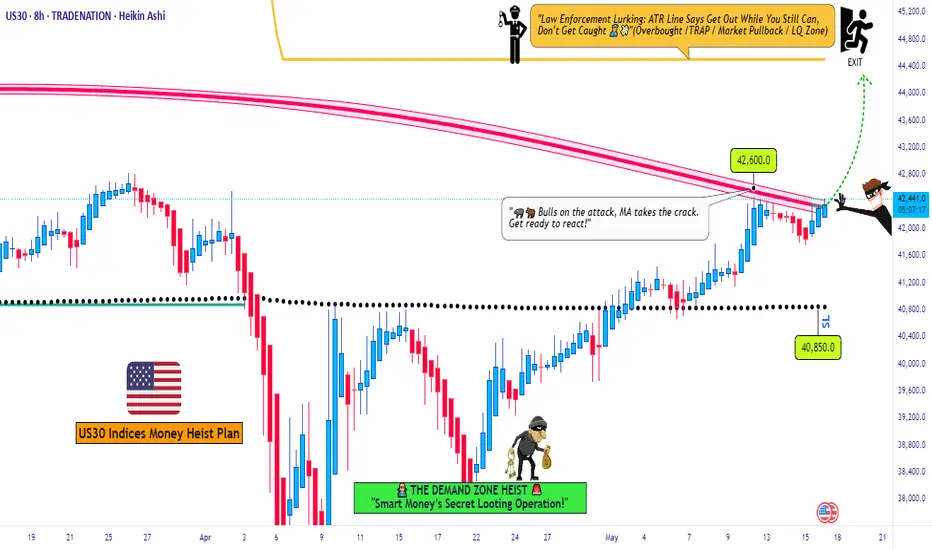
"US30 Heist Alert: Thief Style's Bullish Plan to Steal Profits!"🌟 Salut! Ciao! Hola! Konnichiwa! 🌟
Dear Wealth Raiders & Market Bandits, 🤑💰✈️
Here’s our slick *Thief Trading Style* heist plan for the **US30 / Dow Jones Industrial Average Cash** Index, crafted with sharp technicals and fundamentals. 💥 Stick to the chart’s long entry strategy and aim to slip out near the spicy Yellow ATR Zone—a risky, overbought level where bears and traps lurk. 🏆💸 *Grab profits and treat yourself, you’ve earned it!* 💪🎉
**Entry 📈**: The heist kicks off! Watch for a breakout above the MA line (42600.0) to jump in—bullish riches await! 🤑 Set *buy stop orders* above the MA or *buy limit orders* near the most recent 15/30-min swing low/high for pullback entries. 🚨 Set an *alert* to catch the breakout signal!
**Stop Loss 🛑**: Yo, thieves, listen up! 🗣️ For buy stop orders, hold off on placing that stop loss until the breakout confirms. 🔊 Place it at the 8H recent/swing low (40850.0) for day/swing trades. Adjust SL based on your risk, lot size, and number of orders. Play it smart, or it’s your loot on the line! ⚠️🔥
**Target 🎯**: Aim for 44500.0 or bail before the target hits. 🏴☠️
**Scalpers, eyes here 👀**: Stick to long-side scalps. Big bankrolls can dive in; smaller ones, join the swing trade heist. Use *trailing SL* to lock in your haul. 💰
💸 **US30 Market Heist Outlook**: The index is neutral but leaning bullish, fueled by key drivers. ☝ Check the fundamentals, macroeconomics, COT reports, geopolitics, sentiment, intermarket analysis, and future trend targets for the full score. 🌎🔗
⚠️ **Trading Alert: News & Position Management** 📰🚫
News can shake the market hard. To protect your loot:
- Skip new trades during news releases.
- Use trailing stop-loss orders to secure running profits.
💖 Boost our heist plan! 🚀 Hit that *Boost Button* to power up our robbery squad. With *Thief Trading Style*, we’re snatching profits daily. 🏆🤝 Stay sharp for the next heist plan! 🤑🐱👤🤩
---
### Latest Real-Time Data (UTC+1, May 16, 2025) 📊
*Data sourced from reliable platforms like Financial Juice and official market feeds.*
**Indices** 📈
- US30 (Dow Jones): 42580.0 | +0.18% 😊
- S&P 500: 5720.5 | +0.12% 😄
- NASDAQ 100: 20150.2 | +0.25% 😊
- FTSE 100: 8250.3 | -0.05% 😐
---
### Latest COT Data (Updated Friday, May 9, 2025) 📑
*Commitment of Traders (COT) report for US30/Dow Jones futures, sourced from CFTC.*
- **Non-Commercial (Speculators)**:
- Long: 45,200 contracts | +2,500 😄
- Short: 38,900 contracts | -1,200 😊
- Net Position: +6,300 (Bullish bias) 🟢
- **Commercial (Hedgers)**:
- Long: 82,500 contracts | -1,000 😐
- Short: 90,700 contracts | +800 😐
- Net Position: -8,200 (Bearish hedge) 🔴
- **Open Interest**: 165,400 contracts | +1,200 😊
- **Key Insight**: Speculators are increasing bullish bets, while hedgers lean bearish, signaling potential volatility near resistance levels like the Yellow ATR Zone. ⚠️
---
💥 Join the *Thief Trading* crew, boost the plan, and let’s raid the markets together! 🤑🚀
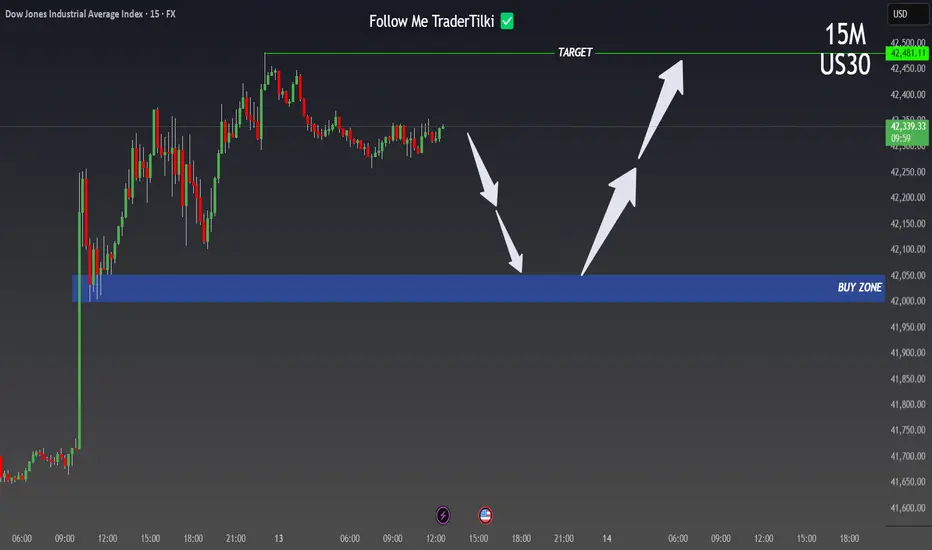
US30 | 15M | BUY ZONEHey There,
After reaching my US30 buy level, my target is 42,481,00
Your likes keep me motivated to share my analyses, and I truly appreciate the support.
Big thanks to everyone showing love
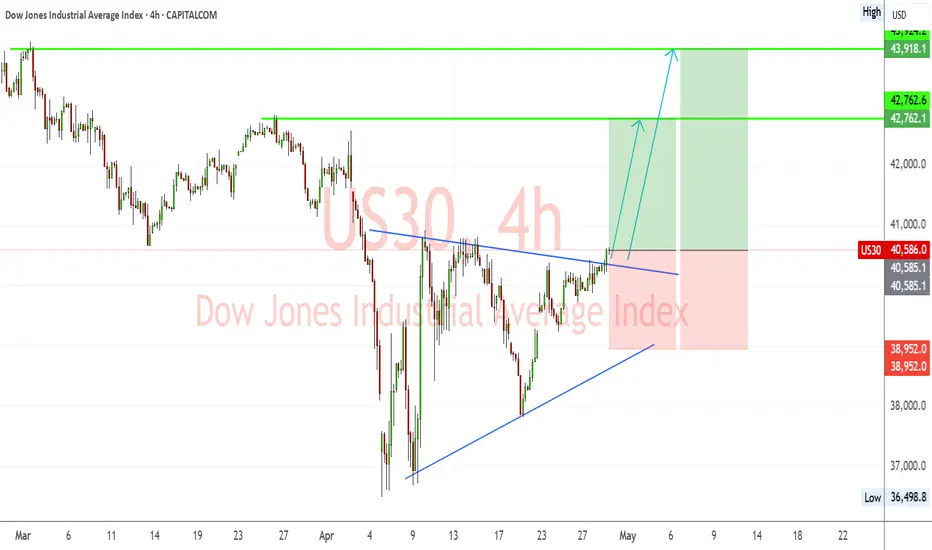
US30 Breakout from Symmetrical Triangle – Bullish Targets EyedUS30 (Dow Jones) has successfully broken out of a symmetrical triangle consolidation pattern, signaling a shift toward bullish momentum. The breakout is occurring after a strong recovery from April lows, with higher lows supporting upward price pressure.
🔹 Chart Structure:
Symmetrical triangle with a clean breakout above descending resistance.
Series of higher lows indicating accumulation.
Bullish breakout confirmed with price pushing above the 40,580 zone.
🔑 Key Levels:
Current Price: 40,586
Breakout Confirmation Level: 40,580
Immediate Resistance/TP1: 42,762
Major Resistance/TP2: 43,924
Support Zone: 38,950
Invalidation/Stop Level: Below 38,950
✅ Bullish Confluence Factors:
Breakout of symmetrical triangle pattern
Higher lows indicate bullish strength and accumulation
Momentum shift visible on lower timeframes
Positive correlation with improving US equity market sentiment
Anticipation of dovish Fed tone could boost equities
🧠 Fundamental Context:
Market is cautiously optimistic ahead of FOMC this week; dovish stance expected due to recent soft economic indicators.
Earnings season tailwinds and lower bond yields support index gains.
Ongoing political and tariff-related headlines may cause volatility, but technical breakout remains in focus.
💡 Trade Idea:
Bias: Bullish
Entry: On successful retest of 40,580 or continuation above 40,600
TP1: 42,762
TP2: 43,924
Stop Loss: Below 38,950
📌 Note: Watch for pullbacks to triangle resistance-turned-support. FOMC and US macro data releases midweek can impact momentum.
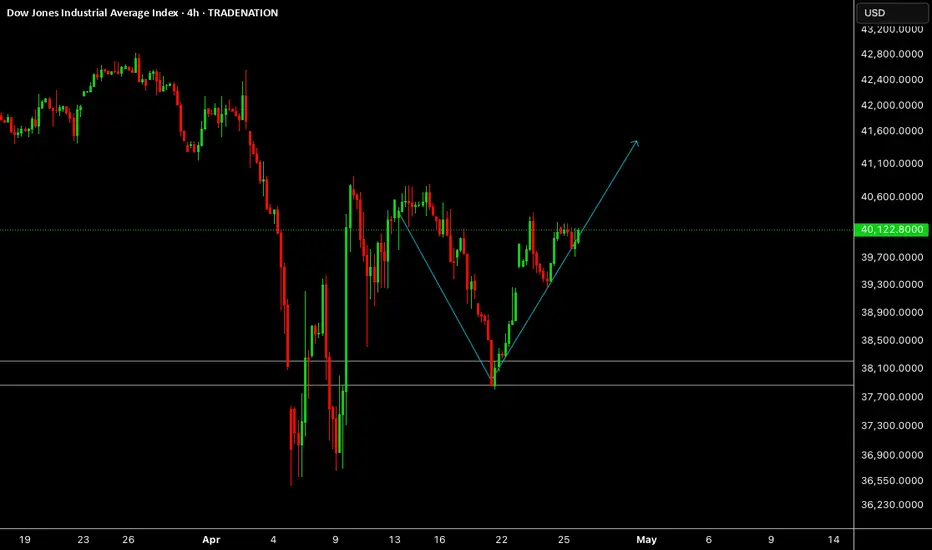
US30 ShortOverall, the Dow Jones (US30) is bullish.
But has we all know, all the gaps are always filled. I'm shorting until the gap is filled and then the market might continue it's movement to the upside.

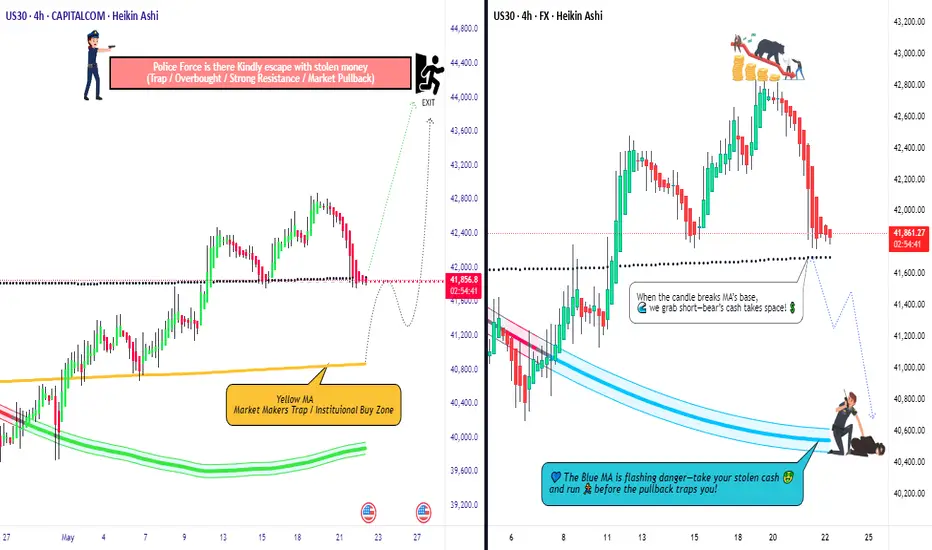
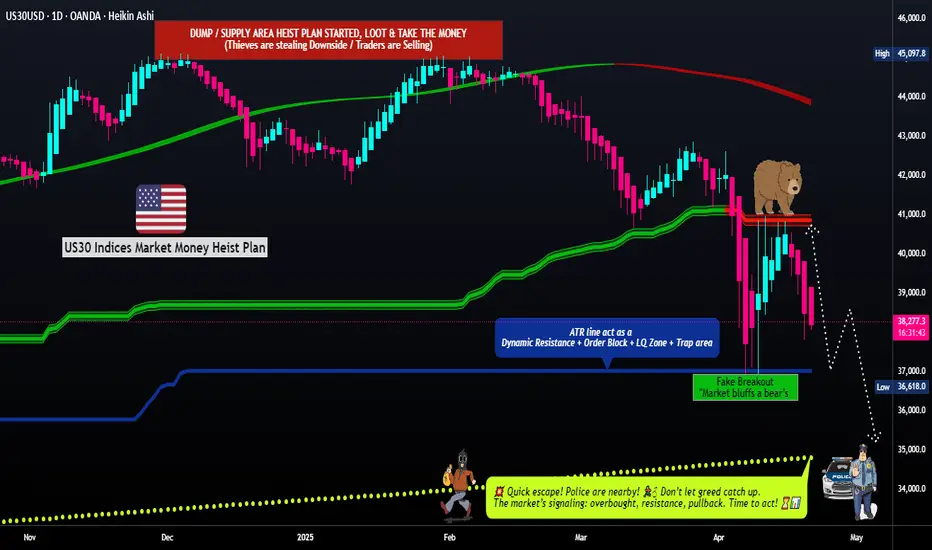
US30/DJI "Dow Jones" Index CFD Market Heist Plan (Day or Swing)🌟Hi! Hola! Ola! Bonjour! Hallo! Marhaba!🌟
Dear Money Makers & Robbers, 🤑💰✈️
Based on 🔥Thief Trading style technical and fundamental analysis🔥, here is our master plan to heist the US30/DJI "Dow Jones" Index CFD Market. Please adhere to the strategy I've outlined in the chart, which emphasizes short entry. Our aim is the high-risk Yellow MA Zone. Risky level, oversold market, consolidation, trend reversal, trap at the level where traders and bullish robbers are stronger. 🏆💸"Take profit and treat yourself, traders. You deserve it!💪🏆🎉
Entry 📈 : "The vault is wide open! Swipe the Bearish loot at any price - the heist is on!
however I advise to Place sell limit orders within a 15 or 30 minute timeframe most nearest or swing, low or high level for Pullback Entries.
Stop Loss 🛑:
📌Thief SL placed at the nearest/swing High or Low level Using the 1D timeframe (41000) Day/Swing trade basis.
📌SL is based on your risk of the trade, lot size and how many multiple orders you have to take.
Target 🎯: 35000 (or) Escape Before the Target
💰💵💸US30/DJI "Dow Jones" Index CFD Market Heist Plan (Swing/Day Trade) is currently experiencing a Bearish trend.., driven by several key factors.👇👇👇
📰🗞️Get & Read the Fundamental, Macro, COT Report, Geopolitical and News Analysis, Sentimental Outlook, Intermarket Analysis, Index-Specific Analysis, Future trend targets with Overall outlook score... go ahead to check 👉👉👉🔗🔗
⚠️Trading Alert : News Releases and Position Management 📰 🗞️ 🚫🚏
As a reminder, news releases can have a significant impact on market prices and volatility. To minimize potential losses and protect your running positions,
we recommend the following:
Avoid taking new trades during news releases
Use trailing stop-loss orders to protect your running positions and lock in profits
💖Supporting our robbery plan 💥Hit the Boost Button💥 will enable us to effortlessly make and steal money 💰💵. Boost the strength of our robbery team. Every day in this market make money with ease by using the Thief Trading Style.🏆💪🤝❤️🎉🚀
I'll see you soon with another heist plan, so stay tuned 🤑🐱👤🤗🤩
US30 Trading Into Major Resistance - Look For Dow Jones Retrace🔍 US30 Analysis: At the moment, I'm watching the US30 as it looks overextended 📈 and is trading into previous highs. 🧱 If you look left on the chart, it's approaching a key resistance level on both the weekly and daily timeframes.
I’m expecting a potential retracement 🔁 and monitoring for a bearish break of structure on the 30-minute timeframe ⏱️ as a possible setup for a counter-trend short 📉 — aiming for the imbalance zone visible on that timeframe.
📏 Drawing a Fibonacci retracement from the recent swing low to high, the 50% equilibrium 🔄 lines up perfectly with the imbalance area, adding confluence to the idea.
📚 This is shared for educational purposes only and should not be considered financial advice 💼.

US30US30 reacted from 38K level as predicted, now correction and further upside towards 41K level.
Disclosure: We are part of Trade Nation's Influencer program and receive a monthly fee for using their TradingView charts in our analysis.
Us30 Upward or downward?In the 5-minute timeframe, you can sell at the top of the trading range and buy at the bottom of the trading range (by observing reversal candles and patterns).
Alternatively, you can wait for a breakout and enter in the direction of the breakout.
Be mindful of fake breakouts

DOW/US30 - RETAIL DATA AND POWELL SPEECHTeam,
The market has been a roller coaster due to the Trump Tariff plan
. We are in an entry long position now but with small volume only.
The current for US30 price is 40248
We are using a swing stop loss at 40120
Once the price reaches above 40300, bring stop loss to BE
the data consensus shows that 700% retail increase is more than last month.
this will likely support the market. Also, Trump's tariff plan would improve exports and bring down the DOLLAR.
Therefore, if you are risking a trade 1R buts 5R as a reward
Please assess your risk and make the decision.
NOTE: However, if the price drop toward 39800-39200, I will double and triple my money on long position
will get our money back easily.
Every trade you enter requires a risk and reward
ask yourself and analyst carefully
We can easily get 40300 then bring stop loss to BE for target the range above
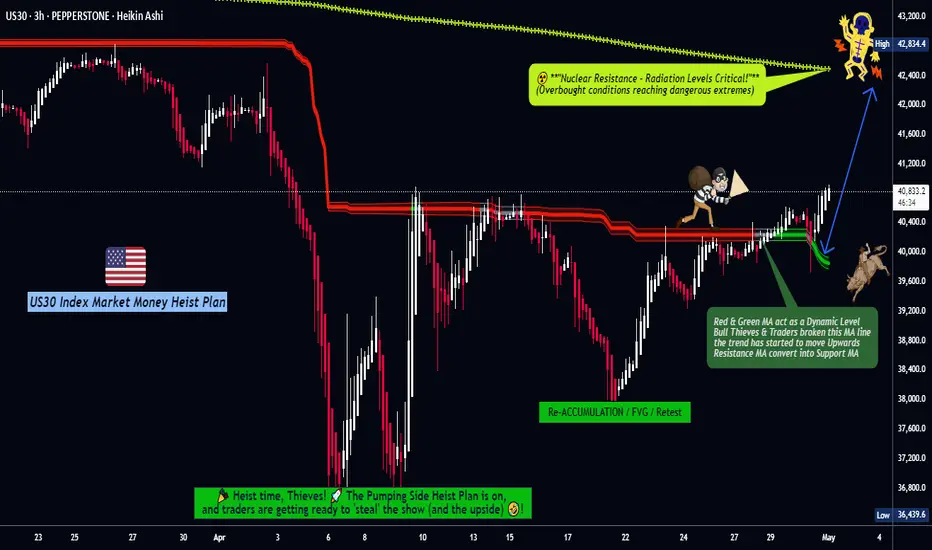
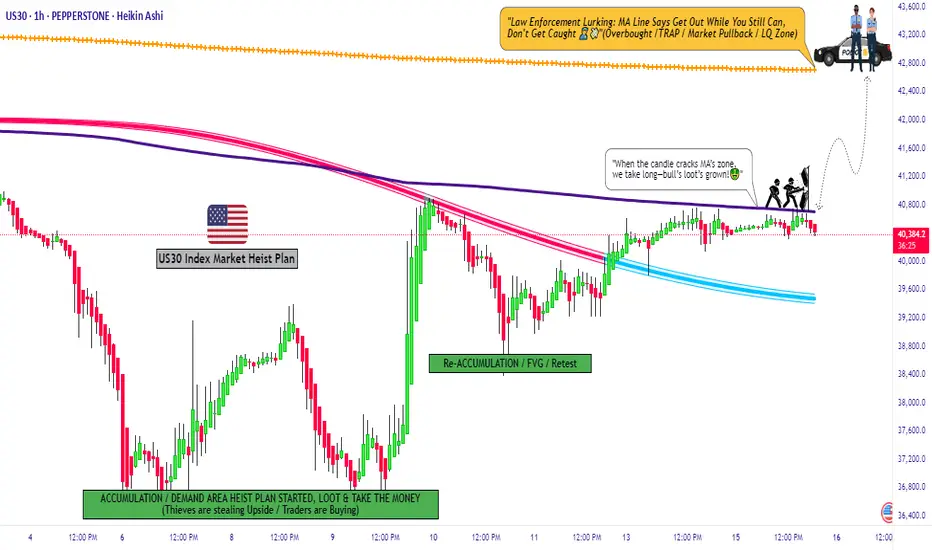
"US30/DJI30" Index CFD Market Heist Plan (Scalping/Day Trade)🌟Hi! Hola! Ola! Bonjour! Hallo! Marhaba!🌟
Dear Money Makers & Robbers, 🤑 💰💸✈️
Based on 🔥Thief Trading style technical and fundamental analysis🔥, here is our master plan to heist the "US30/DJI30" Index CFD Market. Please adhere to the strategy I've outlined in the chart, which emphasizes long entry. Our aim is to escape near the high-risk MA Zone. Risky level, overbought market, consolidation, trend reversal, trap at the level where traders and bearish robbers are stronger. 🏆💸"Take profit and treat yourself, traders. You deserve it!💪🏆🎉
Entry 📈 : "The heist is on! Wait for the MA breakout (40800) then make your move - Bullish profits await!"
however I advise to Place Buy stop orders above the Moving average (or) Place buy limit orders within a 15 or 30 minute timeframe most recent or swing, low or high level for Pullback entries.
📌I strongly advise you to set an "alert (Alarm)" on your chart so you can see when the breakout entry occurs.
Stop Loss 🛑: "🔊 Yo, listen up! 🗣️ If you're lookin' to get in on a buy stop order, don't even think about settin' that stop loss till after the breakout 🚀. You feel me? Now, if you're smart, you'll place that stop loss where I told you to 📍, but if you're a rebel, you can put it wherever you like 🤪 - just don't say I didn't warn you ⚠️. You're playin' with fire 🔥, and it's your risk, not mine 👊."
📍 Thief SL placed at the recent/swing low level Using the 1H timeframe (39200) Day trade basis.
📍 SL is based on your risk of the trade, lot size and how many multiple orders you have to take.
🏴☠️Target 🎯: 42700 (or) Escape Before the Target
🧲Scalpers, take note 👀 : only scalp on the Long side. If you have a lot of money, you can go straight away; if not, you can join swing traders and carry out the robbery plan. Use trailing SL to safeguard your money 💰.
💰💵💴💸"US30/DJI30" Index CFD Market Heist Plan (Day / Scalping Trade) is currently experiencing a bullishness🐂.., driven by several key factors.👇👇👇
📰🗞️Get & Read the Fundamental, Macro, COT Report, Quantitative Analysis, Sentimental Outlook, Intermarket Analysis, Future trend targets... go ahead to check 👉👉👉🔗🔗
⚠️Trading Alert : News Releases and Position Management 📰 🗞️ 🚫🚏
As a reminder, news releases can have a significant impact on market prices and volatility. To minimize potential losses and protect your running positions,
we recommend the following:
Avoid taking new trades during news releases
Use trailing stop-loss orders to protect your running positions and lock in profits
💖Supporting our robbery plan 💥Hit the Boost Button💥 will enable us to effortlessly make and steal money 💰💵. Boost the strength of our robbery team. Every day in this market make money with ease by using the Thief Trading Style.🏆💪🤝❤️🎉🚀
I'll see you soon with another heist plan, so stay tuned 🤑🐱👤🤗🤩
Beyond the Noise: US30 Analysis and Actionable Trade Ideas.Technical Analysis: US30 (Dow Jones)
📊 The US30 index is currently displaying a bearish trend on the weekly timeframe. We're observing a strong rally followed by a pullback into equilibrium when measured against the previous price swing range.
🔍 At present, the index sits in a premium zone, creating conditions where short positions may be accumulating for potential downside movement. However, market sentiment remains highly susceptible to external factors, particularly political statements and social media activity from key figures like Donald Trump.
⚠️ Given this unpredictability, a more prudent approach involves shifting focus to lower timeframes and following price action signals directly. The 30-minute chart presents a defined range that offers potential trade opportunities.
💡 Trade Idea: Monitor the current range on the 30-minute timeframe. A decisive break above the range could signal a long entry opportunity, while a break below may indicate a short entry position.
📈 This range-breakout strategy allows traders to adapt to market conditions rather than attempting to predict overall market direction, which has proven increasingly challenging in the current economic and political climate.
Not financial advice.

US30US30, after giving us push up last week is correcting and is still not done with correction. We need some down side before push up again.
Disclosure: We are part of Trade Nation's Influencer program and receive a monthly fee for using their TradingView charts in our analysis.
