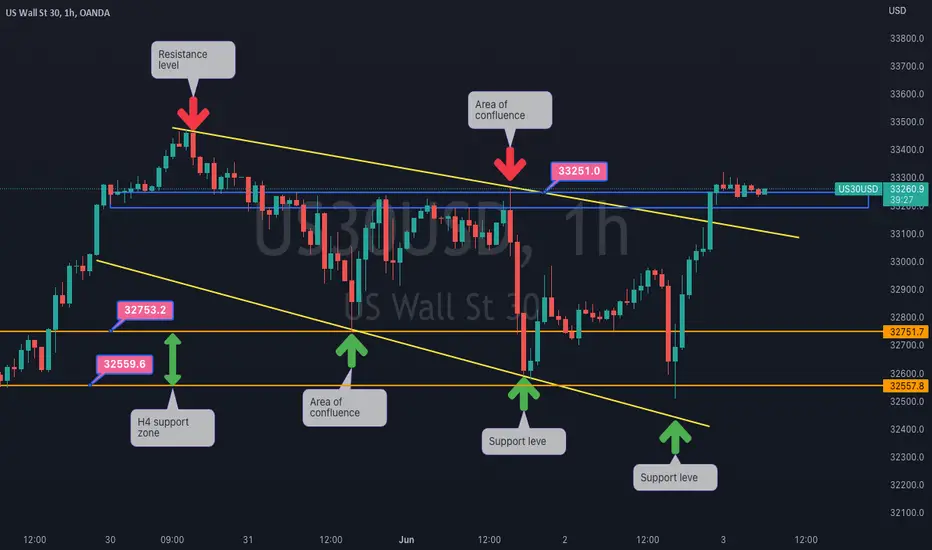
US 30 on H1 chart daily updateThe market is still on the range. We are seeing a build up for a breakout in the market , at this moment one should wait for the breakout. The level that I'm looking for the breakout are 33326.9 from the resistance or 32614.3 from the support level.
Us30idea

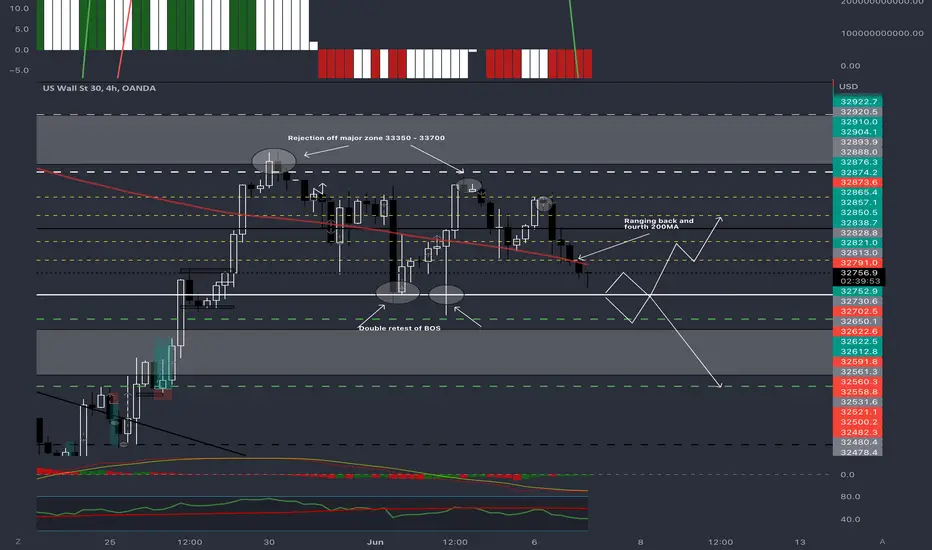
US30 l DAILY l OUTLOOKMinor zones of S & R
1. 32830 - 32930
2. 33100 - 33200
Major zones of S & R
1. 32100 - 32450
2. 33350 - 33700
Daily Takeaways:
1. Range in between minor zones
2. Two rejection off major zone 33350 - 33700
3. Double retest of BOS at 32630 (potentially another retest of BOS / major zone 32100 - 32450.
4. Consolidating back and fourth between 200 MA.
US 30 on the H1 chart updateThe market is still moving sideways at this moment. Let us hope you are planning your trade wisely as we know that if you do not have strategy for ranging market you will be playing with fire. As for me I'm waiting for the breakout before I can take any trade.

US 30 on the H1 chart The H1 chart for the US 30 is showing us that is currently moving sideways. If you are to trade it you need a strategy that is in line with trading sideway market . as for me I follow a trend and I do not trade sideway market.

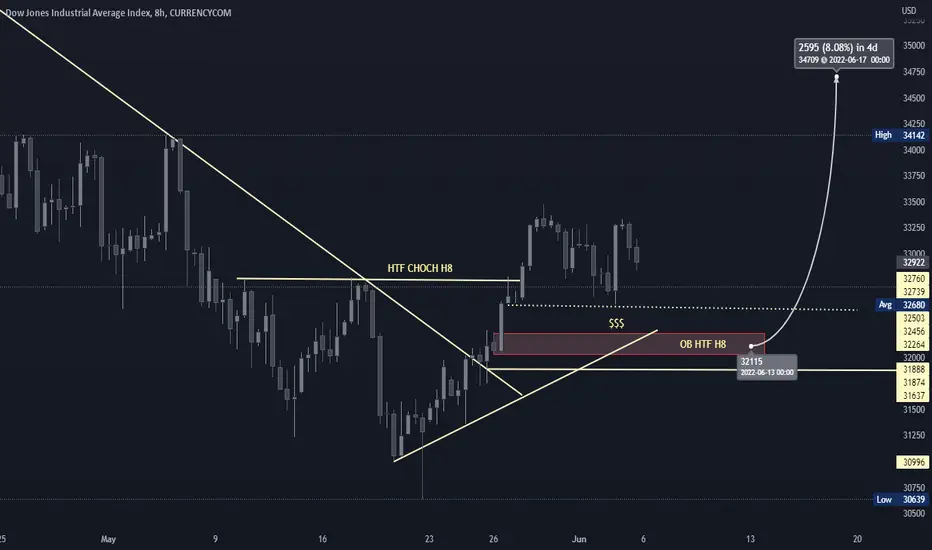
US 30 Buy Idea - #DowJones
Setup:
1. we note a H8 Choch
2. OB H8
3. Liquidity
4. will wait for m42 LTF Choch
5. Last OB m42 OB creation
6. Then we will buy.
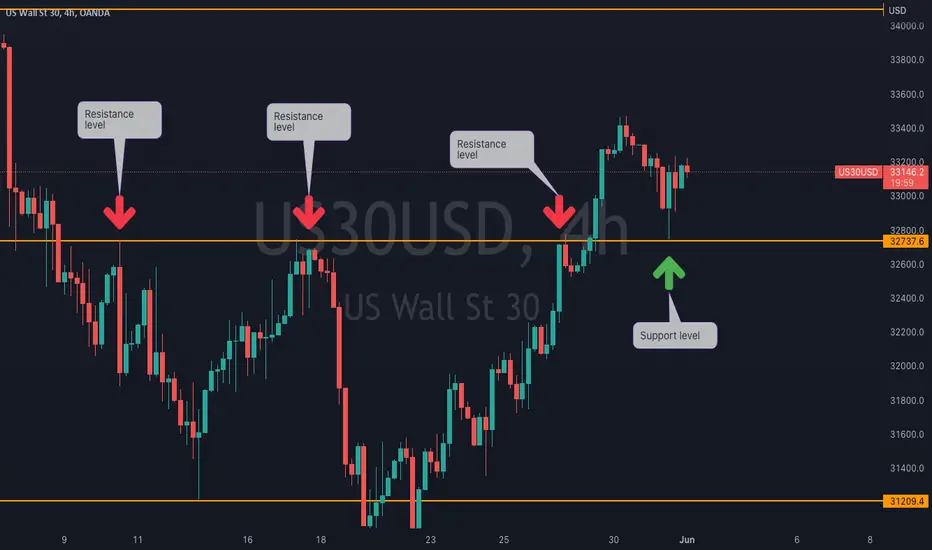
US 30 on the H4 chart The price is is currently on the support level. The are 2 possibilities that my take place at the level 1. we may see the price pushing to the upside aiming to reach the resistance or 2. the price may break it and push to the down side as we know that the market is still under the control of the bears.

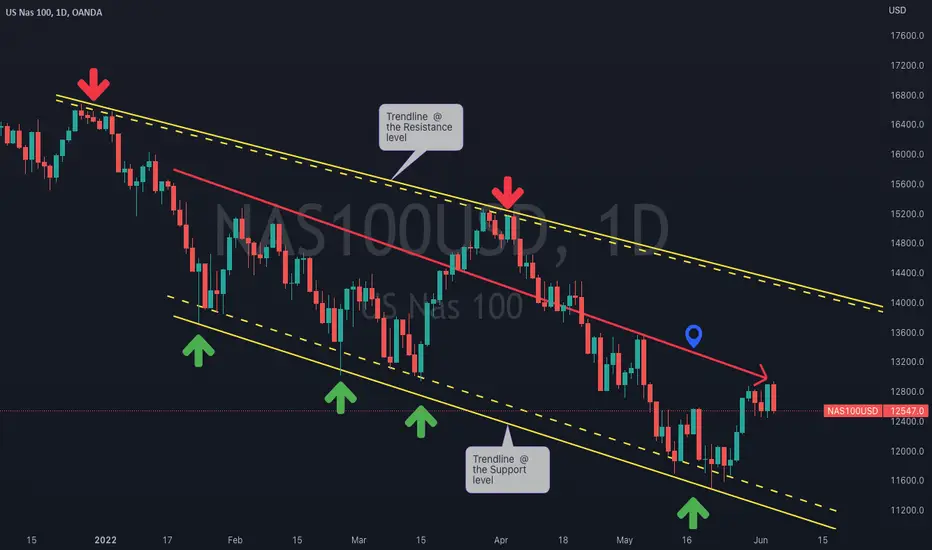
US 30 Weekly analysis on a Daily chart The market is on down trend channel. The is showing us that, we need to look for selling opportunities more than buying opportunities. If you take buying trades be aware of who is in control of the market between Bears and Bulls.
US 30 H1 chart The US 30 on H1 chart. The movements of the past 4 days. Please follow my another days to see the full analysis.
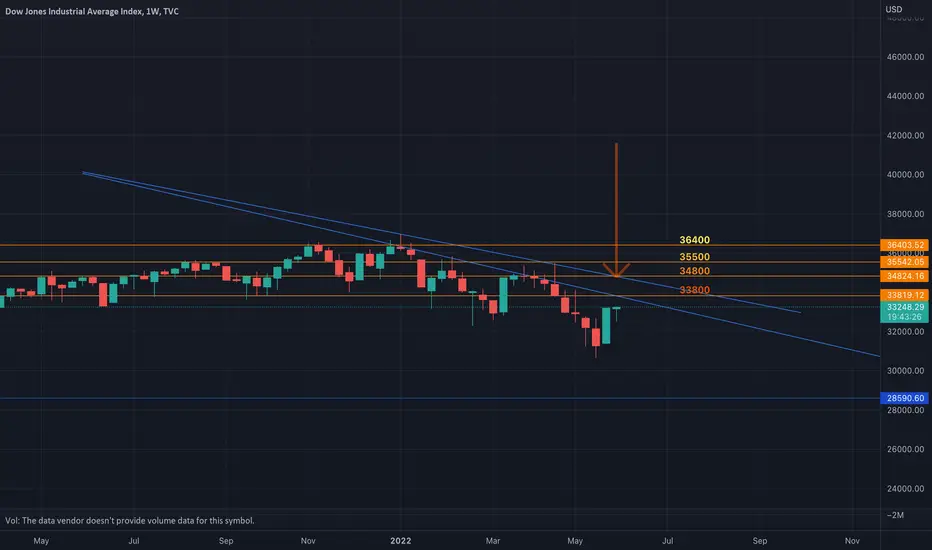
US30 finishing up it's retracement.I've been reading ideas for the past 6 months now. I've finally got the courage to post one my own theories on where the market could potentially go within the next week. Seems like 33800 and 34800 are the most realistic targets that get hit. Will potentially look for an entry on a pullback. Would love to know your thoughts and constructive criticism .
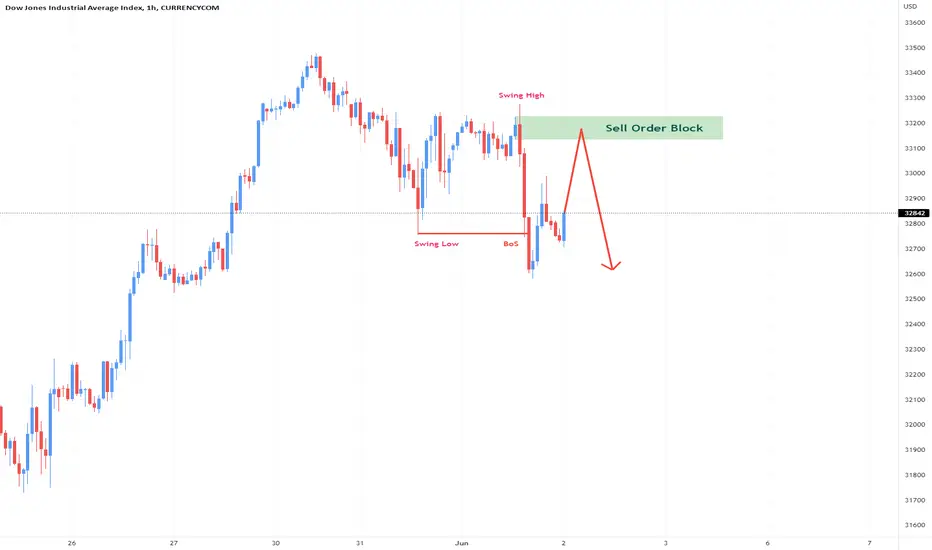
US30 dowjones sell setup ( short )Prior to this analysis, I had published an analysis in daily timeframe. Check it out first.
Now you see a setup for a sell position at a lower time frame (1H).
If the price reaches the specified block order, we will wait for the trigger in the lower time frame (5m).

US30 Chart H1Here is my view for US30 on H1. The price could go down, you can put a pending order on the Order block or find an entry on LTF within OB Zone. Trade Safe!

My analysis of the day on H1 chart for US 30The market seems to be respecting the trendline, that will only be confirmed once the counter trendline is broken and the price push to the upside at this point is to see as to where the price will push to.

US30 l DAILY l OUTLOOKDAILY TAKEAWAYS:
Last weeks TA played out perfectly.
1. Broke two BOS @ 31550 & 32650
2. Broke out of descending channel
3. Broke though major key level zone 32100 - 32450.
Looking at what we see now. (4 HR)
1. US30 rejected off bottom of major zone 33350 - 33650.
2. US30 broke through 200 MA which could potentially change trend if a bounce retest is made.
3. If we continue to push bullish there is a major BOS @ 34050 that has acted as a rejection / resistance zone.
4. Viewing top MACD indicator it is the first time in months we have been above the 200 level.
Previous TradingView TA linked

US30 SHORTS INCOMING??? i got sell limits placed at the 78.6
us30 broke out its channel but it is still bearish overall on the higher time frame i believe last week was the pull back for this week downtrend to continue.
-30 min time frame is over bought
-1hr time frame is over bought
-2hr time frame is over bought
4hr time frame is over bought

US30Hello Traders and subscribers.... #US30 has seen a decent drop recently due to inflation and interest rate hike by the feds. But last week it broke out of a major falling trendline that has served as resistance.. Hence, it has been creating higher highs and higher lows.. Right now it has gotten to a supply zone where I expect a little pull back before it continues growing.

DeGRAM | US30 longLast week, we predicted that US30 was going to move to higher levels.
Price broke and closed above the resistance zone, which now became a support.
Price action has created a nice swing zone from which the price may soon bounce off upwards.
-------------------
Share your opinion in the comments and support the idea with like. Thanks for your support!

US 30 on an H4 chart The price can still retest level 32760.1 as it was a resistance before it can push to the upside or it may pull back as the higher timeframe indicator that the price is at the confluence zone.

US 30 on a Daily Chart The daily chart is showing us that we are currently on a channel and is on a down trend.

US30 Sell Ideaif we look at H1 timeframe, we will see nice double top. After 2 hours when New York session starts, we may see nice bearish candlestick.

US30 - PRE NY SESSION ANALYSIS - 05252022US30 - PRE NY SESSION ANALYSIS - 05252022
Price appears to be breaking down as I post this video.
After yesterday's push up, price hung out in the 31900 - 32050 range during Asian/Early London session.
I got in to the positions I have now at approximately 32040 and my ultimate target is 31000.
Trailing stops at 100 points after price.
Let's see what happens, I'll be back with you after NY session!
Happy trading!

US30 l DAILY l OUTLOOKLooking back at May 16th & May 22nd (LINKED IN DESCRIPTION) TA that was sent on US30 the following was stated and played out for both.
MAY 16th TA
“We saw on Friday a nice bullish flag pattern play out. We broke our downtrend trend-line and retested the our bull flag twice clarifying added support to that area.
What we see / need to see now.
1. US30 is still not out of our bearish zone. US30 is still under 200 EMA on our 4 hr chart.
2. US30 retest our downtrend trendline and formed a nice price action support pattern (circled).
3. US30 has entered back into major zone 32050 - 32450.
4. Need to see a higher low formed or a BOS of 32450 which has been a major rejection zone.”
MAY 22nd TA
DAILY OUTLOOK / TAKEAWAYS:
1. US30 is still overall bearish . Retesting major levels 31250 & 30750 for the first time MARCH 2021.
2. Last time these levels were touched we reached ALL TIME HIGHS.
3. US30 is still breaking in and out of descending channel .
4. US30 bounced off of major zone 30750 and is now retesting major zone 31250.
5. NEED TO SEE A FULLY ENGULFING CANDLE TAKE OVER AND ENTER BACK INTO DESCENDING CHANNEL .
6. ENGULFING candle needs to clear BOS and retest BOS to see continued upwards bullish movement.
MAY 25th TA
DAILY TAKEAWAYS:
1. US30 saw multiple retests of BOS / support and resistance level 31550.
2. Fake of candle breaking through BOS (circled) rejection wick.
3. We have broken out of descending channel once again.
4. Need to see a minor retest of descending channel then a break into major zone 32100 - 32450.
5. Next major BOS is positioned at 32650.
