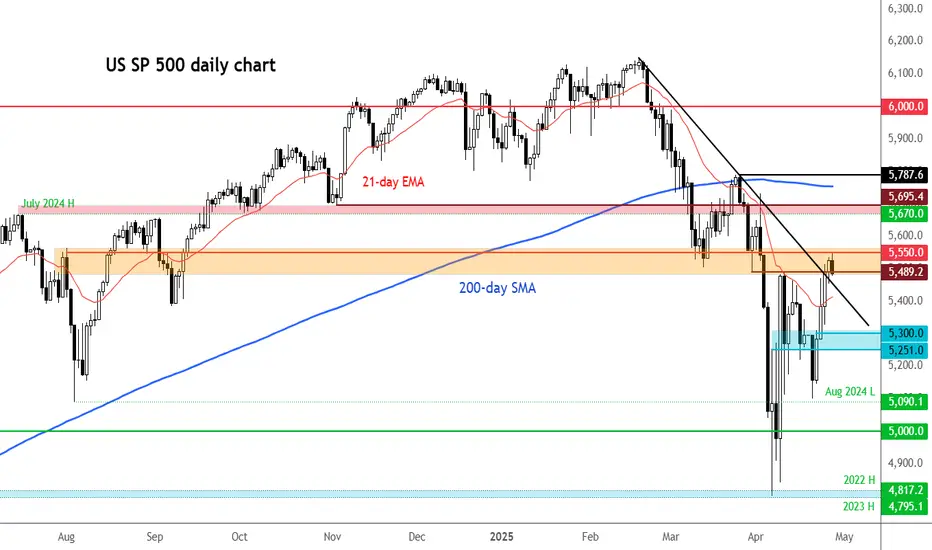
SPX 500 turns lower ahead of busy weekAhead of a busy week, the S&P 500 has found resistance at a key area of resistance near 5550. The Index had rallied in the previous three sessions, but with trade and economic uncertainty still at the forefront, investors are not rushing to chase this rally - and rightly so. May be they will still buy the dip as we head deeper into the week, though, given Trump's change of tone and optimism surrounding trade deals. For me the key support area to watch is around 5,300, but other areas of support including 5840 and 5400.
Beyond trade negotiations and trade concerns, a flood of traditional economic data is set to be released this week. Key highlights include PMI surveys from China and the US, first-quarter US GDP, the Bank of Japan’s policy meeting on Thursday, and the critical US nonfarm payrolls report on Friday. On top of all that, it’s the biggest week of earnings season, featuring results from Microsoft and Meta after Wednesday’s close, and from Apple and Amazon—four members of the so-called “Magnificent Seven”—reporting on Thursday.
By Fawad Razaqzada, market analyst with FOREX.com
Us500
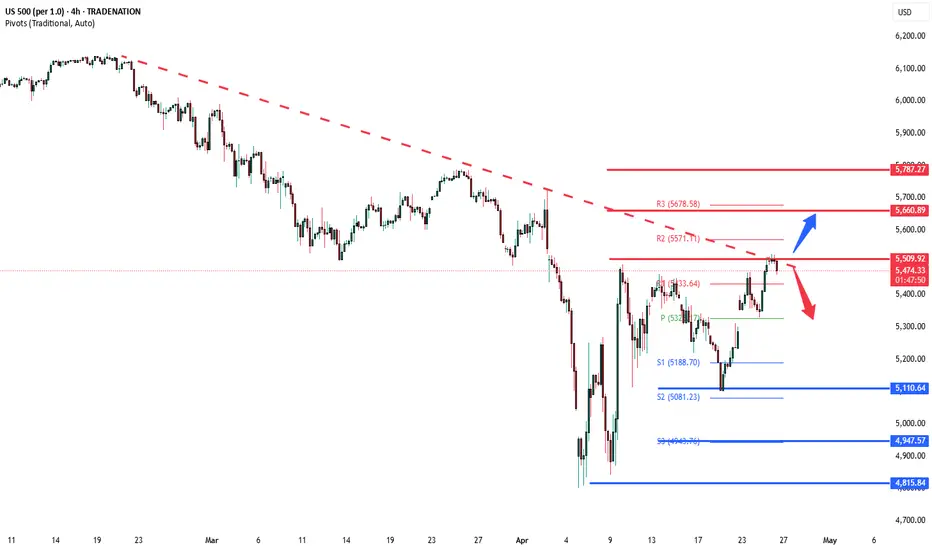
US500 Will Go Down From Resistance! Short!
Take a look at our analysis for US500.
Time Frame: 9h
Current Trend: Bearish
Sentiment: Overbought (based on 7-period RSI)
Forecast: Bearish
The market is on a crucial zone of supply 5,525.49.
The above-mentioned technicals clearly indicate the dominance of sellers on the market. I recommend shorting the instrument, aiming at 5,306.14 level.
P.S
We determine oversold/overbought condition with RSI indicator.
When it drops below 30 - the market is considered to be oversold.
When it bounces above 70 - the market is considered to be overbought.
Disclosure: I am part of Trade Nation's Influencer program and receive a monthly fee for using their TradingView charts in my analysis.
Like and subscribe and comment my ideas if you enjoy them!

S&P 500 E-mini Futures: Bullish Momentum Meets Key Resistance📈 Technical Analysis: S&P 500 E-mini Futures (ES1!) – April 2025
🚀 Market Structure & Price Action for US500
The daily chart shows the S&P 500 E-mini Futures in a bullish recovery after a significant correction. The recent rally has pushed price back toward previous swing highs, an area likely to contain resting buy-side liquidity. This move suggests that the market is currently in a markup phase, but is now approaching a critical resistance zone where profit-taking and counter-trend activity may emerge.
🧠 Wyckoff Perspective
From a Wyckoff methodology standpoint, the recent price action resembles a classic accumulation-to-markup transition. The sharp selloff in March and early April appears to have formed a selling climax (SC) followed by an automatic rally (AR) and a secondary test (ST). The current advance could be interpreted as a sign of strength (SOS), but the proximity to previous highs raises the risk of an upthrust (UTAD) or a bull trap if supply emerges.
🌊 Liquidity & Potential Pullback
As price trades into the prior highs, it is likely "eating" buy-side liquidity—triggering stops and breakout orders. This process often leads to a liquidity sweep, where price briefly exceeds resistance before reversing as large players offload positions. If the market fails to sustain above these highs, a pullback or even a reversal could be initiated, especially if volume and momentum wane.
🌐 Market Sentiment & Fundamentals
Current sentiment remains cautiously optimistic, with the S&P 500 E-mini trading above 5,500 and recent sessions showing resilience despite mixed earnings and macroeconomic uncertainty. The broader market is supported by expectations of stable Fed policy and robust corporate earnings, but there are persistent concerns about inflation and global growth. According to Markets Insider, the ES futures are up 0.59% recently, reflecting a positive but not euphoric tone. However, as noted by Investing.com, there are signs the market could be setting up for a reversal if bulls fail to maintain momentum.
🛠️ Trade Ideas
🟢 Bullish Scenario: If price breaks and holds above the previous highs with strong volume and closes, consider a long entry targeting the next psychological resistance (e.g., 5,700–5,800). Place stops just below the breakout level to manage risk. This would confirm continued demand and a potential extension of the markup phase.
🔴 Bearish Scenario: If price fails to hold above the highs and forms a reversal pattern (e.g., bearish engulfing, upthrust), look for a short entry targeting the first support zone (e.g., 5,300–5,200). Stops should be placed above the failed breakout. This would align with a Wyckoff upthrust after distribution and a likely liquidity sweep.
⚠️ Disclaimer
This analysis is for informational purposes only and does not constitute financial advice. Trading futures involves significant risk and may not be suitable for all investors. Please conduct your own research and consult with a licensed financial advisor before making any trading decisions.

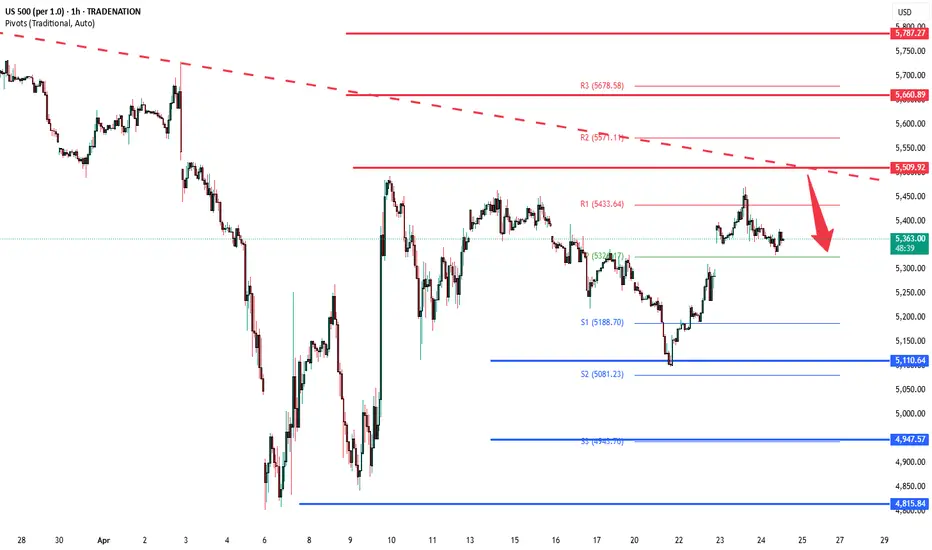
S&P500 INTRADAY resistance at 5510Global Trade & Geopolitics
China may suspend steep tariffs on some U.S. imports, like medical equipment and ethane, to ease pressure on key industries—hinting at a more pragmatic trade stance.
Apple plans to shift most U.S. iPhone production to India by late next year, while Walmart is helping Chinese exporters sell locally—both reflecting efforts to reduce reliance on China.
U.S.-Russia-Ukraine: The U.S. will push for Russia to recognize Ukraine’s right to its own military in any peace deal. However, Trump suggests Ukraine may have to cede some territory. Meanwhile, reduced U.S. aid is increasing Ukraine’s exposure to Russian cyberattacks.
Market Impact:
Watch for shifts in trade-sensitive sectors, supply chain plays (especially in tech), and defense stocks as geopolitical risk evolves.
Key Support and Resistance Levels
Resistance Level 1: 5510
Resistance Level 2: 5660
Resistance Level 3: 5790
Support Level 1: 5110
Support Level 2: 4950
Support Level 3: 4815
This communication is for informational purposes only and should not be viewed as any form of recommendation as to a particular course of action or as investment advice. It is not intended as an offer or solicitation for the purchase or sale of any financial instrument or as an official confirmation of any transaction. Opinions, estimates and assumptions expressed herein are made as of the date of this communication and are subject to change without notice. This communication has been prepared based upon information, including market prices, data and other information, believed to be reliable; however, Trade Nation does not warrant its completeness or accuracy. All market prices and market data contained in or attached to this communication are indicative and subject to change without notice.
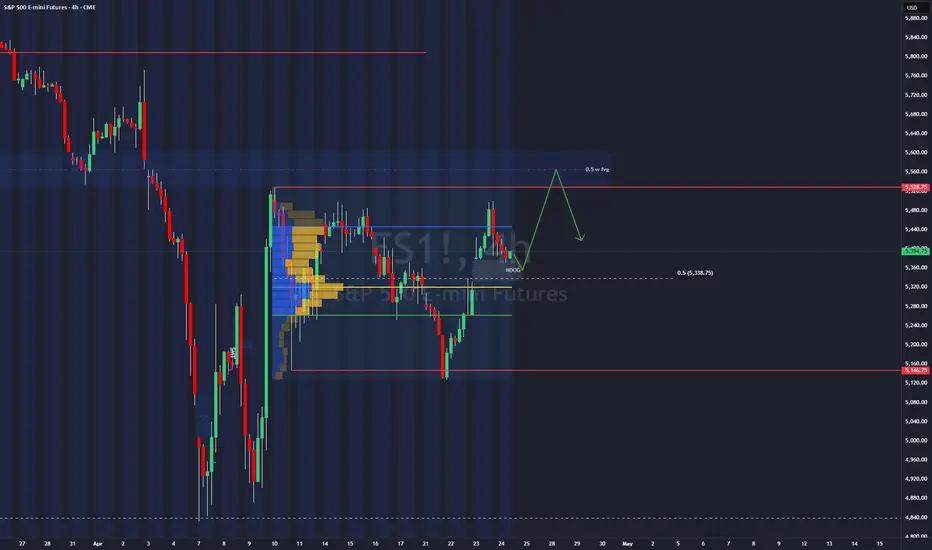
SP500 what to expect next?As a seasoned trader with over a decade of experience navigating the markets, I’ve been closely monitoring the S&P 500’s current price action. The index is presently confined within a well-defined range, with resistance at 5,528 and support at 5,146, based on recent price behavior. We’ve observed a notable deviation below the lower boundary of this range, which often signals a potential reversal or absorption of liquidity before a move higher.
My analysis suggests the next likely target is the upper boundary of the range at 5,528, coinciding with a weekly Fair Value Gap (FVG) that has yet to be filled. Should the price approach this zone, I anticipate a strong market reaction, potentially driven by aggressive order flow as participants defend or challenge this key level. If the weekly FVG is invalidated—meaning price sweeps through this area without significant rejection—the S&P 500 could be poised to break out and target new all-time highs from its current position.
US500 LIVEHello friends
Given the price rise and correction we had, we can open a position with capital and risk management.
*Trade safely with us*

S&P500 INTRADAY resistance at 5510Stocks are pulling back after Wednesday’s rally, pressured by renewed trade tensions. China stated that no deal talks are underway, and Treasury Secretary Scott Bessent expressed scepticism over resolving the trade dispute. US futures slipped, the dollar weakened, and gold rose as investors sought safety.
Jefferies strategist Christopher Wood warned that US equities, Treasuries, and the dollar may face further downside, noting the market has likely peaked. Deutsche Bank also trimmed its S&P 500 target, citing the negative impact of ongoing tariffs on US companies.
It’s a packed earnings day: PepsiCo, Procter & Gamble, and American Airlines report before the open, while Alphabet and Intel are set to release results after the close.
Key Support and Resistance Levels
Resistance Level 1: 5510
Resistance Level 2: 5660
Resistance Level 3: 5790
Support Level 1: 5110
Support Level 2: 4950
Support Level 3: 4815
This communication is for informational purposes only and should not be viewed as any form of recommendation as to a particular course of action or as investment advice. It is not intended as an offer or solicitation for the purchase or sale of any financial instrument or as an official confirmation of any transaction. Opinions, estimates and assumptions expressed herein are made as of the date of this communication and are subject to change without notice. This communication has been prepared based upon information, including market prices, data and other information, believed to be reliable; however, Trade Nation does not warrant its completeness or accuracy. All market prices and market data contained in or attached to this communication are indicative and subject to change without notice.
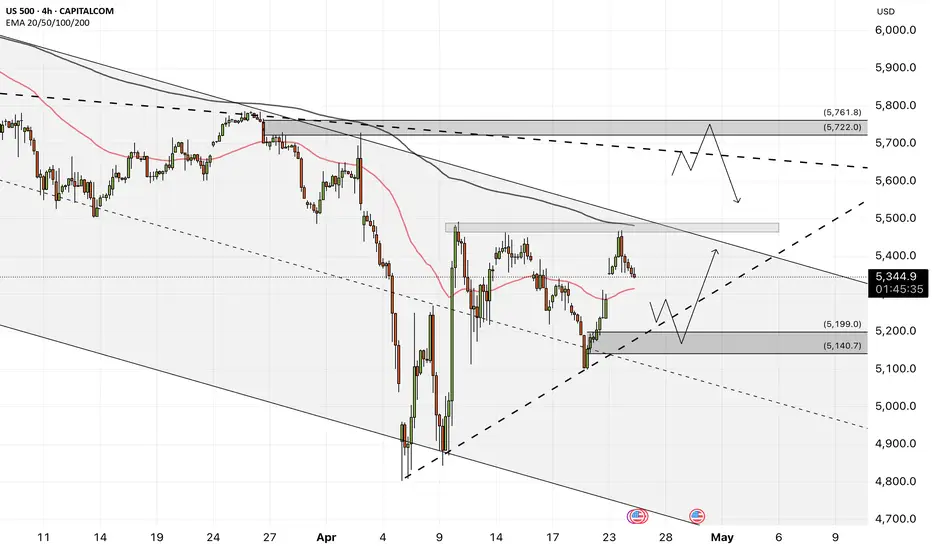
US500 - Will the stock market go up?!The index is located between the EMA200 and EMA50 on the four-hour timeframe and is trading in its descending channel. If the index moves down towards the specified demand zone, we can look for the next Nasdaq buying positions with an appropriate risk-reward ratio. The channel breakdown and the index entering the supply zone will provide us with its next selling position.
The chief economist at Citigroup has stated that the imposition of tariffs in the United States constitutes a stagflationary shock to the economy. According to his estimates, there is a 40% to 45% chance of a recession. It is expected that GDP will increase in the second quarter, as consumers rush to make purchases ahead of the new tariffs. However, the most significant negative impact on U.S. economic growth is projected to unfold in the second half of the year.
You may have noticed that recent economic statistics are no longer moving markets. The reason is simple: markets are forward-looking and trade on expectations rather than past data. Economic figures reflect what has already occurred, while market pricing focuses on what lies ahead.
At this stage, current data has yet to fully reflect the impact of tariffs and trade tensions. Even if weaker numbers emerge, markets may have already priced in the potential resolution of the trade war and an eventual recovery.
Experienced traders understand that today’s developments are already factored into prices. What matters now is the outlook for the coming months—the real driver of market direction.
Ryan Petersen of Flexport noted yesterday that, three weeks after the U.S.imposed heavy tariffs on Chinese imports, bookings for ocean freight containers have dropped more than 60% industry-wide. He explained that the U.S. imports around $600 billion worth of goods annually from China, with those items valued at approximately $2 trillion at the retail level.
He stated that the first ships carrying goods fully subject to the new tariffs arrived on Monday, and shipping volumes are expected to decline in the coming weeks. However, due to high inventory levels, the impact on the retail sector may be delayed.
Petersen also expressed concern that a potential rollback of tariffs could introduce a new set of challenges. With ships currently being repositioned globally, a sudden wave of new orders could disrupt logistics networks—especially if markets perceive the suspension of tariffs as only temporary.
In my view, no one really knows how this situation will evolve, as a large portion of imports consists of intermediate goods and components used in final products. My guess is that this could lead to a surge in transshipment and even smuggling, though it could just as easily echo the unexpected consequences seen during the COVID era. We are truly venturing into uncharted territory.
Petersen concludes: “This is a strange era for global logistics, as we must simultaneously prepare for the unimaginable—like full U.S. self-sufficiency—while also planning for a return to something closer to normal trade relations.”
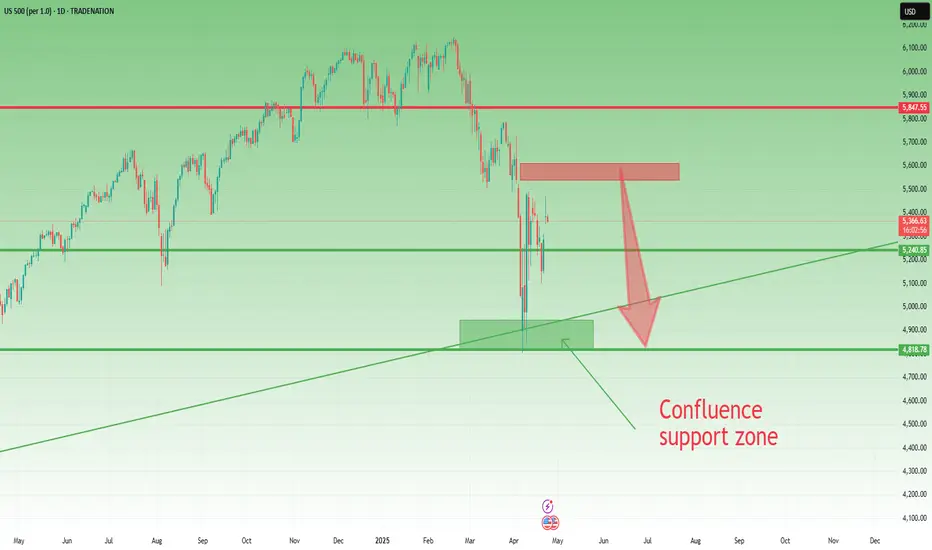
SP500 remains very bearish overall📈 In my previous post, I highlighted the confluence support zone and the potential for a bounce — and we got it. SP500 rallied around +10% off the lows.
But let’s not get too comfortable...
❓ I s the worst behind or is this just a trap before the next leg down?
From my perspective, the correction is not over.
The current bounce looks more like a bear market rally than a true reversal.
📉 Why I expect another drop:
1. Technically, as long as SP500 is trading below 5500-5600 zone, the structure remains bearish
2. Fundamentally, the backdrop hasn’t improved — if anything, it’s getting worse
3. Price is approaching a major resistance zone, which I plan to sell into
📌 My Plan:
I’m watching this zone for signs of weakness.
If momentum fades, I’ll look to short, targeting at least 5k, potentially even a new local low.
Disclosure: I am part of Trade Nation's Influencer program and receive a monthly fee for using their TradingView charts in my analyses and educational articles.
US500 Day Trade Setup: Liquidity Pools, Gaps & What’s Next?The US500 (S&P 500) 4-hour chart recently showed a gap up, followed by a strong move into the previous range highs. This price action likely triggered buy stops and tapped into buy-side liquidity above the prior swing highs. After this liquidity sweep, the market has pulled back and is now consolidating just above a visible gap, which sits slightly below the current price level.
From a Wyckoff perspective, this resembles an upthrust after distribution, where price runs stops above resistance before reversing. The current pullback suggests a potential test of the gap area, which often acts as a magnet for price, especially if there’s unmitigated liquidity left behind.
Using ICT (Inner Circle Trader) concepts, the recent move above the range high can be seen as a raid on buy-side liquidity, followed by a retracement. The gap below current price represents an imbalance, and ICT traders often look for price to revisit such inefficiencies before resuming the trend.
🌐 Fundamental & Sentiment Backdrop
Recent data shows the S&P 500 has experienced a sharp correction in April, with a monthly drop of about 5.75% from the previous month, but it remains up 6.8% year-over-year (YCharts). The market has been volatile, with sentiment shifting due to macroeconomic concerns, including renewed trade tensions (notably new tariffs), a mixed earnings season, and questions about the Federal Reserve’s next moves (IG).
Wall Street analysts have recently revised their year-end targets lower, citing increased risks from tariffs and slowing earnings growth (Yahoo Finance). The VIX is elevated (28.45), and the put/call ratio is above 1, indicating heightened hedging and caution among market participants (YCharts).
🏦 Wyckoff & ICT Concepts in Play
🏗️ Wyckoff: The recent rally into the highs and subsequent pullback fits the upthrust after distribution narrative. If the market fails to reclaim the highs, a move back into the gap (potentially as a sign of weakness) is likely.
💧 ICT: The gap below current price is a clear area of interest. If price trades down to fill this gap, watch for a reaction—either a bounce (if demand steps in) or a continuation lower if the gap fails to hold.
💡 Day Trade Idea (Not Intra-day)
Scenario: If price trades down to fill the gap just below the current level (around 5,300–5,320), monitor for a bullish reaction (such as a strong daily close, a bullish order block, or a clear rejection wick).
Trade Plan:
🕵️♂️ Wait for price to fill the gap and show a bullish daily signal.
🎯 Enter a day trade long at the next day’s open if confirmation is present (e.g., a bullish daily candle close or a break above the previous day’s high).
🛑 Place a stop loss just below the gap or the most recent swing low.
📈 Target the previous high near 5,400 for a day trade, or consider scaling out if momentum continues.
Alternative: If price fails to hold the gap and closes below it on the daily chart, consider a day trade short the following day, targeting the next liquidity pool below (e.g., 5,200).
⚠️ Disclaimer
This analysis is for educational purposes only and does not constitute financial advice. Trading involves risk, and you should do your own research or consult with a professional before making any trading decisions. Past performance is not indicative of future results.

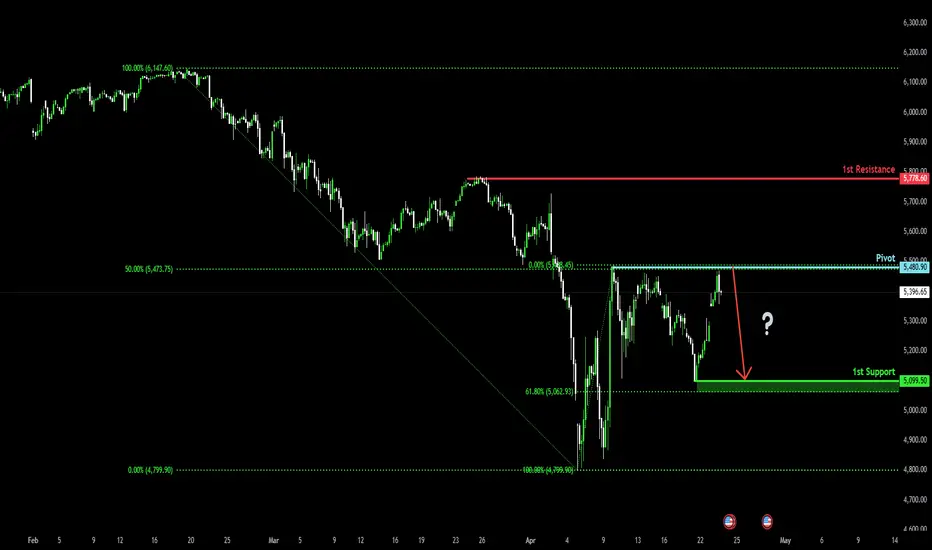
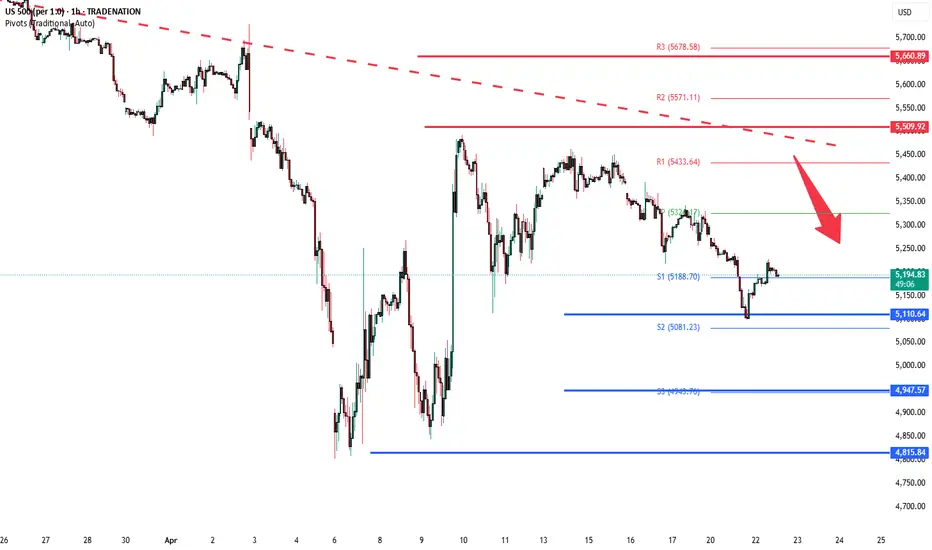
Potential bearish drop?S&P500 (US500) has reacted off the pivot and could drop to the 1st support.
Pivot: 5,480.90
1st Support: 5,099.50
1st Resistance: 5,778.60
Risk Warning:
Trading Forex and CFDs carries a high level of risk to your capital and you should only trade with money you can afford to lose. Trading Forex and CFDs may not be suitable for all investors, so please ensure that you fully understand the risks involved and seek independent advice if necessary.
Disclaimer:
The above opinions given constitute general market commentary, and do not constitute the opinion or advice of IC Markets or any form of personal or investment advice.
Any opinions, news, research, analyses, prices, other information, or links to third-party sites contained on this website are provided on an "as-is" basis, are intended only to be informative, is not an advice nor a recommendation, nor research, or a record of our trading prices, or an offer of, or solicitation for a transaction in any financial instrument and thus should not be treated as such. The information provided does not involve any specific investment objectives, financial situation and needs of any specific person who may receive it. Please be aware, that past performance is not a reliable indicator of future performance and/or results. Past Performance or Forward-looking scenarios based upon the reasonable beliefs of the third-party provider are not a guarantee of future performance. Actual results may differ materially from those anticipated in forward-looking or past performance statements. IC Markets makes no representation or warranty and assumes no liability as to the accuracy or completeness of the information provided, nor any loss arising from any investment based on a recommendation, forecast or any information supplied by any third-party.
S&P500 Long and painful but necessary bottom formation.The S&P500 index (SPX) has been trading within a 2-year Bullish Megaphone pattern and the recent 2-month correction completed its latest Bearish Leg, as it reached the Higher Lows trend-line.
The massive rebound that took place there on April 07 may have turned out to be a highly volatile one but as mentioned on the title, it might be long and painful, but a necessary process nonetheless. That's mainly because it is the strongest correction since 2022 and the longest Bearish Leg of the pattern.
The market remains highly volatile until it gets a clear signal, bearish below the current Support of the 1W MA200 (red trend-line) or bullish above the 1D MA50 (blue trend-line). Despite the rather short-term uncertainty, the similarities with the Megaphone's previous bottom are uncanny, both having formed their Low on 1D RSI Double Bottom patterns.
Given that this previous Low initiated a massive +50% 1 year Bullish Leg/ rally, we expect to see at least 7100 on this next one by mid-2026.
-------------------------------------------------------------------------------
** Please LIKE 👍, FOLLOW ✅, SHARE 🙌 and COMMENT ✍ if you enjoy this idea! Also share your ideas and charts in the comments section below! This is best way to keep it relevant, support us, keep the content here free and allow the idea to reach as many people as possible. **
-------------------------------------------------------------------------------
Disclosure: I am part of Trade Nation's Influencer program and receive a monthly fee for using their TradingView charts in my analysis.
💸💸💸💸💸💸
👇 👇 👇 👇 👇 👇

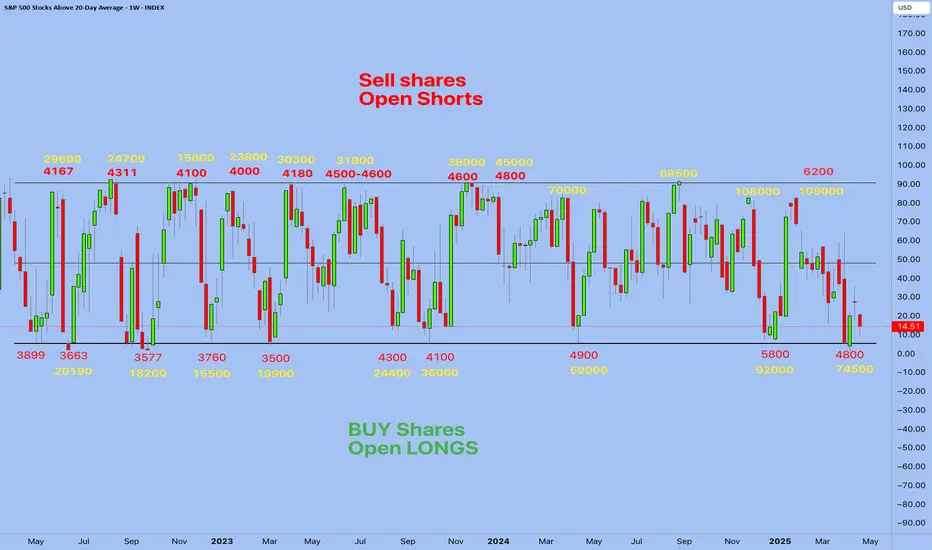
Smart investor strategyS&P 500: Percentage of Stocks Above the 20-Day Moving Average
This indicator shows the percentage of S&P 500 stocks trading above their 20-day moving average. It visually reflects short-term market strength or weakness and helps identify potential reversal points.
🔻 Sell / Open Shorts Zones:
Levels above 85–90% (marked in red) indicate an overheated market — when most stocks are trading above their short-term averages, a correction often follows.
🟢 Buy / Open Longs Zones:
Levels below 20–25% (marked in green) signal an oversold market — pressure is high, and the probability of a rebound increases.
Historically:
Each strong rally towards the 4500–4600 levels in the S&P 500 index was accompanied by overheated indicator values (85–90%).
Declines towards the 3500–3900 levels were marked by deep drops in the percentage of stocks above the 20 MA (below 20%).
Conclusion:
This indicator performs well within a sideways range and can serve as a leading signal for spotting local extremes. Currently, the reading has dropped below 15% — historically, this is a strong zone to look for long opportunities. I also showed the price of bitcoin at the moment in yellow.
Best regards EXCAVO
_____________________
Disclosure: I am part of Trade Nation's Influencer program and receive a monthly fee for using their TradingView charts in my analysis.
S&P500 INTRADAY resistance retest US stock futures are pointing higher after Monday's sharp selloff. Despite the bounce, safe-haven demand remains strong — gold hit a new record, and the yen strengthened past 140/USD for the first time since September.
Donald Trump called for immediate Fed rate cuts, warning that the economy could slow without action. He argued inflation is not a concern, citing falling energy and food prices, and criticized Fed Chair Jerome Powell once again.
The US reported “significant progress” on a trade deal with India after talks between VP JD Vance and PM Modi. The roadmap aims to ease trade tensions and potentially shield India from future US tariffs.
Key Support and Resistance Levels
Resistance Level 1: 5509
Resistance Level 2: 5660
Resistance Level 3: 5787
Support Level 1: 5110
Support Level 2: 4947
Support Level 3: 4816
This communication is for informational purposes only and should not be viewed as any form of recommendation as to a particular course of action or as investment advice. It is not intended as an offer or solicitation for the purchase or sale of any financial instrument or as an official confirmation of any transaction. Opinions, estimates and assumptions expressed herein are made as of the date of this communication and are subject to change without notice. This communication has been prepared based upon information, including market prices, data and other information, believed to be reliable; however, Trade Nation does not warrant its completeness or accuracy. All market prices and market data contained in or attached to this communication are indicative and subject to change without notice.
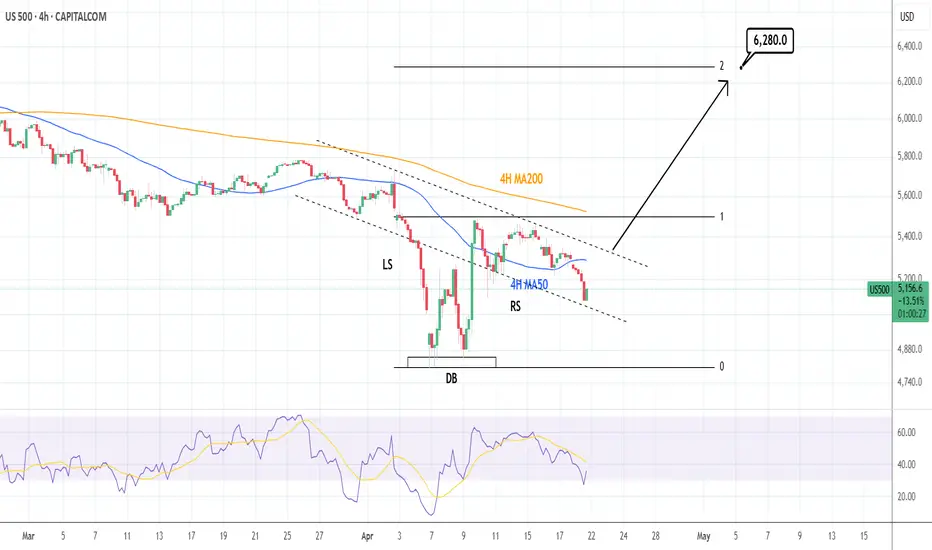
S&P500: Bottomed on an Inverse Head and Shoulders.The S&P500 index is bearish on its 1D technical outlook (RSI = 36.973, MACD = -126.240, ADX = 31.007) but long term appears to have bottomed on an Inverse Head and Shoulders pattern. In fact, the Head made a low on the Double Bottom and the bearish outlook is currently due to the Right Shoulder formation. A crossing over the dashed LH trendline and even better the 4H MA200, would aim for the 2.0 Fibonacci extension (TP = 6,280).
## If you like our free content follow our profile to get more daily ideas. ##
## Comments and likes are greatly appreciated. ##
US500's performance this week will be crucial in determiningUS500 Weekly Analysis
The US500 index is currently exhibiting bearish tendencies, but a crucial level to monitor is $5491. This level has the potential to act as a resistance point, and we're looking for a possible selling opportunity around this area. However, if the market breaks above $5491, it could signal a shift in bias towards bullish territory, potentially leading to a significant upward move.
Key Levels to Watch:
1. Sell Zone: $5491 - This level is critical in determining the next move. We'll be watching for confirmation to sell, such as bearish candlestick patterns or trend indicators.
2. Resistance Area: $5730 - $5790 - A strong resistance zone that could potentially cap upward movements.
Trading Strategy:
1. Wait for Confirmation: We'll wait for the market to reach the $5491 level and look for confirmation to sell. This could include bearish candlestick patterns, trend indicators, or other technical signals.
2. Breakout Scenario: If the market breaks above $5491, we'll reassess the bullish potential and look for opportunities to buy.
3. Risk Management: It's essential to manage risk effectively, setting stop-losses and take-profits according to our trading plan.
Market Outlook:
The US500's performance this week will be crucial in determining the next direction. We'll be monitoring the market closely, analyzing price action, and providing updates on any developments. Stay tuned for our analysis and guidance on potential trading opportunities.
By keeping a close eye on these key levels and waiting for confirmation, we can make more informed trading decisions and navigate the markets effectively.

US500 BULLISH SYMMETRICAL TRIANGLEhi
Fundamental view
The **US500 index** dropped due to several key factors affecting the U.S. stock market:
📉 **Tech Stock Decline** – Technology stocks faced heavy pressure, especially after **Nvidia** plunged **6.9%** due to U.S. restrictions on AI chip exports to China. Other stocks like **AMD (-7.3%)** and **Micron Technology (-2.4%)** also fell.
💰 **Federal Reserve Uncertainty** – Remarks from **Fed Chair Jerome Powell** raised concerns in the market. Powell warned that new tariffs could trigger higher inflation and slow economic growth, making investors uncertain about interest rate policies.
🛍️ **Surge in Retail Sales** – Retail sales jumped **1.4%** in March as consumers rushed to buy before new tariffs took effect. This highlights economic uncertainty, pushing investors to sell their stocks.
Overall, a mix of trade tensions, uncertain monetary policy, and a tech stock sell-off caused the **US500 index to drop 120.93 points (-2.24%)** on **April 16, 2025**.
Technical view
Yes, the **bullish symmetrical triangle** pattern is often a strong signal for upward price movement. When the price moves within this pattern, it usually indicates a **tightening volatility** before a **breakout**, which can present a good market entry opportunity.
🔍 **Breakout Confirmation**
1️⃣ Increased trading volume when price breaks above the **upper trendline**.
2️⃣ A closing candle above the **triangle resistance** for a valid signal.
3️⃣ Price targets can be measured using the pattern’s initial height as a projection.
📈 **Potential Price Movement**
If the breakout happens, the price could surge toward the next **resistance level**. However, if the breakout fails and price moves below support, the pattern could turn **bearish**.
Warren Buffett famously said, “Be greedy when others are fearful.”
good luck
**My trading strategy is not intended to be a signal. It's a process of learning about market structure and sharpening my trading my skills also for my trade journal**
Thanks a lot for your support

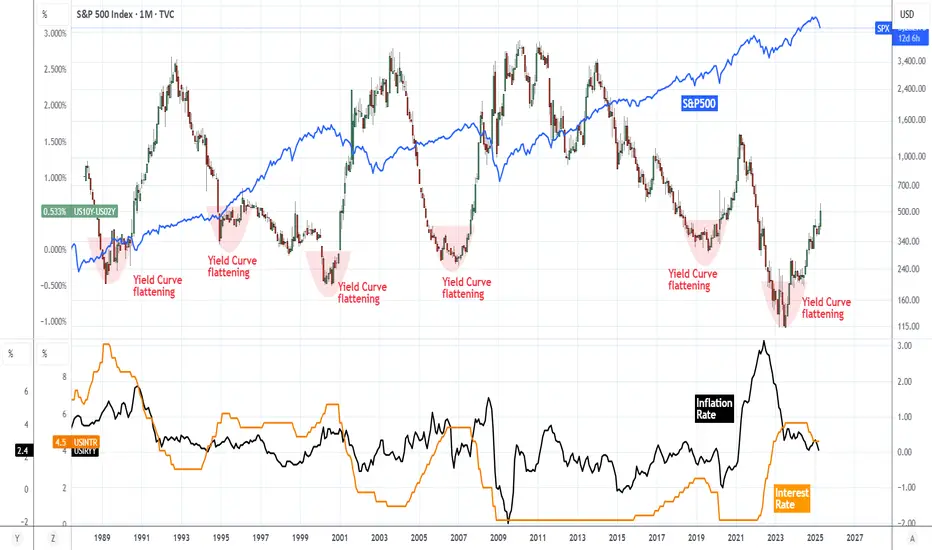
S&P500 Should the FED LEAVE POLITICS aside and finally cut??The S&P500 index (SPX, illustrated by the blue trend-line) has been under heavy selling pressure in the past 3 months, basically the start of the year, but Fed Chair Jerome Powell insisted once again yesterday that the Fed is on a wait-and-see mode, without the urge to cut rates. But can it afford not to do so?
A detailed look into the past 35 years of recorded Yield Curve (US10Y-US02Y) price action, shows that when it flattens and rebounds, the Fed steps in and cuts the interest rates (orange trend-line). It did so last year but paused/ stopped the process in an attempt to get Inflation (black trend-line) under control to the desired 2% target.
As you see on that 1M chart though, this hasn't always been beneficial for stocks as especially for September 2007 and January 2001, it took place parallel to the Housing and Dotcom Crises. This however happened both times when Inflation and Rates were both high.
The Inflation Rate now seems to be at a low level (and dropping) that has been consistent with market bottoms and not tops. As a result, it appears that it is more likely we are in a curve reversal that is consistent with bull trend continuation for the stock market, after short-term corrections, in our opinion either post March 2020 (COVID crash) or pre-2000, which is consistent to previous studies we've made that the current A.I. Bubble market is in similar early mania stages like the Dotcom Bubble in the early-mid 1990s.
So to answer the original question, we believe that the Fed can afford to cut the Interest Rates now and offset some of the medium-term slow in growth that the trade tariffs may inflict and as there are more probabilities it will do more good to the stock market than harm.
Your thoughts?
-------------------------------------------------------------------------------
** Please LIKE 👍, FOLLOW ✅, SHARE 🙌 and COMMENT ✍ if you enjoy this idea! Also share your ideas and charts in the comments section below! This is best way to keep it relevant, support us, keep the content here free and allow the idea to reach as many people as possible. **
-------------------------------------------------------------------------------
💸💸💸💸💸💸
👇 👇 👇 👇 👇 👇
S&P INTRADAY key resistance at 5509
Donald Trump said there was “big progress” in trade talks with Japan, easing fears of higher tariffs. This boosted the Nikkei 225, as traders grew less concerned about U.S. pressure for a stronger yen.
Meanwhile, U.S. stock futures pointed to a rebound after Wednesday’s selloff. The drop was sparked by Fed Chair Jerome Powell, who struck a cautious tone on tariffs and signaled no rush to cut rates, disappointing markets looking for quicker support.
Key Support and Resistance Levels
Resistance Level 1: 5509
Resistance Level 2: 5660
Resistance Level 3: 5787
Support Level 1: 5110
Support Level 2: 4947
Support Level 3: 4816
This communication is for informational purposes only and should not be viewed as any form of recommendation as to a particular course of action or as investment advice. It is not intended as an offer or solicitation for the purchase or sale of any financial instrument or as an official confirmation of any transaction. Opinions, estimates and assumptions expressed herein are made as of the date of this communication and are subject to change without notice. This communication has been prepared based upon information, including market prices, data and other information, believed to be reliable; however, Trade Nation does not warrant its completeness or accuracy. All market prices and market data contained in or attached to this communication are indicative and subject to change without notice.

S&P500 INTRADAY sideways consolidationThe Trump administration is moving ahead with tariff plans on semiconductor and pharmaceutical imports, launching Commerce Department probes. In response, China has ordered its airlines to halt new Boeing jet deliveries, escalating trade tensions.
Despite the trade war, markets are getting a lift after Trump suggested a possible pause on auto tariffs and suspended some consumer electronics tariffs.
Japan will meet with the U.S. this week to discuss trade. The talks will test whether close allies like Japan get more favourable treatment.
Earnings in Focus:
Citigroup and Bank of America report today, following a strong quarter for equity trading across the sector.
Johnson & Johnson and United Airlines are also set to report.
Oil Market:
The International Energy Agency has cut its 2024 oil demand forecast due to trade-related slowdowns and sees a potential supply surplus through 2026.
Key Support and Resistance Levels
Resistance Level 1: 5509
Resistance Level 2: 5660
Resistance Level 3: 5787
Support Level 1: 5110
Support Level 2: 4947
Support Level 3: 4816
This communication is for informational purposes only and should not be viewed as any form of recommendation as to a particular course of action or as investment advice. It is not intended as an offer or solicitation for the purchase or sale of any financial instrument or as an official confirmation of any transaction. Opinions, estimates and assumptions expressed herein are made as of the date of this communication and are subject to change without notice. This communication has been prepared based upon information, including market prices, data and other information, believed to be reliable; however, Trade Nation does not warrant its completeness or accuracy. All market prices and market data contained in or attached to this communication are indicative and subject to change without notice.

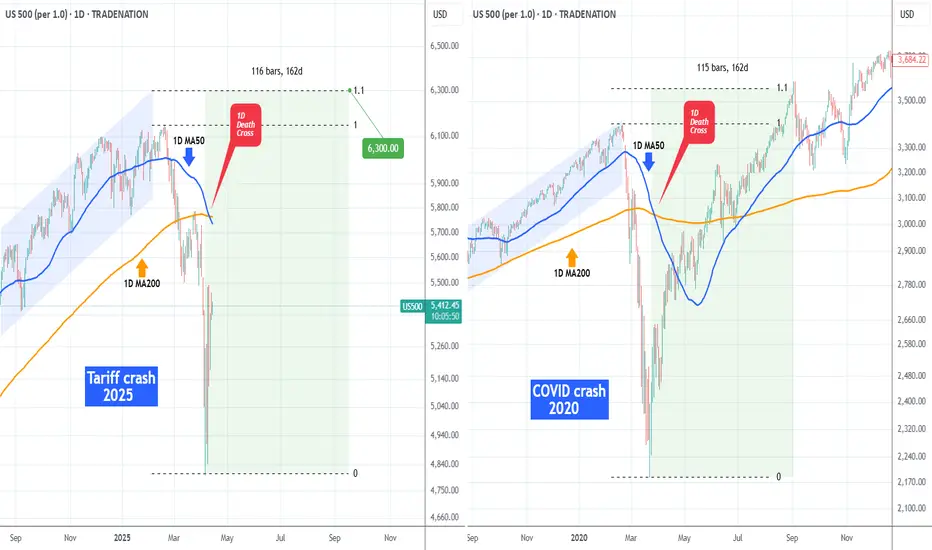
S&P500 1D Death Cross formed! Market COLLAPSE or Bear TRAP? The S&P500 index (SPX) is attempting to recover from the April 07 2025 market low, following the 90-day Tariff pause.
Last Thursday however it formed a Death Cross on the 1D time-frame, he first since May 11 2022, which was during the last Inflation Crisis correction. That was nothing like the current crash though as it was a technical 1-year Bear Cycle in contrast to today which is a flash crash inflicted by Trump's tariffs.
What looks though most similar to today is the 2020 COVID crash. Equally fast and brutal, that sell-off also took place under an extreme pressure environment of uncertainty (economic lockdowns) which the world has never seen, similar to today's tariffs that admittedly have put (for the moment) an end to the U.S. - China trade.
The COVID crash phase also formed a 1D Death Cross just 4 days after the March 23 2020 bottom. Last Thursday's 1D Death Cross came also just 3 days after the April 07 2025 Low. If this pattern of extreme market shock is a repetitive model under such fundamental events, then the stock market has bottomed. And if it follows the exact same recovery pattern as post-COVID, then it may reach the 1.1 Fibonacci extension at 6300 in a little over 5 months (162 days).
-------------------------------------------------------------------------------
** Please LIKE 👍, FOLLOW ✅, SHARE 🙌 and COMMENT ✍ if you enjoy this idea! Also share your ideas and charts in the comments section below! This is best way to keep it relevant, support us, keep the content here free and allow the idea to reach as many people as possible. **
-------------------------------------------------------------------------------
Disclosure: I am part of Trade Nation's Influencer program and receive a monthly fee for using their TradingView charts in my analysis.
💸💸💸💸💸💸
👇 👇 👇 👇 👇 👇
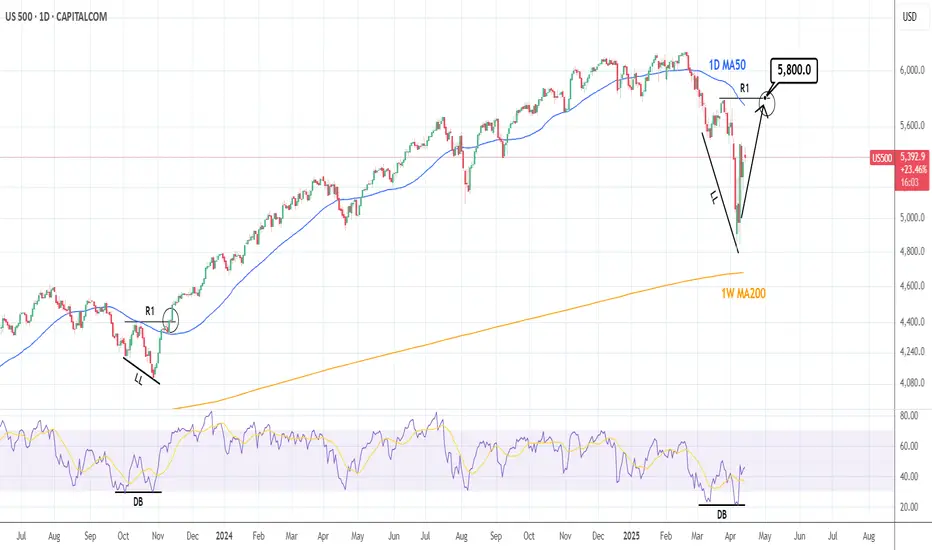
S&P500: Bottom is in. 5,800 Target imminent.S&P500 is almost neutral on its 1D technical outlook (RSI = 44.927, MACD = -131.940, ADX = 29.116) as it has recovered from the tariff selloff, finding support a little over the 1W MA200. The 1D RSI made a double bottom and is much like the October 27th 2023 bottom. Both DB bullish divergences in contrast to the LL of the price. The immediate target on the rebound that followed in 2023 was the R1 level. Trade: long, TP = 5,800.
## If you like our free content follow our profile to get more daily ideas. ##
## Comments and likes are greatly appreciated. ##
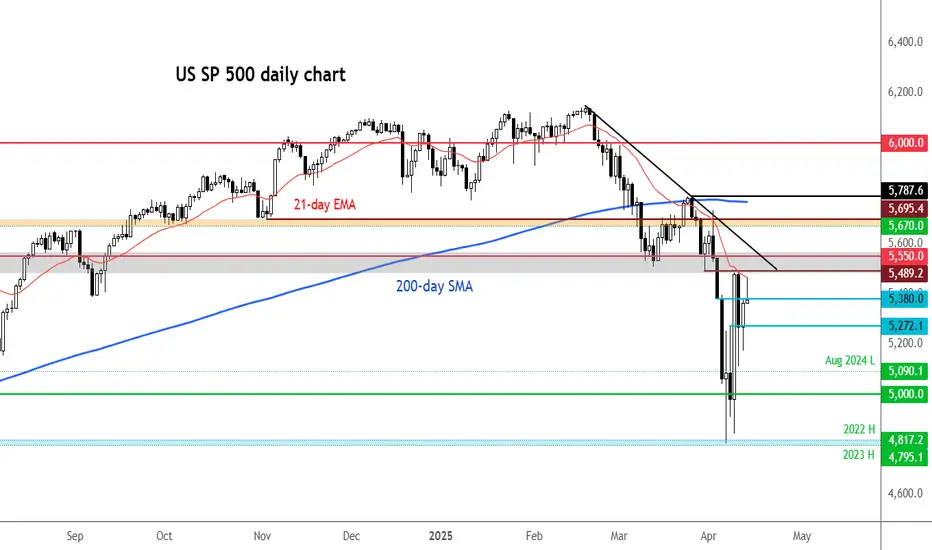
S&P 500 off earlier highsThe major US indices have come noticeably off their earlier highs, following the positive start on the back of the weekend news of temporary tariff relief on technology sector.
The fact the indices could break out to test waters above last week's highs, suggests traders have not been convinced that they have had the all-clear just yet. Perhaps volatility will ease a little this week, but with earnings from tech giants to come in the next couple of weeks, on top of all the trade war saga, anything is possible. Traders must remain nimble.
It is all about the 5380 level now on the S&P 500. This is where it found resistance on Friday and now this level could turn into support. But if we break decisively below it again, then this could trigger a big of selling towards the next support at 5272.
However, the near-term trend has turned bullish following the big recovery last week. So, dip-buyers will be lurking. Let's see where we go from here.
In any case, more bullish price action is needed to completely nullify the bearish control. Specifically, the key resistance zone between 5490 to 5550 must give way before the bulls can be confident that we have see a major low last week.
By Fawad Razaqzada, market analyst with FOREX.com