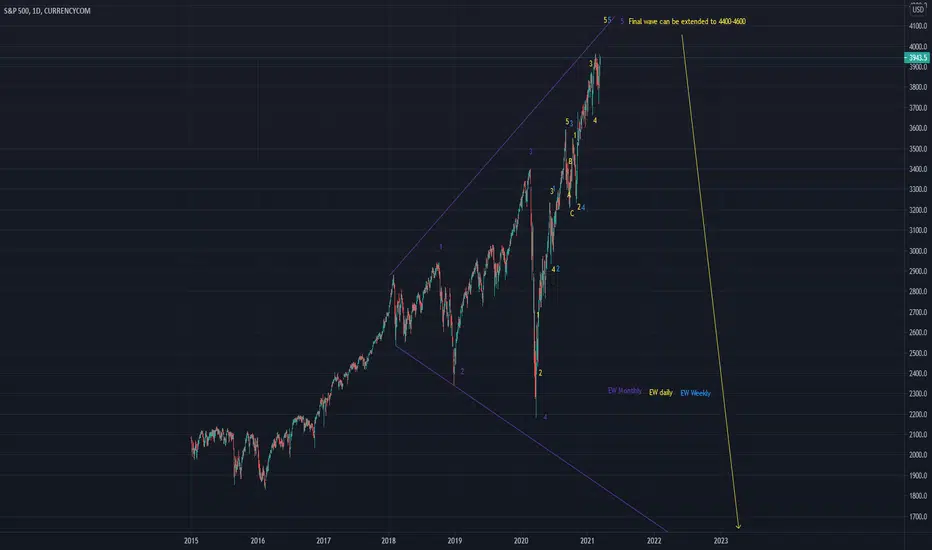
SP500 Lifetime OpportunityHi there,
SP500 at the moment is a clear buy with target above 4000
If we pay attention to the DXY chart, we are starting a uptrend but still on sideways moment, which SP500 due to many retails shorting it, has been making new highs every week, as long as dollar is weak it will keep doing it, but dollar is soon ending this sideways market to start an uptrend.
SP500 then will top at that moment
If we look at the elliot wave theory, we are in the final phase, Blow off, close to a top to begin then a new trend.
This is a long term view, if your looking to sell it, sell only at the mentioned wave 5, near it.
Good luck
Us500signal

US 500 HAS REACHED THE LOWER SIDE OF THE TRENDLINE WHO WILL WIN?US500
Has reached the lower side of the trend line which is a critical level for both bull and bear.If the trendline was broken we can expect downward rally if the bull managed to hold the ground from the trendline support it will bounce back towards North.
Tell us your opinion about NASDAQ in the comment section

US500Hello Traders, here is the full analysis for this pair, let me know in the comment section below if you have any questions, the entry will be taken only if all rules of the strategies will be satisfied. I suggest you keep this pair on your watchlist and see if the rules of your strategy are satisfied


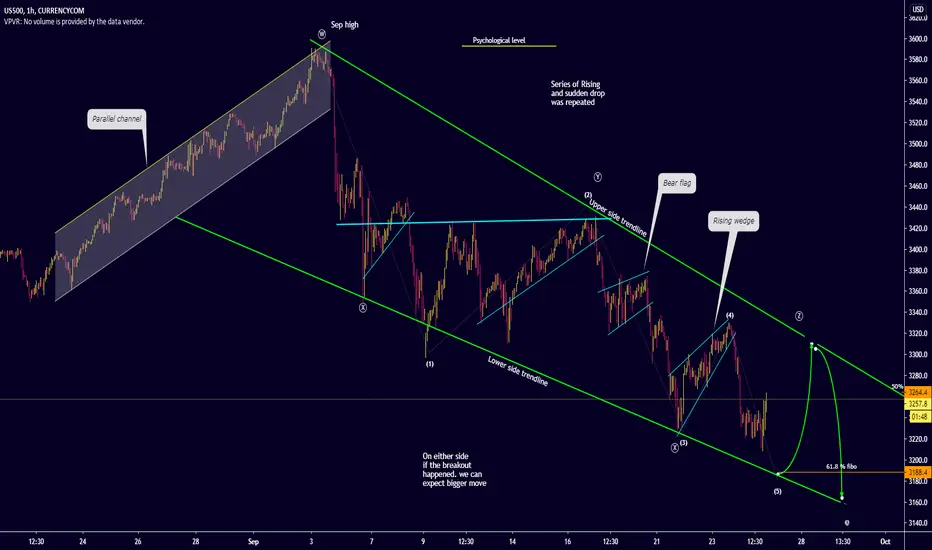
US500 series of rising and sudden drop happeningUS500
As the economic activity hasn't picked up as expected in second quarter of this year. In some part of the US the economic slow down is further accelerating and many of the skilled and non skilled workers are unable to return to the duty. This has reflected in company growth and overall economic growth is still intact as earlier forecasted by OECD.
After reaching the September high around 3600.00 (which is a key psychological level) the trend has reversed towards south as the pause in vaccine development and the surging of daily virus cases
We can see a series of rising and sudden drop in the prices with the bear flag formations. And trading in a downward channel. I am expecting that the price will continue to run lower towards 3000.00 level. From this level we can expect shift in the momentum towards bullish
The price is currently trading below the 50% Fibonacci and the next downside target would be 61.8% Fibonacci level comes around 3188.00
--------------------------------------------------------------------------------------------------------------------------------------------------------------------------------------------------
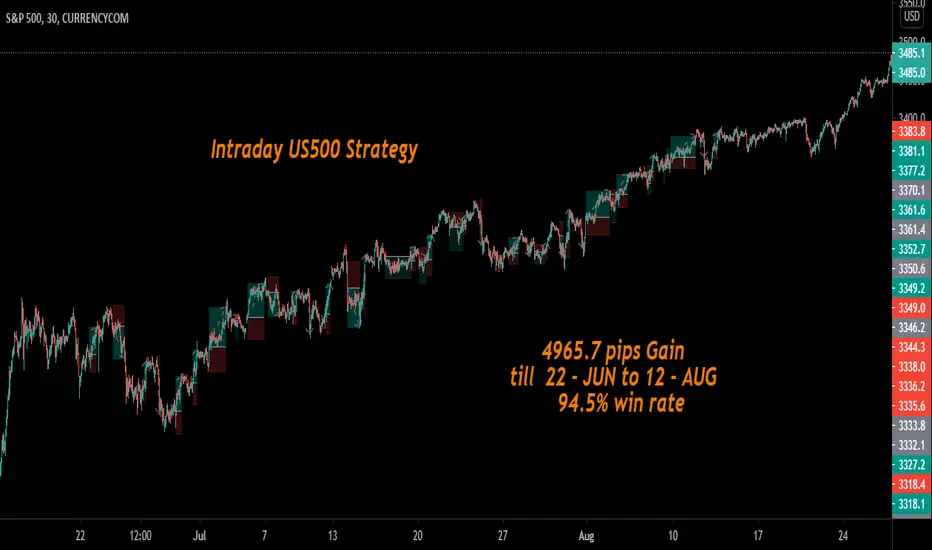
Please give us a thumbs up if u like our work and do follow us so that you can get a regular update about upcoming setups and ideas
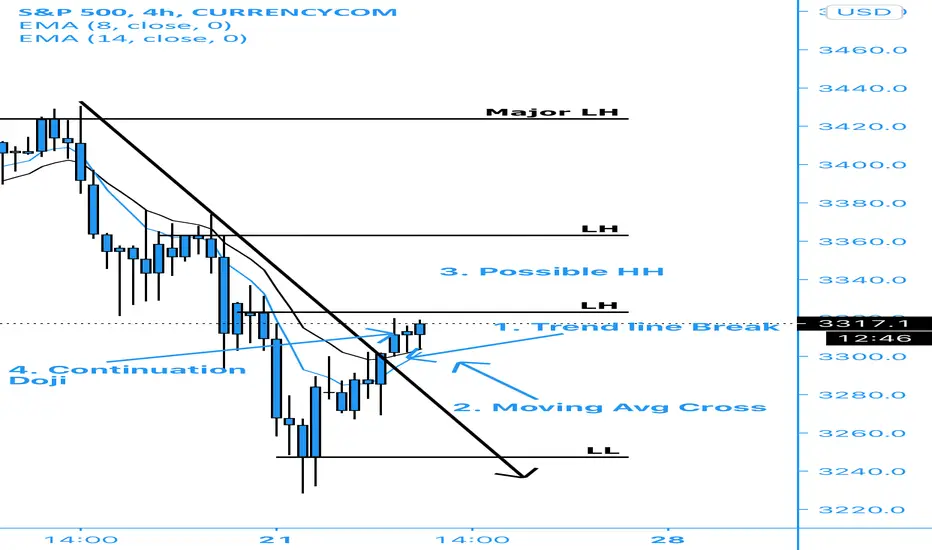
Going Long US500Just entered a long position based off these 4 confluences:
1. Trend line was broken
2.Moving avg crossover
3.Possible HH
4. Continuation Doji
When this 4H candle closes as a Doji or bullish market structure will have been broken and my target would be the major LH for my exit, That’s a little over 100 points.wait for the 4H close for confirmation👍🏽