Gold will make a Low for the Week before Pushing BullishOn my previous Update I mention that we should have support off this H4 Gap. My problem with it s it immediately reacted to it when the market opened back up. well before the killzone. So I feel like this is a fake out to go short for now. they will make a low for the week then we will see it set up for the bullish move.
USD (US Dollar)

Bullish bounce off pullback support?USD/CAD is falling towards the support level which is a pullback support that lines up with the 38.2% Fibonacci retracement and could bounce from this level to our take profit.
Entry: 1.3681
Why we like it:
There is a pullback support level that aligns with the 38.2% Fibonacci retracement.
Stop loss: 1.3645
Why we like it:
There is a pullback support that lines up with the 61.8% Fibonacci retracement.
Take profit: 1.3782
Why we like it:
There is a pullback resistance.
Enjoying your TradingView experience? Review us!
Please be advised that the information presented on TradingView is provided to Vantage (‘Vantage Global Limited’, ‘we’) by a third-party provider (‘Everest Fortune Group’). Please be reminded that you are solely responsible for the trading decisions on your account. There is a very high degree of risk involved in trading. Any information and/or content is intended entirely for research, educational and informational purposes only and does not constitute investment or consultation advice or investment strategy. The information is not tailored to the investment needs of any specific person and therefore does not involve a consideration of any of the investment objectives, financial situation or needs of any viewer that may receive it. Kindly also note that past performance is not a reliable indicator of future results. Actual results may differ materially from those anticipated in forward-looking or past performance statements. We assume no liability as to the accuracy or completeness of any of the information and/or content provided herein and the Company cannot be held responsible for any omission, mistake nor for any loss or damage including without limitation to any loss of profit which may arise from reliance on any information supplied by Everest Fortune Group.

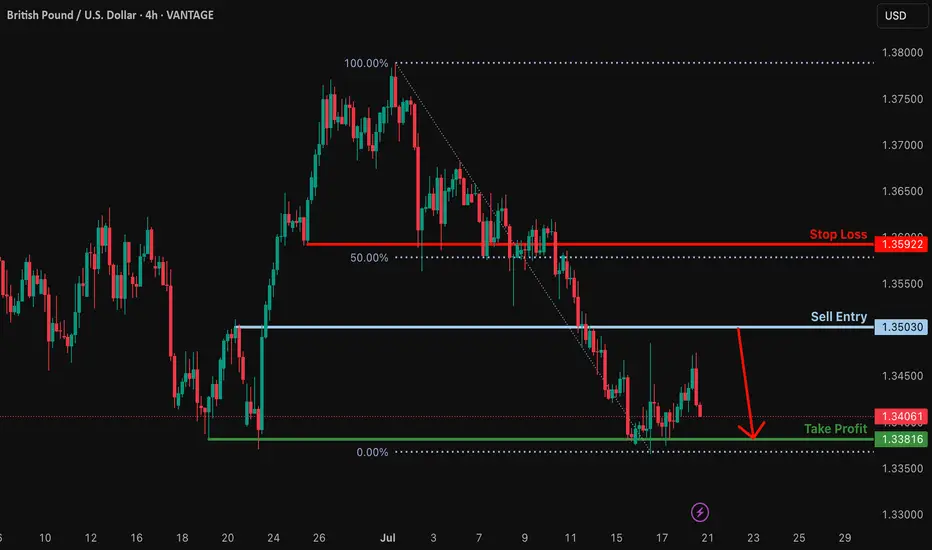
Bearish reversal off pullback resistance?GBP/USD is rising towards the resistance which is a pullback resistance and could drop from this level to our take profit.
Entry: 1.3603
Why we like it:
There is a pullback resistance level.
Stop loss: 1.3592
Why we like it:
There is a pullback resistance that is slightly above the 50% Fibonacci retracement.
Take profit: 1.3361
Why we like it:
There is a pullback support.
Enjoying your TradingView experience? Review us!
Please be advised that the information presented on TradingView is provided to Vantage (‘Vantage Global Limited’, ‘we’) by a third-party provider (‘Everest Fortune Group’). Please be reminded that you are solely responsible for the trading decisions on your account. There is a very high degree of risk involved in trading. Any information and/or content is intended entirely for research, educational and informational purposes only and does not constitute investment or consultation advice or investment strategy. The information is not tailored to the investment needs of any specific person and therefore does not involve a consideration of any of the investment objectives, financial situation or needs of any viewer that may receive it. Kindly also note that past performance is not a reliable indicator of future results. Actual results may differ materially from those anticipated in forward-looking or past performance statements. We assume no liability as to the accuracy or completeness of any of the information and/or content provided herein and the Company cannot be held responsible for any omission, mistake nor for any loss or damage including without limitation to any loss of profit which may arise from reliance on any information supplied by Everest Fortune Group.
XAUUSD 4Hour TF - July 20th, 2025XAUUSD 7/20/2025
XAUUSD 4 hour Long Idea
Monthly - Bullish
Weekly - Bullish
Daily - Bullish
4hour - Bullish
GOLD,GOLD,GOLD. This thing has been bullish on all timeframes and doesn’t really show any signs of stopping just yet.
We can see two scenarios for the week ahead so let’s dive in:
Bullish continuation - Price action on gold is breaking out of a descending triangle pattern. This is a strong bullish move but for us to consider trades we want the confirmation.
Look for a retest of our 61.8% fib level and mostly recently broken structure. If we can spot bullish conviction coming off this level we can then consider targeting higher resistance levels like 3.395.000. Our -27% fib level lines up with this zone as well.
Bearish Reversal - For us to consider Gold bearish again we would need to see something very convincing. If we did see a break below 3,320.000 with a confirmed lower high I would then consider short scenarios.
Look to target toward major support levels on the way down to 3,225.000, our next monthly support zone.

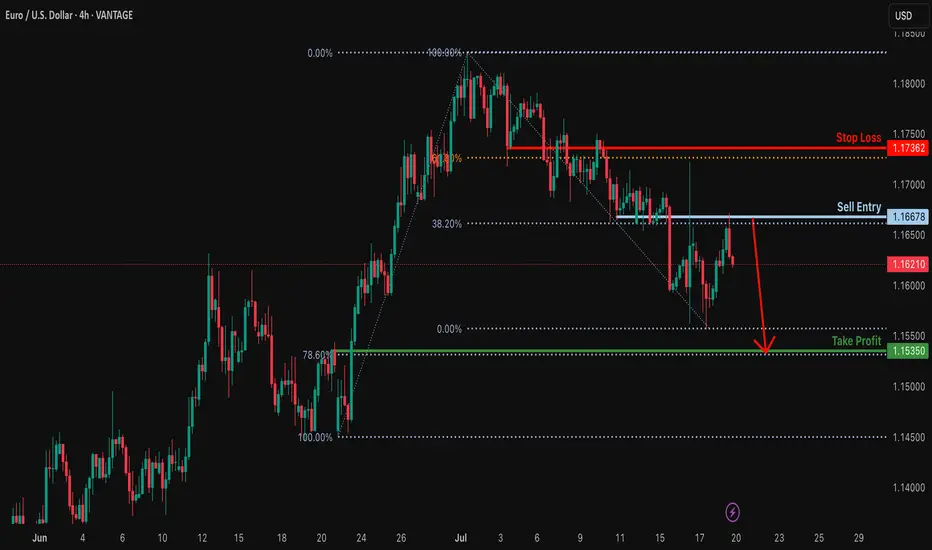
Bearish drop?EUR/USD has rejected off the resistance level which is a pullback resistance that lines up with the 38.2% Fibonacci retracement and could drop from this level to our tale profit.
Entry: 1.1667
Why we like it:
There is a pullback resistance that aligns with the 38.2% Fibonacci retracement.
Stop loss: 1.1736
Why we like it:
There is an overlap resistance that aligns with the 61.8% Fibonacci retracement.
Take profit: 1.1535
Why we like it:
There is a pullback support that lines up with the 78.6% Fibonacci retracement.
Enjoying your TradingView experience? Review us!
Please be advised that the information presented on TradingView is provided to Vantage (‘Vantage Global Limited’, ‘we’) by a third-party provider (‘Everest Fortune Group’). Please be reminded that you are solely responsible for the trading decisions on your account. There is a very high degree of risk involved in trading. Any information and/or content is intended entirely for research, educational and informational purposes only and does not constitute investment or consultation advice or investment strategy. The information is not tailored to the investment needs of any specific person and therefore does not involve a consideration of any of the investment objectives, financial situation or needs of any viewer that may receive it. Kindly also note that past performance is not a reliable indicator of future results. Actual results may differ materially from those anticipated in forward-looking or past performance statements. We assume no liability as to the accuracy or completeness of any of the information and/or content provided herein and the Company cannot be held responsible for any omission, mistake nor for any loss or damage including without limitation to any loss of profit which may arise from reliance on any information supplied by Everest Fortune Group.
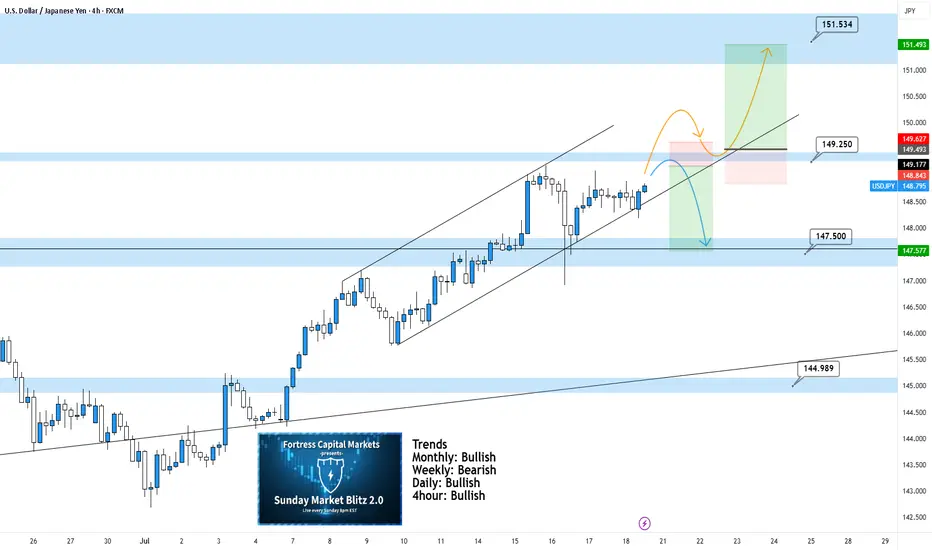
USDJPY 4Hour TF - July 20th,2025USDJPY 7/20/2025
USDJPY 4Hour Neutral Idea
Monthly - Bullish
Weekly - Bearish
Daily - Bullish
4Hour - Bullish
UJ is looking better than a couple weeks ago and at least we can spot some decent setups for the week ahead. These are NOT perfect setups but we have two scenarios that we are ready for if price action shows it is ready too. Here are the two scenarios we’re looking at for the week:
Bullish Continuation - We can see UJ in a nice 4hour channel but we are currently seeing a bit of flat price action. For us to consider UJ long setups again we would need to be convinced. Look for a break above our 149.250 zone with a confirmed higher low above. This would be enough to consider longs and target higher toward key levels of resistance.
Bearish Reversal - If price action continues to stall, this bearish setup will become more and more likely. Ideally, we want to see some strong rejection from our 149.250. If this happens look to target lower toward 147.500.
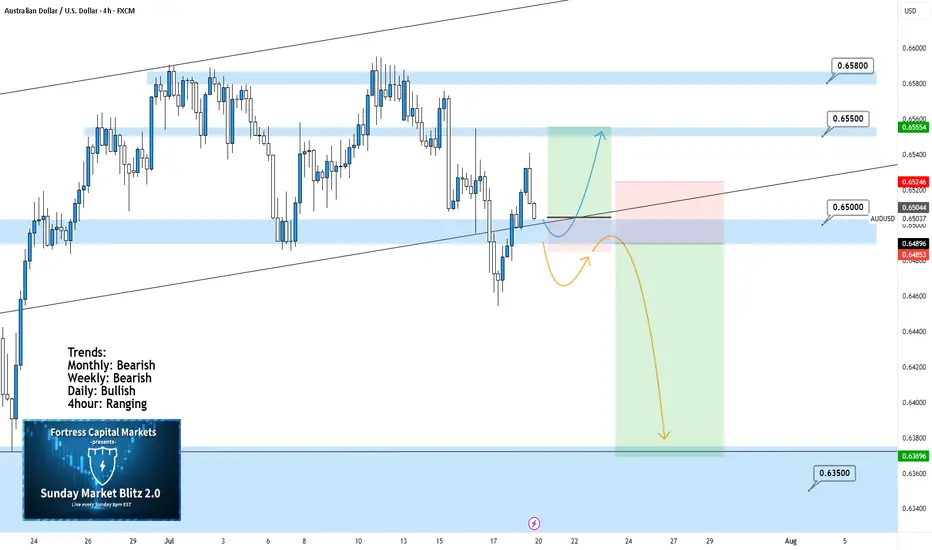
AUDUSD 4Hour TF - July 20th, 2025AUDUSD 7/20/2025
AUDUSD 4hour Neutral idea
Monthly - Bearish
Weekly - Bearish
Dailly - Bullish
4hour - Ranging
We’re looking at a fairly large range here on AU and although the higher timeframe suggests a potential bearish move, I am unsure until we have some clarity around 0.65000. Here are two scenarios that break down what could happen this week and how 0.65000 plays into it:
Range Continuation - Since late June we have seen price action establish this large range and stick to it (0.65800 Resistance & 0.65000 Support).
Currently, we can see price action attempting to break 0.65000 support but it has not done so yet. If we don’t break below 0.65000 early this week it is very likely we will see a rally into the top of the range.
Bearish Breakout - This is the setup we want to see play out this week as it presents a beauty of a trade.
For us to see AU as bearish on the 4hour we need to see a clear break below 0.65000 with a confirmed lower high below. If this happens look to target toward major support levels like 0.63500 area.
DXY 4Hour TF - July 20th, 2025DXY 7/20/2025
DXY 4hour Neutral Idea
Monthly - Bearish
Weekly - Bearish
Dailly - Bearish
4hour - Bullish
Higher timeframe trend analysis suggests that DXY is primarily bearish and is currently retracing to potential resistance.
Going into this week we are looking to see if our 98.000 zone will stay as support or transition into resistance. Here are two scenarios which highlight both a bullish and bearish outcome:
Bullish Continuation - Last week we saw a strong rally through our 98.000 zone which seems to still be holding. If this 4hour bullish trend is to continue we would like to see some sort of rejection off 98.000 support while also confirming a higher low. If this happens look to target higher toward major resistance levels like 99.250.
Bearish Reversal- If we are to consider DXY bearish again on the 4hour we would need to see a break below 98.000 support and confirm this level as new resistance.
There are a few major support levels to watch out for but DXY has the potential to fall dramatically if we see price get below 97.500.

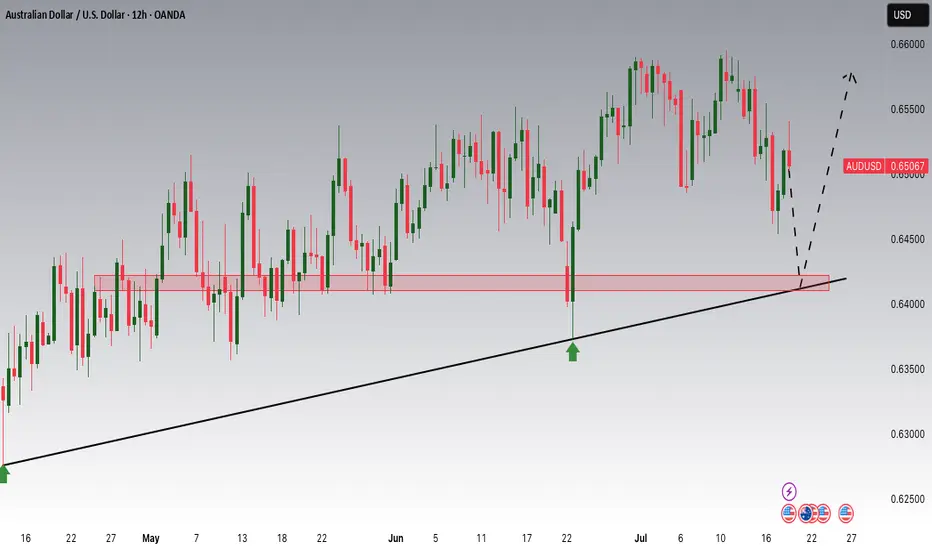
AUDUSD Potential UpsidesHey Traders, in tomorrow's trading session we are monitoring AUDUSD for a buying opportunity around 0.64200 zone, AUDUSD is trading in an uptrend and currently is in a correction phase in which it is approaching the trend at 0.64200 support and resistance area.
Trade safe, Joe.
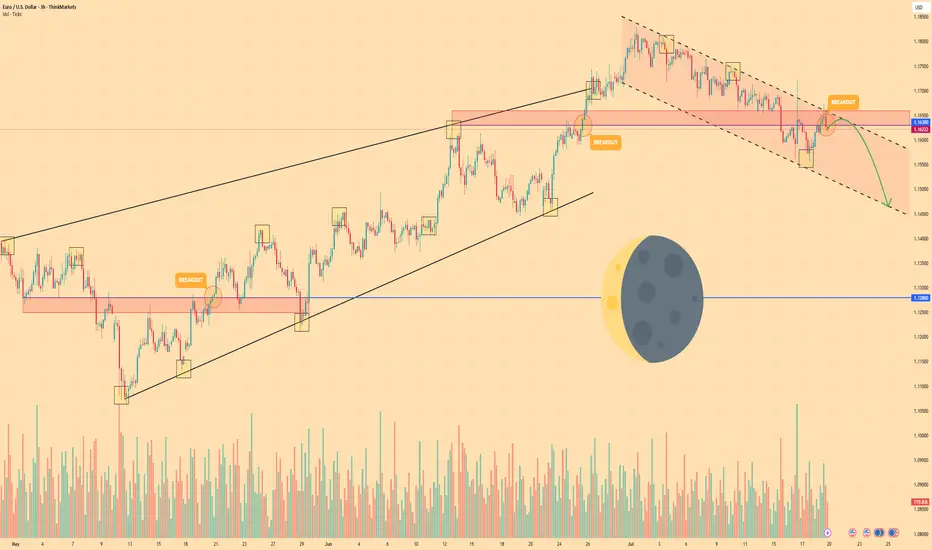
EURO - Price can continue to decline in falling channelHi guys, this is my overview for EURUSD, feel free to check it and write your feedback in comments👊
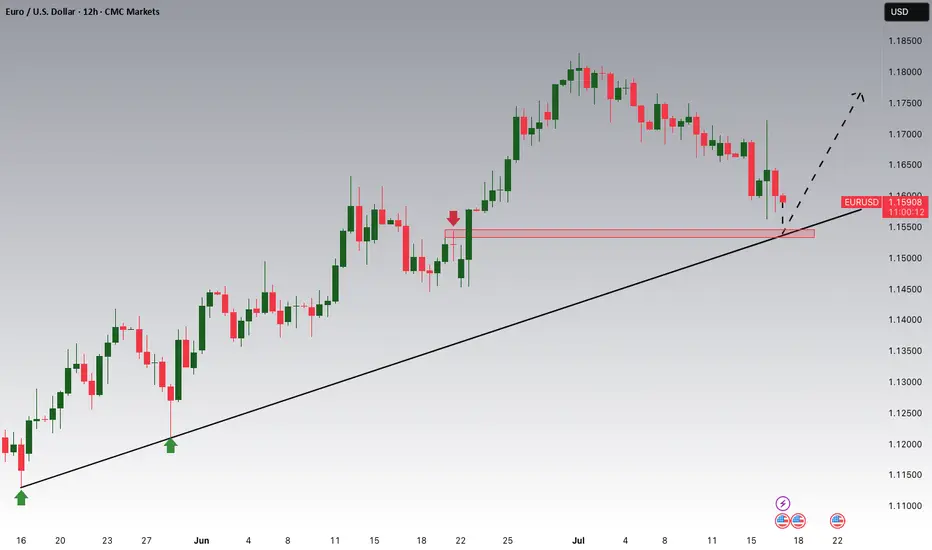
For a long time, the price was moving within a large ascending wedge, showing a gradual upward trend.
However, buyers failed to maintain momentum, and the price made a decisive breakout below the wedge's support line.
Following the breakout, the instrument established a new structure, a local falling channel, and has been trading within its boundaries since.
Currently, the price is in a corrective upward move, approaching the key resistance area of $1.1630 - $1.1660.
This zone is significant as it aligns with a previous support level and the upper boundary of the current falling channel.
I expect that the price will face rejection from this resistance area and will then continue its decline towards the channel's support line, targeting the $1.1465 level.
If this post is useful to you, you can support me with like/boost and advice in comments❤️
Disclaimer: As part of ThinkMarkets’ Influencer Program, I am sponsored to share and publish their charts in my analysis.
BITCOIN - Price can bounce up from support line to $125000Hi guys, this is my overview for BTCUSD, feel free to check it and write your feedback in comments👊
For a long time, the price was trading sideways inside a wide flat range between the $99000 support area and the $112000 resistance level.
After accumulating volume, bitcoin made a strong upward impulse and performed a breakout, pushing above the top of the flat.
Following this movement, the price action began to form a rising wedge pattern, moving between its clear support and resistance lines.
Recently, price tested the resistance line of the wedge and then started a predictable correction back down towards support.
Now, BTC is approaching the support line of the wedge, which aligns with the important horizontal support area around $112000-$113500.
I expect that the price can test this support line and then bounce up to the $125000 resistance line of the wedge.
If this post is useful to you, you can support me with like/boost and advice in comments❤️
Disclaimer: As part of ThinkMarkets’ Influencer Program, I am sponsored to share and publish their charts in my analysis.

HelenP I. Gold will little correct and then rise to top of wedgeHi folks today I'm prepared for you Gold analytics. If we look at the chart, we can see a clear ascending wedge pattern that has been guiding the price action. The structure is well-defined by a lower trend line providing consistent support and an upper resistance line. I believe that the key area to watch right now is the support zone between 3310 and 3295 points. The logic is that after the recent push, the price may undergo a small, healthy correction to test this zone's strength. The condition for our bullish scenario to unfold is a successful hold of this support; a bounce or signs of buyer interest in this area would be the confirmation we are looking for. Once this condition is met, I believe that gold will have enough momentum to continue its upward movement within the confines of the wedge. Therefore, the main goal for this scenario is set at 3415 points. This target is not arbitrary; it directly coincides with the resistance line of the wedge, which represents a logical point for the current upward swing to conclude. If you like my analytics you may support me with your like/comment.❤️
Disclaimer: As part of ThinkMarkets’ Influencer Program, I am sponsored to share and publish their charts in my analysis.

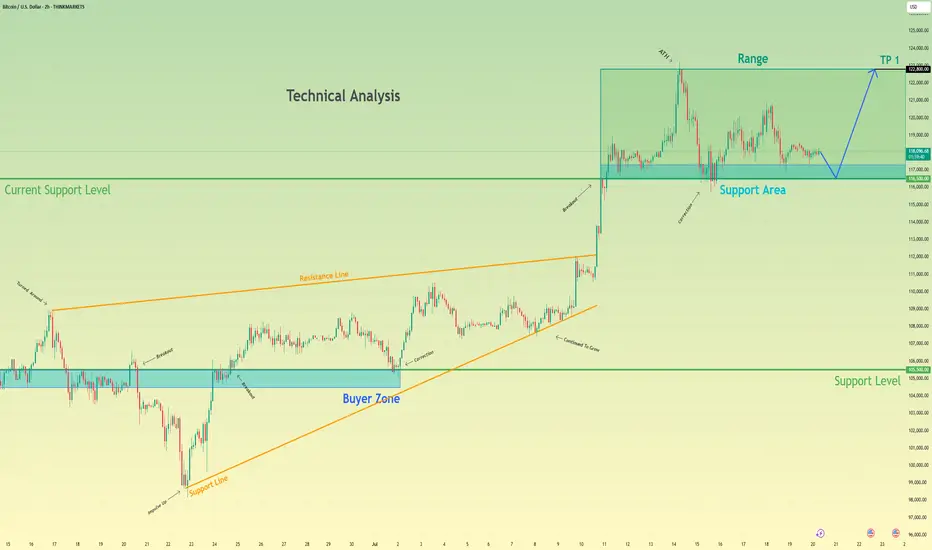
Bitcoin may bounce up from support area to 122800 pointsHello traders, I want share with you my opinion about Bitcoin. Analyzing the broader market context on the BTC chart, the past price action has carved out two significant technical structures: a wide trading range and a larger upward wedge pattern. The formation of this wedge indicates a generally positive market sentiment, though the narrowing price swings suggest a decrease in upward momentum. The foundation of the current structure was established around the buyer zone of 105500 - 104500, a level that has historically proven to be a robust floor. This historical behavior provides a critical reference for our hypothesis. Currently, we are observing bitcoin's price action closely, interacting with the current support area, located between 116500 and 117300. The character of the movement here is largely corrective and consolidative, pointing to a state of temporary equilibrium. This consolidation near the lower boundary of the wedge is a pivotal point. My thinking is that a final, brief dip to thoroughly test the 116500 - 117300 support area is a high-probability scenario. Such a move would effectively absorb remaining sell-side liquidity before a reversal. We can then anticipate an impulsive move upwards across the range. Therefore, the logical take-profit for this long position is set at 122800 points, as this level marks the upper resistance of the range and a natural target. Please share this idea with your friends and click Boost 🚀
Disclaimer: As part of ThinkMarkets’ Influencer Program, I am sponsored to share and publish their charts in my analysis.
USD Is Still Bullish! Wait For Buys!Welcome back to the Weekly Forex Forecast for the week of July 21-25th.
In this video, we will analyze the following FX market:
USD
The DXY has run bullish last week, up into an area of Supply, where the momentum hesitates now. Next week may pull back a bit... before continuing higher to the buy side liquidity.
Look out for the short term pullback to the W +FVG for a high probability move higher!
Enjoy!
May profits be upon you.
Leave any questions or comments in the comment section.
I appreciate any feedback from my viewers!
Like and/or subscribe if you want more accurate analysis.
Thank you so much!
Disclaimer:
I do not provide personal investment advice and I am not a qualified licensed investment advisor.
All information found here, including any ideas, opinions, views, predictions, forecasts, commentaries, suggestions, expressed or implied herein, are for informational, entertainment or educational purposes only and should not be construed as personal investment advice. While the information provided is believed to be accurate, it may include errors or inaccuracies.
I will not and cannot be held liable for any actions you take as a result of anything you read here.
Conduct your own due diligence, or consult a licensed financial advisor or broker before making any and all investment decisions. Any investments, trades, speculations, or decisions made on the basis of any information found on this channel, expressed or implied herein, are committed at your own risk, financial or otherwise.

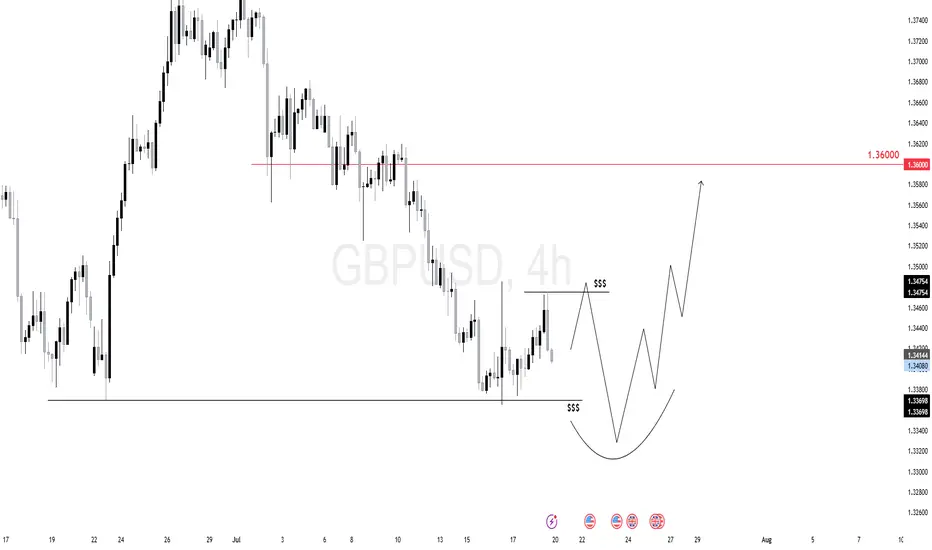
$GU (GBPUSD) 4HGBPUSD is forming a potential reversal structure with liquidity resting above and below the current range.
We expect a move to grab short-term liquidity above 1.3475 followed by a sweep of lows near 1.3369.
This would complete a rounded bottom structure, setting the stage for a bullish reversal.
Once the low is swept and buyers step in, the target sits around the 1.3600 handle.
EURUSD is Nearing an Important Support!!Hey Traders, in today's trading session we are monitoring EURUSD for a buying opportunity around 1.15400 zone, EURUSD is trading in an uptrend and currently is in a correction phase is in a correction phase in which it is approaching the trend at 1.15400 support and resistance area.
Trade safe, Joe.
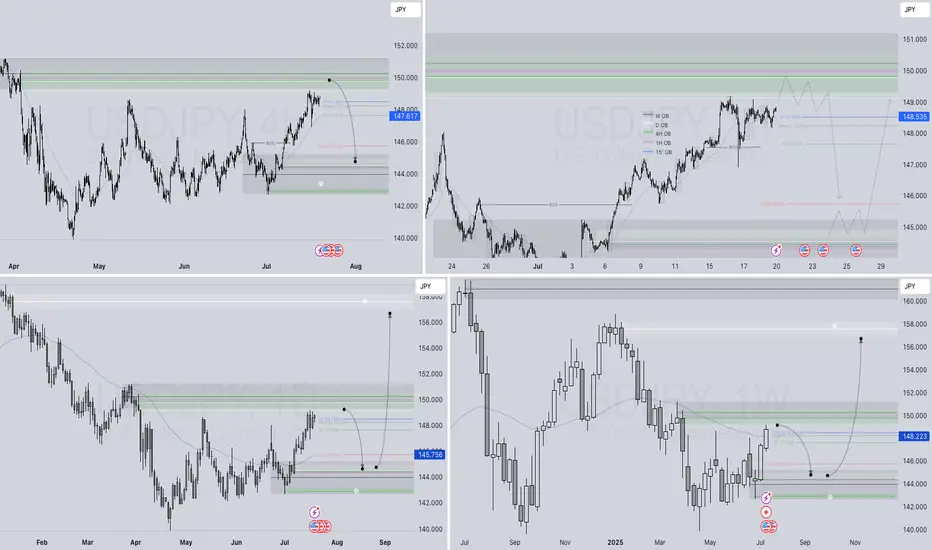
USDJPY – WEEKLY FORECAST Q3 | W30 | Y25📊 USDJPY – WEEKLY FORECAST
Q3 | W30 | Y25
Weekly Forecast 🔍📅
Here’s a short diagnosis of the current chart setup 🧠📈
Higher time frame order blocks have been identified — these are our patient points of interest 🎯🧭.
It’s crucial to wait for a confirmed break of structure 🧱✅ before forming a directional bias.
This keeps us disciplined and aligned with what price action is truly telling us.
📈 Risk Management Protocols
🔑 Core principles:
Max 1% risk per trade
Only execute at pre-identified levels
Use alerts, not emotion
Stick to your RR plan — minimum 1:2
🧠 You’re not paid for how many trades you take, you’re paid for how well you manage risk.
🧠 Weekly FRGNT Insight
"Trade what the market gives, not what your ego wants."
Stay mechanical. Stay focused. Let the probabilities work.
FRGNT FOREX ANALYSIS 📊
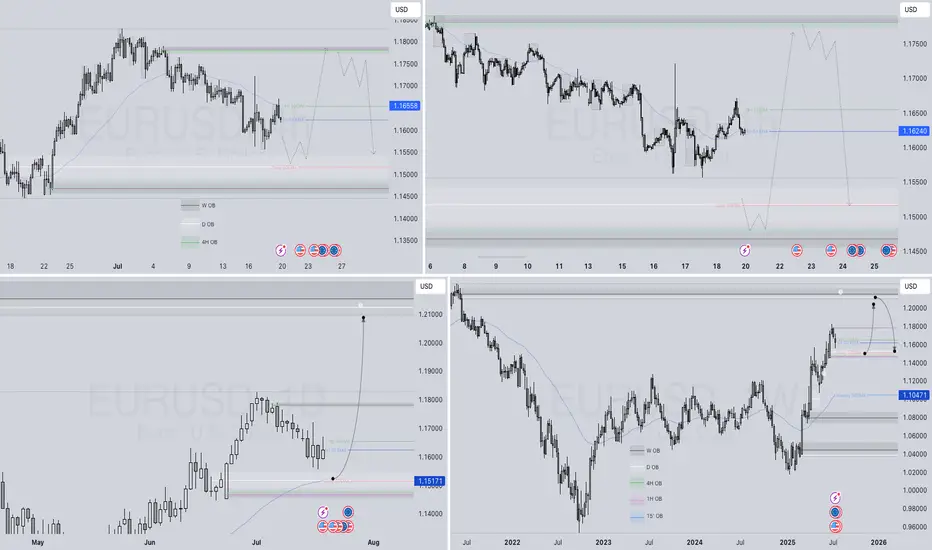
EURUSD – WEEKLY FORECAST Q3 | W30 | Y25📊 EURUSD – WEEKLY FORECAST
Q3 | W30 | Y25
Weekly Forecast 🔍📅
Here’s a short diagnosis of the current chart setup 🧠📈
Higher time frame order blocks have been identified — these are our patient points of interest 🎯🧭.
It’s crucial to wait for a confirmed break of structure 🧱✅ before forming a directional bias.
This keeps us disciplined and aligned with what price action is truly telling us.
📈 Risk Management Protocols
🔑 Core principles:
Max 1% risk per trade
Only execute at pre-identified levels
Use alerts, not emotion
Stick to your RR plan — minimum 1:2
🧠 You’re not paid for how many trades you take, you’re paid for how well you manage risk.
🧠 Weekly FRGNT Insight
"Trade what the market gives, not what your ego wants."
Stay mechanical. Stay focused. Let the probabilities work.
FRGNT FOREX ANALYSIS 📊
#013: Long Investment Opportunity on GBP/USD
In this article, I want to share the complete trading logic that led me to place a long order on GBP/USD, applying my proprietary SwipeUP v9.3.1 Elite FX model.
I won't discuss specific levels, but only the logical structure, because the goal is to demonstrate how hedge funds think and why waiting is sometimes more profitable than impulsive entry.
🔍 Phase 1 – Manipulation has already occurred
GBP/USD recently formed a technical double bottom, with a long shadow that chased away the stops placed by the most reactive retail investors. This is a clear signal: the first phase of manipulation is complete.
You don't enter immediately after a shadow: you wait for the market to return to seek residual liquidity, simulating a new decline.
📉 Phase 2 – The expected institutional dump
Before the real movement begins, I expect the price to be pushed lower again. This push serves only to:
trigger the stops of longs who entered too early
raise new liquidity for the banks
test the presence of passive institutional orders near volume supports
This dump will likely be the last countermove before the final reversal.
That's exactly where I placed my order.

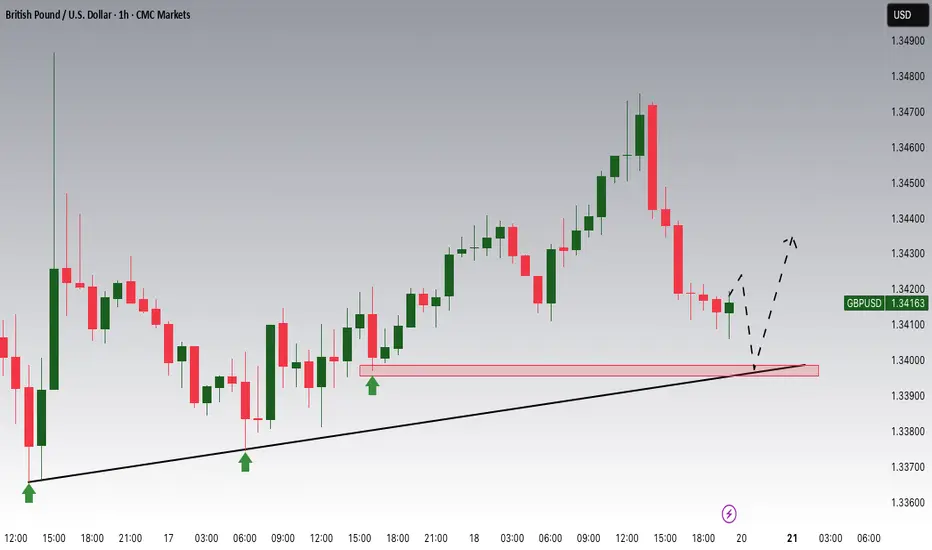
GBPUSD Potential UpsidesHey Traders, in today's trading session we are monitoring GBPUSD for a buying opportunity around 1.33900 zone, GBPUSD is trading in an uptrend and currently is in a correction phase in which it is approaching the trend at 1.33900 support and resistance area.
Trade safe, Joe.
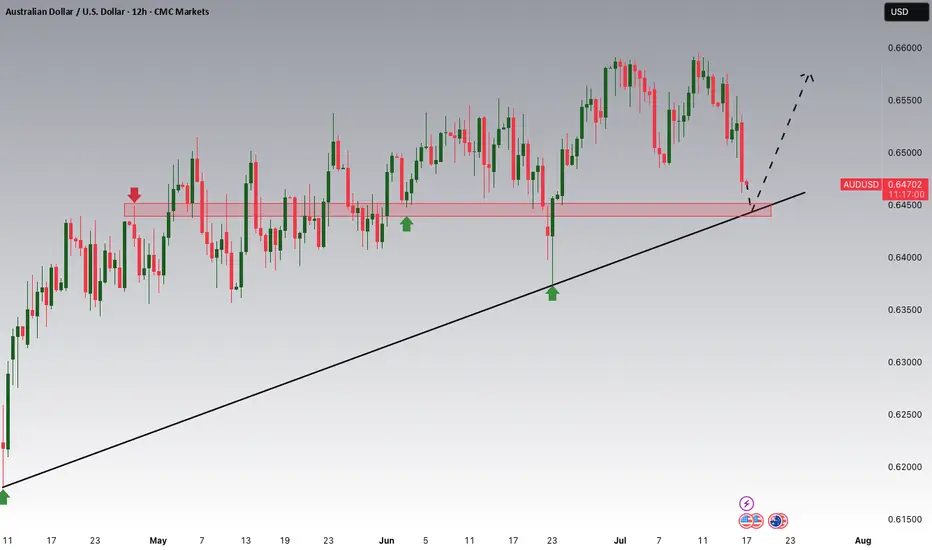
AUDUSD Potential UpsidesHey Traders, in today's trading session we are monitoring AUDUSD for a buying opportunity around 0.64500 zone, AUDUSD is trading in an uptrend and currently is in a correction phase in which it is approaching the trend at 0.64500 support and resistance area.
Trade safe, Joe.
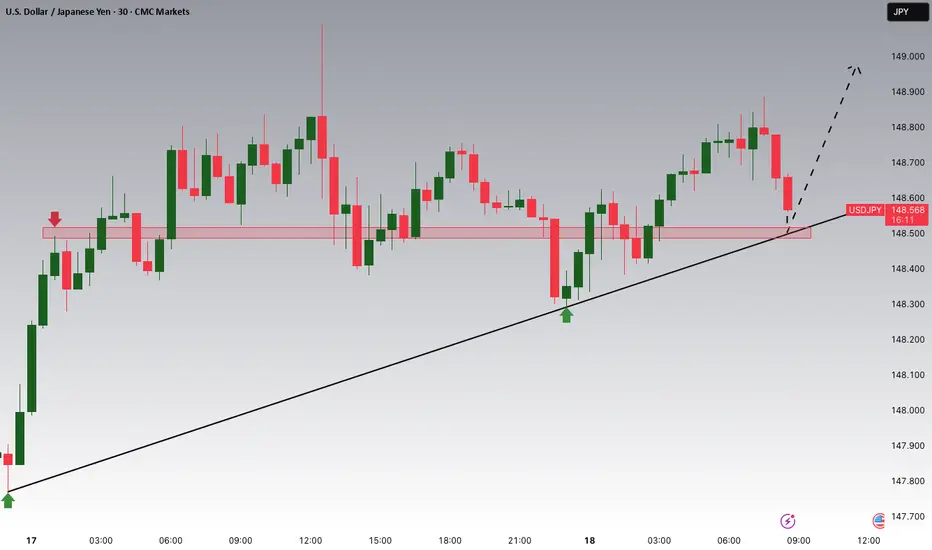
USDJPY Potential UpsidesHey Traders, in today's trading session we are monitoring USDJPY for a buying opportunity around 148.500 zone, USDJPY for a buying opportunity around 148.500 zone, USDJPY is trading in an uptrend and currently is in a correction phase in which it is approaching the trend at 148.500 support and resistance area.
Trade safe, Joe.
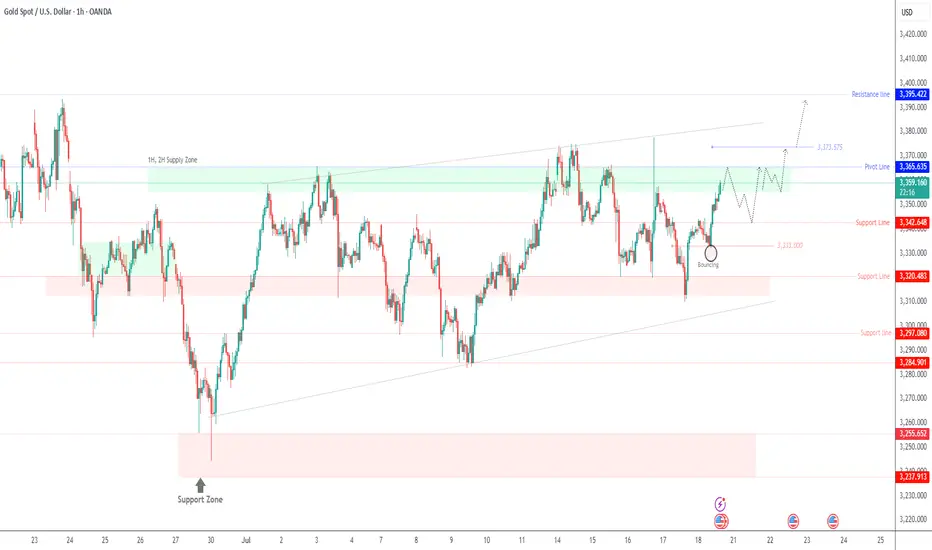
Gold Eyes 3365 – Breakout or Rejection?GOLD | Technical Outlook
Gold maintains bullish momentum as long as it trades above 3355, aiming to test the 3365 resistance level.
However, signs of rejection at 3365 may emerge, especially if the 4H candle closes below this level. In that case, expect a period of sideways consolidation between 3365 and 3342.
A confirmed 1H candle close above 3365 would signal bullish continuation toward 3373, with an extended target at 3395.
Key Levels:
• Pivot: 3355
• Resistance: 3365 / 3375 / 3395
• Support: 3342 / 3333
Outlook:
• Bullish above 3355
• Breakout above 3365 confirms further upside
• Rejection at 3365 may lead to short-term range-bound movement