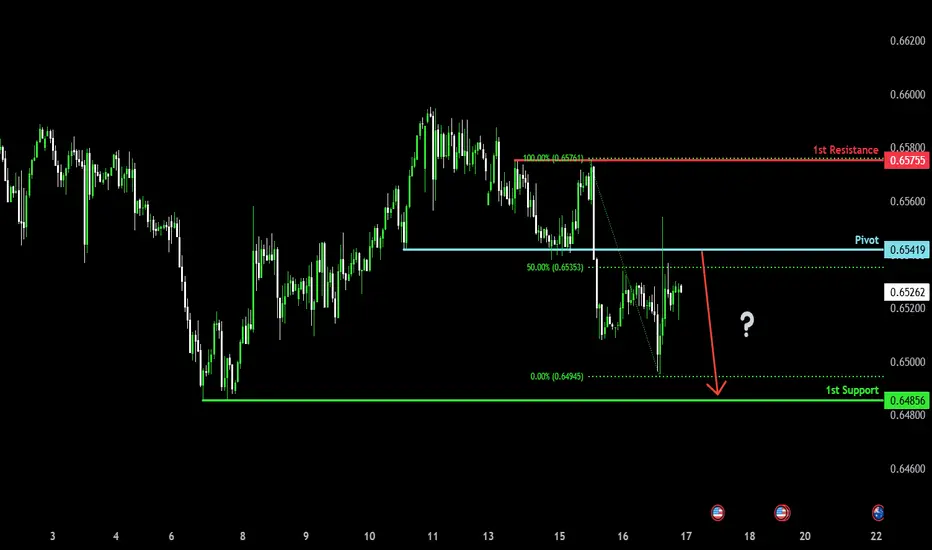
Bearish reversal?The Aussie (AUD/USD) is rising towards the pivot and could reverse to the 1st support.
Pivot: 0.6541
1st Support: 0.6485
1st Resistance: 0.6575
Risk Warning:
Trading Forex and CFDs carries a high level of risk to your capital and you should only trade with money you can afford to lose. Trading Forex and CFDs may not be suitable for all investors, so please ensure that you fully understand the risks involved and seek independent advice if necessary.
Disclaimer:
The above opinions given constitute general market commentary, and do not constitute the opinion or advice of IC Markets or any form of personal or investment advice.
Any opinions, news, research, analyses, prices, other information, or links to third-party sites contained on this website are provided on an "as-is" basis, are intended only to be informative, is not an advice nor a recommendation, nor research, or a record of our trading prices, or an offer of, or solicitation for a transaction in any financial instrument and thus should not be treated as such. The information provided does not involve any specific investment objectives, financial situation and needs of any specific person who may receive it. Please be aware, that past performance is not a reliable indicator of future performance and/or results. Past Performance or Forward-looking scenarios based upon the reasonable beliefs of the third-party provider are not a guarantee of future performance. Actual results may differ materially from those anticipated in forward-looking or past performance statements. IC Markets makes no representation or warranty and assumes no liability as to the accuracy or completeness of the information provided, nor any loss arising from any investment based on a recommendation, forecast or any information supplied by any third-party.
USD (US Dollar)
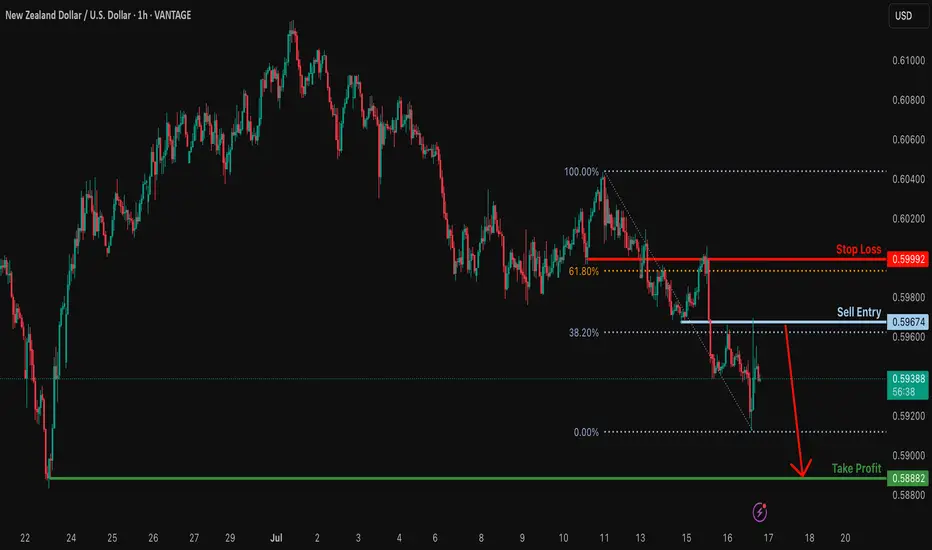
Bearish continuation?NZD/USD has rejected off the resistance level which is an overlap resistance that lines up with the 38.2% Fibonacci retracement and could drop from this level to our take profit.
Entry: 0.5967
Why we like it:
There is an overlap resistance that lines up with the 38.2% Fibonacci retracement.
Stop loss: 0.5999
Why we like it:
There is an overlap resistance that is slightly above the 61.8% Fibonacci retracement.
Take profit: 0.5888
Why we like it:
There is a pullback support.
Enjoying your TradingView experience? Review us!
Please be advised that the information presented on TradingView is provided to Vantage (‘Vantage Global Limited’, ‘we’) by a third-party provider (‘Everest Fortune Group’). Please be reminded that you are solely responsible for the trading decisions on your account. There is a very high degree of risk involved in trading. Any information and/or content is intended entirely for research, educational and informational purposes only and does not constitute investment or consultation advice or investment strategy. The information is not tailored to the investment needs of any specific person and therefore does not involve a consideration of any of the investment objectives, financial situation or needs of any viewer that may receive it. Kindly also note that past performance is not a reliable indicator of future results. Actual results may differ materially from those anticipated in forward-looking or past performance statements. We assume no liability as to the accuracy or completeness of any of the information and/or content provided herein and the Company cannot be held responsible for any omission, mistake nor for any loss or damage including without limitation to any loss of profit which may arise from reliance on any information supplied by Everest Fortune Group.
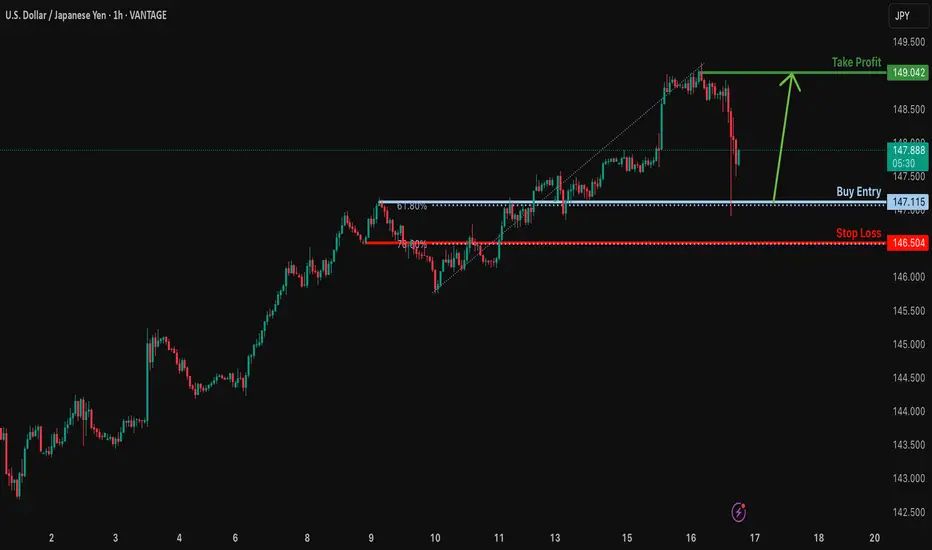
Bullish bounce off 61.8% Fibonacci support?USD/JPY is falling towards the support level which is an overlap support that aligns with the 61.8% Fibonacci retracement and could bounce from this level to our take profit.
Entry: 147.11
Why we like it:
There is an overlap support that lines up with the 61.8% Fibonacci retracement.
Stop loss: 146.50
Why we like it:
There is a pullback support that lines up with the 78.6% Fibonacci retracement.
Take profit: 149.04
Why we like it:
There is a pullback resistance.
Enjoying your TradingView experience? Review us!
Please be advised that the information presented on TradingView is provided to Vantage (‘Vantage Global Limited’, ‘we’) by a third-party provider (‘Everest Fortune Group’). Please be reminded that you are solely responsible for the trading decisions on your account. There is a very high degree of risk involved in trading. Any information and/or content is intended entirely for research, educational and informational purposes only and does not constitute investment or consultation advice or investment strategy. The information is not tailored to the investment needs of any specific person and therefore does not involve a consideration of any of the investment objectives, financial situation or needs of any viewer that may receive it. Kindly also note that past performance is not a reliable indicator of future results. Actual results may differ materially from those anticipated in forward-looking or past performance statements. We assume no liability as to the accuracy or completeness of any of the information and/or content provided herein and the Company cannot be held responsible for any omission, mistake nor for any loss or damage including without limitation to any loss of profit which may arise from reliance on any information supplied by Everest Fortune Group.
Bearish drop?USD/CAD is rising towards the resistance level which is an overlap resistance at lines up with the 38.2% Fibonacci retracement and could drop from this level to our take profit.
Entry: 1.3706
Why we like it:
There is an overlap resistance that aligns with the 38.2% Fibonacci retracement.
Stop loss: 1.3746
Why we like it:
There is a swing high resistance.
Take profit: 1.3653
Why we like it:
There is a pullback support.
Enjoying your TradingView experience? Review us!
Please be advised that the information presented on TradingView is provided to Vantage (‘Vantage Global Limited’, ‘we’) by a third-party provider (‘Everest Fortune Group’). Please be reminded that you are solely responsible for the trading decisions on your account. There is a very high degree of risk involved in trading. Any information and/or content is intended entirely for research, educational and informational purposes only and does not constitute investment or consultation advice or investment strategy. The information is not tailored to the investment needs of any specific person and therefore does not involve a consideration of any of the investment objectives, financial situation or needs of any viewer that may receive it. Kindly also note that past performance is not a reliable indicator of future results. Actual results may differ materially from those anticipated in forward-looking or past performance statements. We assume no liability as to the accuracy or completeness of any of the information and/or content provided herein and the Company cannot be held responsible for any omission, mistake nor for any loss or damage including without limitation to any loss of profit which may arise from reliance on any information supplied by Everest Fortune Group.
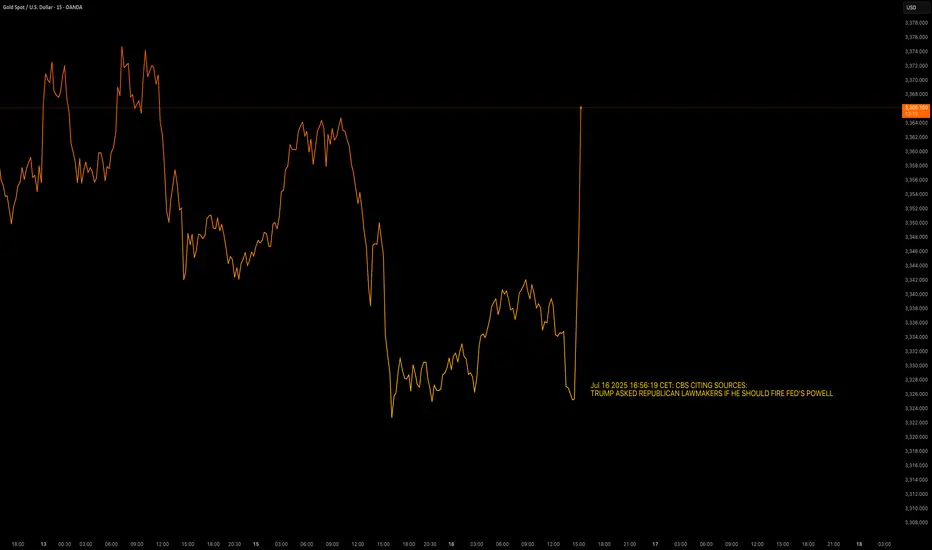
Breaking News - Trump vs. PowellJul 16 2025 16:56:19 CET: CBS CITING SOURCES:
TRUMP ASKED REPUBLICAN LAWMAKERS IF HE SHOULD FIRE FED'S POWELL
OANDA:XAUUSD sees upside +35$/oz after Trump has asked the republican lawmakers if he should fire Powell.
TVC:DXY weakens against TVC:EXY and TVC:JXY after Trumps question.
Volatility is increased.
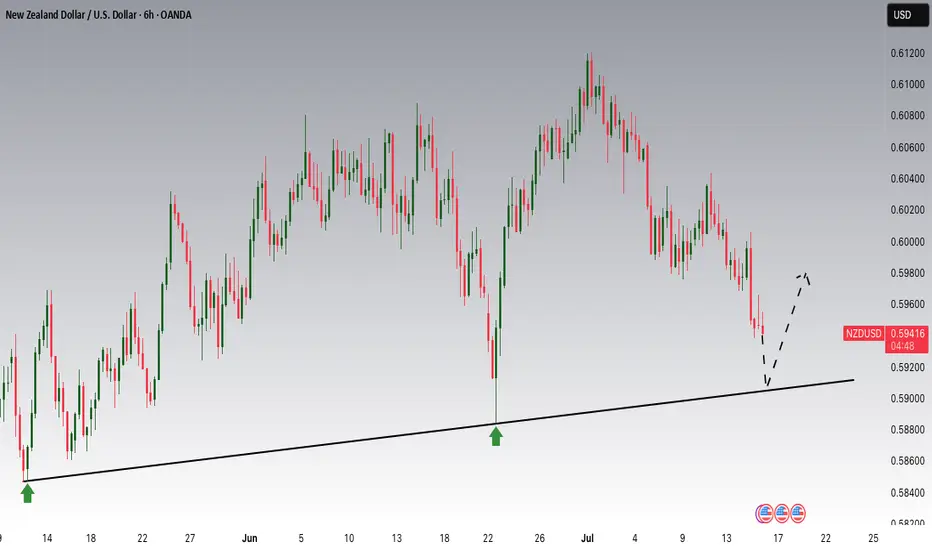
NZDUSD is Nearing an Important SupportHey Traders, in today's trading session we are monitoring NZDUSD for a buying opportunity around 0.59100 zone, NZDUSD is trading in an uptrend and currently is in a correction phase in which it is approaching the trend at 0.59100 support and resistance area.
Trade safe, Joe.
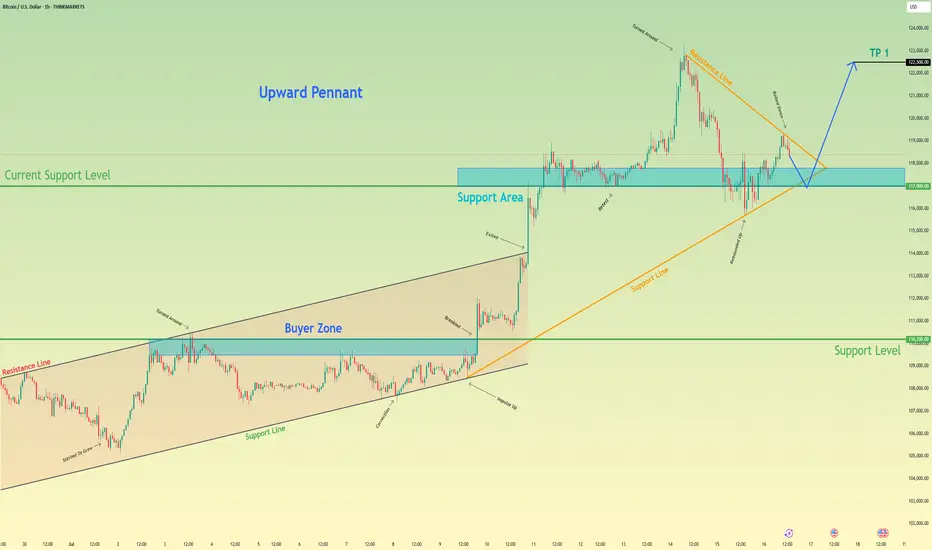
Bitcoin may exit of pennant and then rebound up of support areaHello traders, I want share with you my opinion about Bitcoin. Earlier, the price was moving inside an upward channel, respecting both the resistance and support boundaries. After reaching the buyer zone (110200–109500 points), BTC made a strong impulse up, breaking out of the channel and entering a new phase of growth. This breakout led to the formation of a bullish pennant, which often signals a continuation of the uptrend. Right now, the price is testing the support area between 117000 and 117800, which previously acted as a breakout zone and now serves as a current support level (117000). The structure shows that this level has already worked as a rebound zone multiple times. In my opinion, BTC may continue the correction toward this support area, potentially exiting the pennant to the downside for a short-term pull-back. After that, I expect a new upward movement, targeting the next local high. That’s why I set my TP at 122500 points, which is just below the recent ATH. Given the impulse move, strong support zone, breakout from the channel, and the bullish pennant pattern, I remain bullish and expect BTC to resume its upward trend soon. Please share this idea with your friends and click Boost 🚀
Disclaimer: As part of ThinkMarkets’ Influencer Program, I am sponsored to share and publish their charts in my analysis.
Australian job numbers and AUDWe are keeping a close eye on the Australian job numbers tonight. If you are trading AUD, then that's the data to watch. Let's dig in.
FX_IDC:AUDUSD
FX_IDC:AUDJPY
FX_IDC:AUDNZD
Let us know what you think in the comments below.
Thank you.
75.2% of retail investor accounts lose money when trading CFDs with this provider. You should consider whether you understand how CFDs work and whether you can afford to take the high risk of losing your money. Past performance is not necessarily indicative of future results. The value of investments may fall as well as rise and the investor may not get back the amount initially invested. This content is not intended for nor applicable to residents of the UK. Cryptocurrency CFDs and spread bets are restricted in the UK for all retail clients.

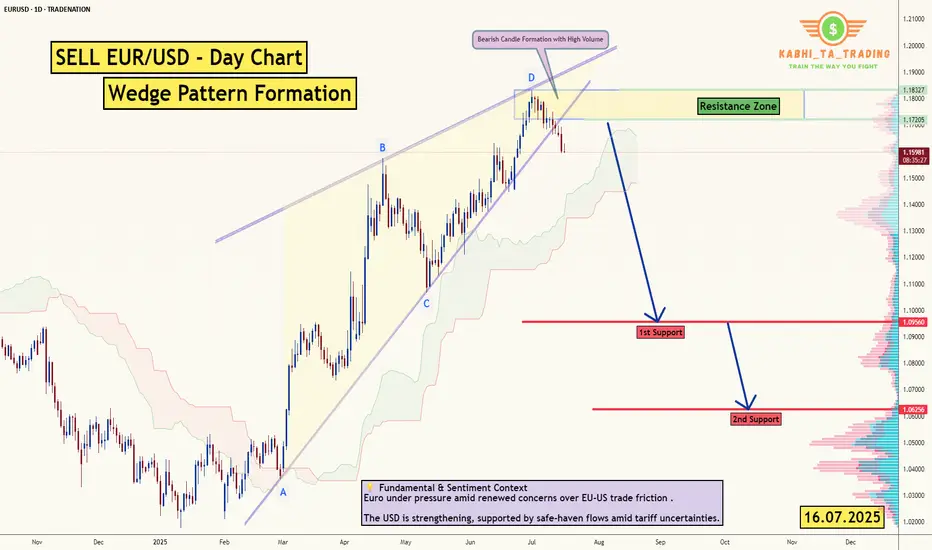
EUR/USD - Daily Chart (Wedge Breakout) (16.07.2025) The EUR/USD Pair on the D1 timeframe presents a Potential Selling Opportunity due to a recent Formation of a Wedge Pattern. This suggests a shift in momentum towards the downside in the coming Days.
Possible Short Trade:
Entry: Consider Entering A Short Position around Trendline Of The Pattern.
Target Levels:
1st Support – 1.0956
2nd Support – 1.0625
💡 Fundamental & Sentiment Context
Euro under pressure amid renewed concerns over EU‑US trade friction .
The USD is strengthening, supported by safe‑haven flows amid tariff uncertainties.
🎁 Please hit the like button and
🎁 Leave a comment to support for My Post !
Your likes and comments are incredibly motivating and will encourage me to share more analysis with you.
Best Regards, KABHI_TA_TRADING
Thank you.
Disclosure: I am part of Trade Nation's Influencer program and receive a monthly fee for using their TradingView charts in my analysis.
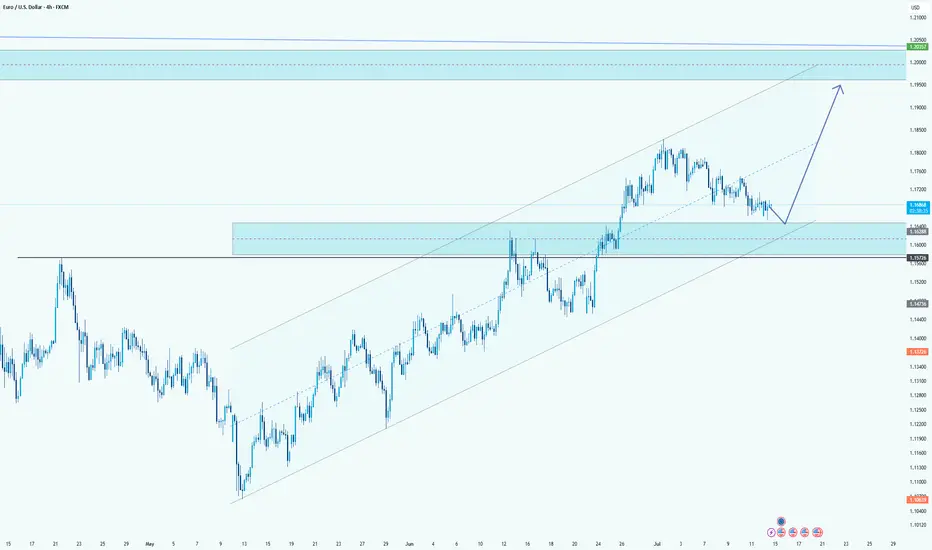
EUR/USD Retracement Into Demand ZoneHello guys!
EUR/USD is currently undergoing a healthy retracement after an extended bullish trend within the ascending channel. The price is now approaching a key demand zone, which aligns perfectly with the mid-line of the channel structure.
This zone previously acted as a strong resistance area and is now expected to serve as support, confirming a classic flip in market structure. The reaction around the 1.16288 - 1.15774 area will be crucial.
If buyers step in here, the bullish momentum is likely to resume with the next major target being the upper resistance zone near 1.20000 , as projected by the upward arrow. The overall structure remains bullish as long as the price holds above the channel support and doesn't close below the last demand zone.
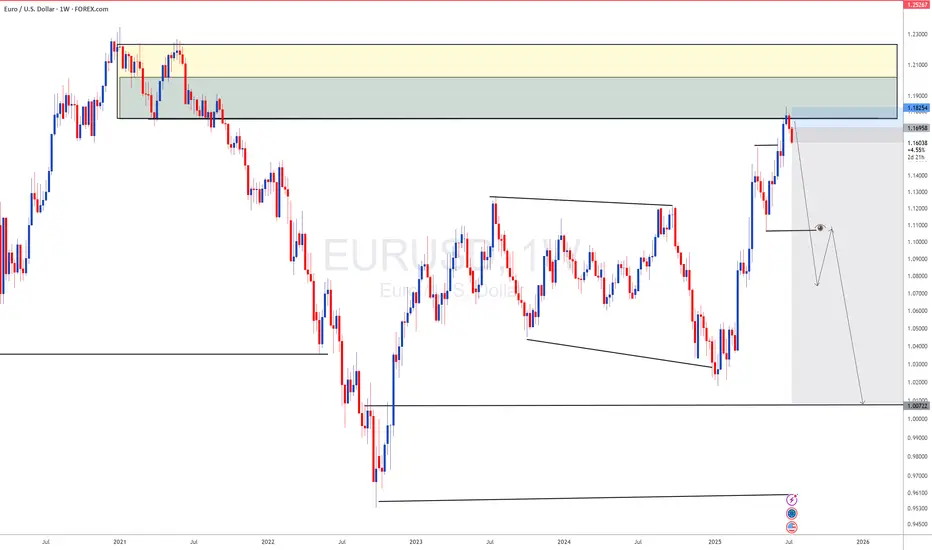
EURUSD as DXY s gaining momentum DXY has completed its long term downside now lets look for sell on EURUSD
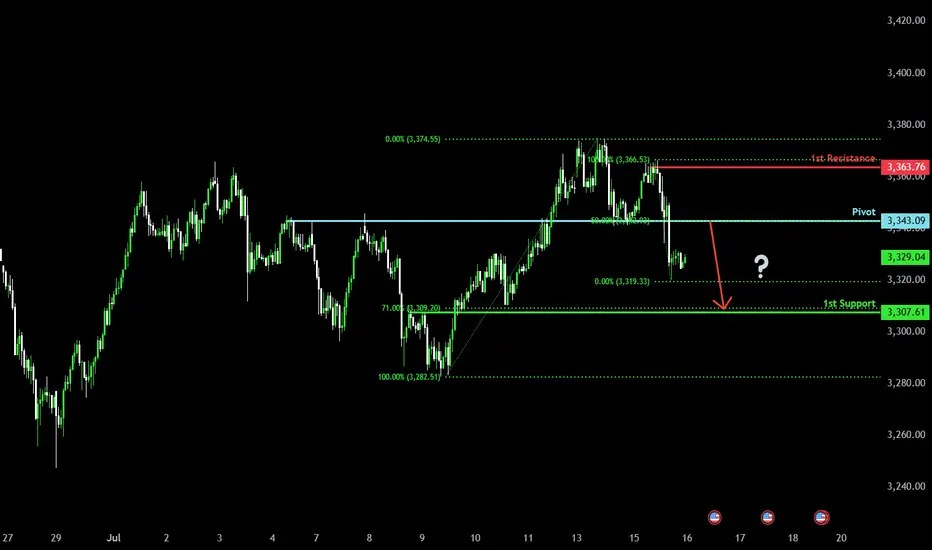
Major resistance ahead?The Gold (XAU/USD) is rising towards the pivot and could reverse to the overlap support.
Pivot: 3,343.09
1st Support: 3,307.61
1st Resistance: 3,363.76
Risk Warning:
Trading Forex and CFDs carries a high level of risk to your capital and you should only trade with money you can afford to lose. Trading Forex and CFDs may not be suitable for all investors, so please ensure that you fully understand the risks involved and seek independent advice if necessary.
Disclaimer:
The above opinions given constitute general market commentary, and do not constitute the opinion or advice of IC Markets or any form of personal or investment advice.
Any opinions, news, research, analyses, prices, other information, or links to third-party sites contained on this website are provided on an "as-is" basis, are intended only to be informative, is not an advice nor a recommendation, nor research, or a record of our trading prices, or an offer of, or solicitation for a transaction in any financial instrument and thus should not be treated as such. The information provided does not involve any specific investment objectives, financial situation and needs of any specific person who may receive it. Please be aware, that past performance is not a reliable indicator of future performance and/or results. Past Performance or Forward-looking scenarios based upon the reasonable beliefs of the third-party provider are not a guarantee of future performance. Actual results may differ materially from those anticipated in forward-looking or past performance statements. IC Markets makes no representation or warranty and assumes no liability as to the accuracy or completeness of the information provided, nor any loss arising from any investment based on a recommendation, forecast or any information supplied by any third-party.
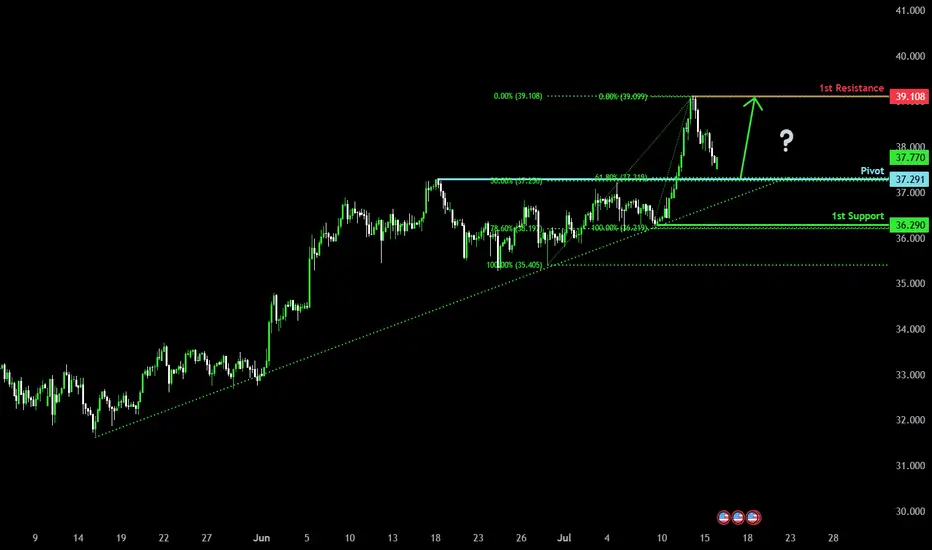
Falling towards the pullback support?The Silver (XAG/USD) is falling towards the pivot which acts as a pullback support and could bounce to the 1st resistance which is a pullback resistance.
Pivot: 37.29
1st Support: 36.29
1st Resistance: 39.10
Risk Warning:
Trading Forex and CFDs carries a high level of risk to your capital and you should only trade with money you can afford to lose. Trading Forex and CFDs may not be suitable for all investors, so please ensure that you fully understand the risks involved and seek independent advice if necessary.
Disclaimer:
The above opinions given constitute general market commentary, and do not constitute the opinion or advice of IC Markets or any form of personal or investment advice.
Any opinions, news, research, analyses, prices, other information, or links to third-party sites contained on this website are provided on an "as-is" basis, are intended only to be informative, is not an advice nor a recommendation, nor research, or a record of our trading prices, or an offer of, or solicitation for a transaction in any financial instrument and thus should not be treated as such. The information provided does not involve any specific investment objectives, financial situation and needs of any specific person who may receive it. Please be aware, that past performance is not a reliable indicator of future performance and/or results. Past Performance or Forward-looking scenarios based upon the reasonable beliefs of the third-party provider are not a guarantee of future performance. Actual results may differ materially from those anticipated in forward-looking or past performance statements. IC Markets makes no representation or warranty and assumes no liability as to the accuracy or completeness of the information provided, nor any loss arising from any investment based on a recommendation, forecast or any information supplied by any third-party.
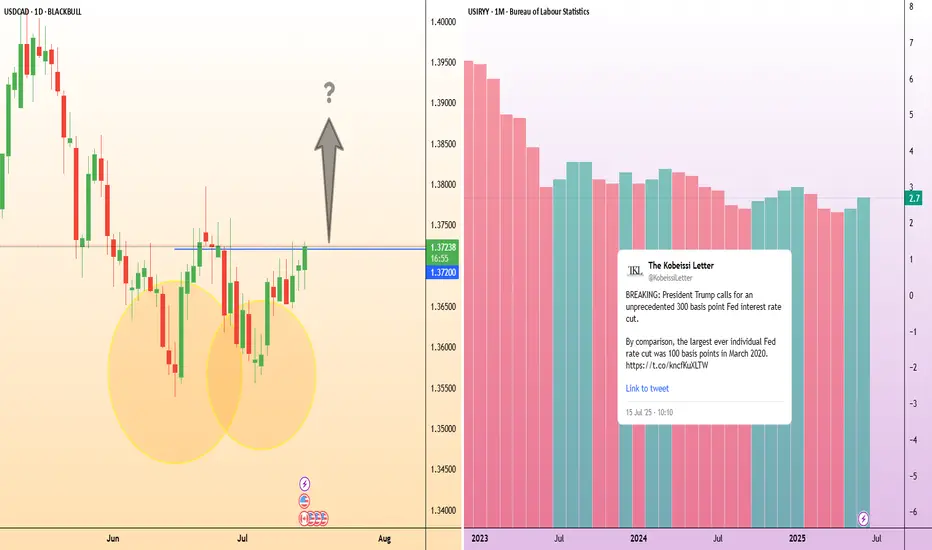
USD/CAD: Inflation gaps create opportunityIn the U.S., inflation accelerated for a second straight month, with headline CPI reaching 2.7% year-on-year in June as President Trump’s tariffs begin to push up the cost of a range of goods.
Increasing inflation could likely heighten the Federal Reserve’s reluctance to cut its interest rate, in defiance of Trump’s public demand. This could provide upward momentum for USD/CAD if expectations for rate cuts are delayed.
USD/CAD is showing signs of a potential trend reversal after finding strong support around 1.3600 in late June. Price action has since formed a series of higher lows, and the recent breakout attempt above 1.3720 suggests bullish momentum could be building.
Canada’s inflation rate, released at the same time as the US’s, edged up to 1.9%, staying below the Bank of Canada’s 2% target for a third consecutive month. With the BoC already signalling easing bias, this divergence in inflation paths may limit CAD strength.
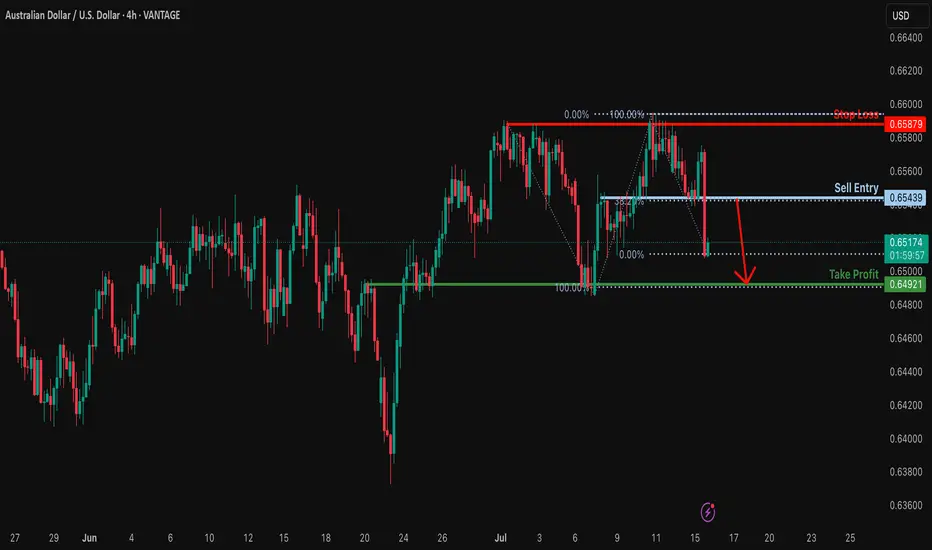
Heading into 38.2% Fibonacci resistance?AUD/USD is rising towards the resistance level which is an overlap. resistance that aligns with the 38.2% Fibonacci retracement and. could drop from this level to our take profit.
Entry: 0.6543
Why we like it:
There is n overlap resistance that aligns with the 38.2% Fibonacci retracement.
Stop loss: 0.6587
Why we like it:
There is. pullback resistance.
Take profit: 0.6492
Why we like it:
There is an overlap support level that lines up with the 100% Fibonacci projection.
Enjoying your TradingView experience? Review us!
Please be advised that the information presented on TradingView is provided to Vantage (‘Vantage Global Limited’, ‘we’) by a third-party provider (‘Everest Fortune Group’). Please be reminded that you are solely responsible for the trading decisions on your account. There is a very high degree of risk involved in trading. Any information and/or content is intended entirely for research, educational and informational purposes only and does not constitute investment or consultation advice or investment strategy. The information is not tailored to the investment needs of any specific person and therefore does not involve a consideration of any of the investment objectives, financial situation or needs of any viewer that may receive it. Kindly also note that past performance is not a reliable indicator of future results. Actual results may differ materially from those anticipated in forward-looking or past performance statements. We assume no liability as to the accuracy or completeness of any of the information and/or content provided herein and the Company cannot be held responsible for any omission, mistake nor for any loss or damage including without limitation to any loss of profit which may arise from reliance on any information supplied by Everest Fortune Group.
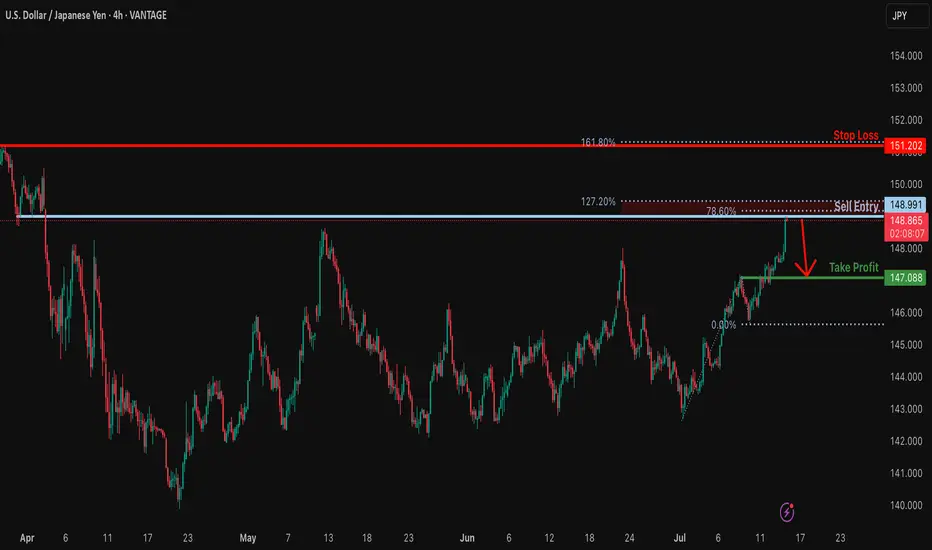
Bearish reversal?USD/JPY is reacting off the resistance level which is a pullback resistance that lines up with the 78.6% Fibonacci projection and slightly below the 127.2% Fibonacci extension.
Entry: 148.99
Why we like it:
There is a pullback resistance that lines up with the 78.6% Fibonacci projection and also slightly below the 127.2% Fibonacci extension.
Stop loss: 151.20
Why we like it:
There is an overlap resistance that aligns with the 161.8% Fibonacci extension.
Take profit: 147.08
Why we like it:
There is an overlap support level.
Enjoying your TradingView experience? Review us!
Please be advised that the information presented on TradingView is provided to Vantage (‘Vantage Global Limited’, ‘we’) by a third-party provider (‘Everest Fortune Group’). Please be reminded that you are solely responsible for the trading decisions on your account. There is a very high degree of risk involved in trading. Any information and/or content is intended entirely for research, educational and informational purposes only and does not constitute investment or consultation advice or investment strategy. The information is not tailored to the investment needs of any specific person and therefore does not involve a consideration of any of the investment objectives, financial situation or needs of any viewer that may receive it. Kindly also note that past performance is not a reliable indicator of future results. Actual results may differ materially from those anticipated in forward-looking or past performance statements. We assume no liability as to the accuracy or completeness of any of the information and/or content provided herein and the Company cannot be held responsible for any omission, mistake nor for any loss or damage including without limitation to any loss of profit which may arise from reliance on any information supplied by Everest Fortune Group.
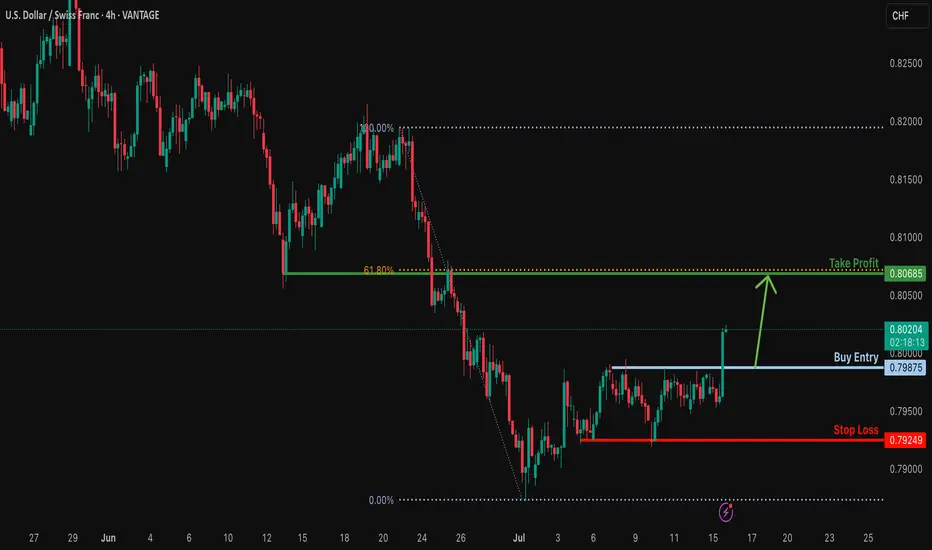
Bullish bounce?USD/CHF is falling towards the support level which is a pullback support and could bounce from this level to our take profit.
Entry: 0.7987
Why we like it:
There is a pullback support.
Stop loss: 0.7924
Why we like it:
There is a pullback support.
Take profit: 0.8068
Why we like it:
There is an overlap resistance that aligns with the 61.8% Fibonacci retracement.
Enjoying your TradingView experience? Review us!
Please be advised that the information presented on TradingView is provided to Vantage (‘Vantage Global Limited’, ‘we’) by a third-party provider (‘Everest Fortune Group’). Please be reminded that you are solely responsible for the trading decisions on your account. There is a very high degree of risk involved in trading. Any information and/or content is intended entirely for research, educational and informational purposes only and does not constitute investment or consultation advice or investment strategy. The information is not tailored to the investment needs of any specific person and therefore does not involve a consideration of any of the investment objectives, financial situation or needs of any viewer that may receive it. Kindly also note that past performance is not a reliable indicator of future results. Actual results may differ materially from those anticipated in forward-looking or past performance statements. We assume no liability as to the accuracy or completeness of any of the information and/or content provided herein and the Company cannot be held responsible for any omission, mistake nor for any loss or damage including without limitation to any loss of profit which may arise from reliance on any information supplied by Everest Fortune Group.
Bullish bounce off pullback support?USD/CAD is falling towards the support level which is a pullback support and could bounce from this level to our take profit.
Entry: 1.3695
Why we like it:
There is a pullback support.
Stop loss: 1.3644
Why we like it:
There is a pullback support that aligns with the 50% Fibonacci retracement.
Take profit: 1.3781
Why we lik eit:
There is a pullback resistance.
Enjoying your TradingView experience? Review us!
Please be advised that the information presented on TradingView is provided to Vantage (‘Vantage Global Limited’, ‘we’) by a third-party provider (‘Everest Fortune Group’). Please be reminded that you are solely responsible for the trading decisions on your account. There is a very high degree of risk involved in trading. Any information and/or content is intended entirely for research, educational and informational purposes only and does not constitute investment or consultation advice or investment strategy. The information is not tailored to the investment needs of any specific person and therefore does not involve a consideration of any of the investment objectives, financial situation or needs of any viewer that may receive it. Kindly also note that past performance is not a reliable indicator of future results. Actual results may differ materially from those anticipated in forward-looking or past performance statements. We assume no liability as to the accuracy or completeness of any of the information and/or content provided herein and the Company cannot be held responsible for any omission, mistake nor for any loss or damage including without limitation to any loss of profit which may arise from reliance on any information supplied by Everest Fortune Group.

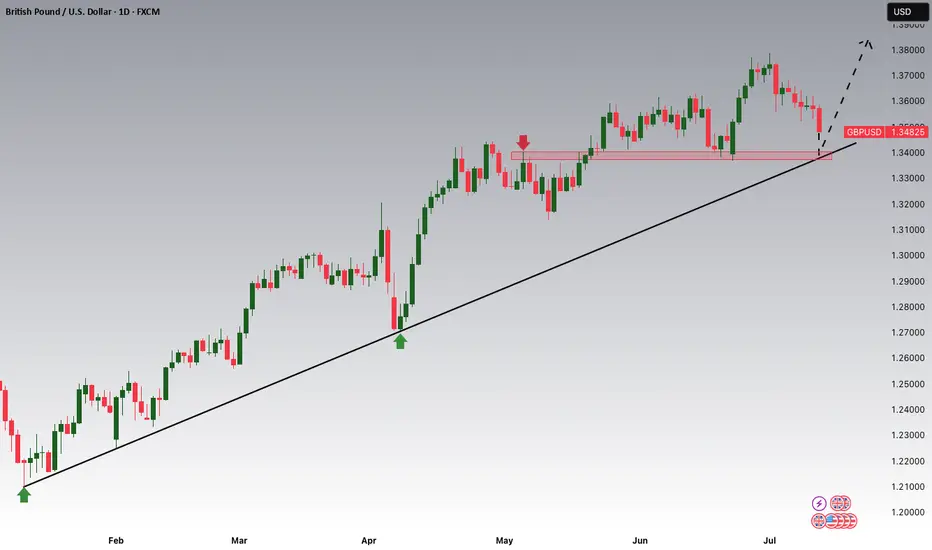
GBPUSD is Nearing the Daily Trend!!!Hey Traders, in tomorrow's trading session we are monitoring GBPUSD for a buying opportunity around 1.34100 zone, GBPUSD is trading in an uptrend and currently is in a correction phase in which it is approaching the trend at 1.34100 support and resistance area.
Trade safe, Joe.
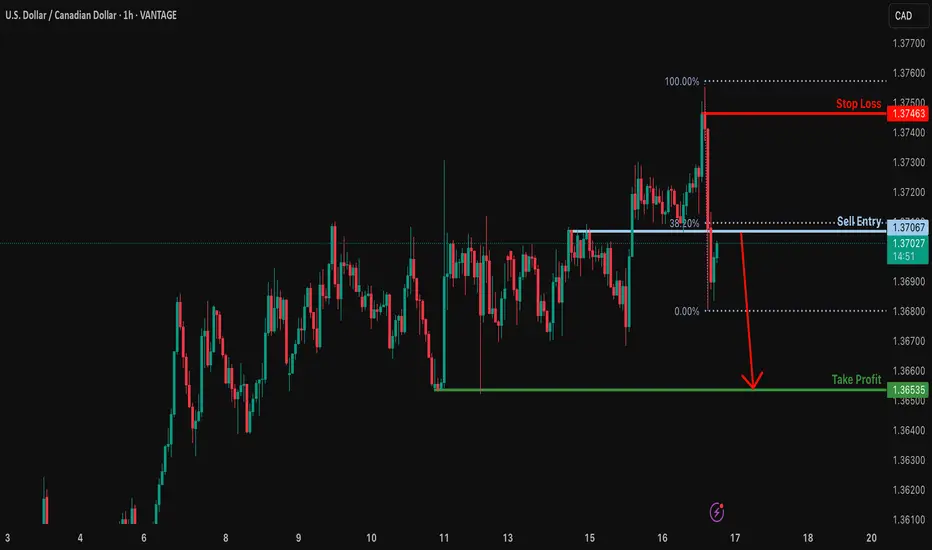
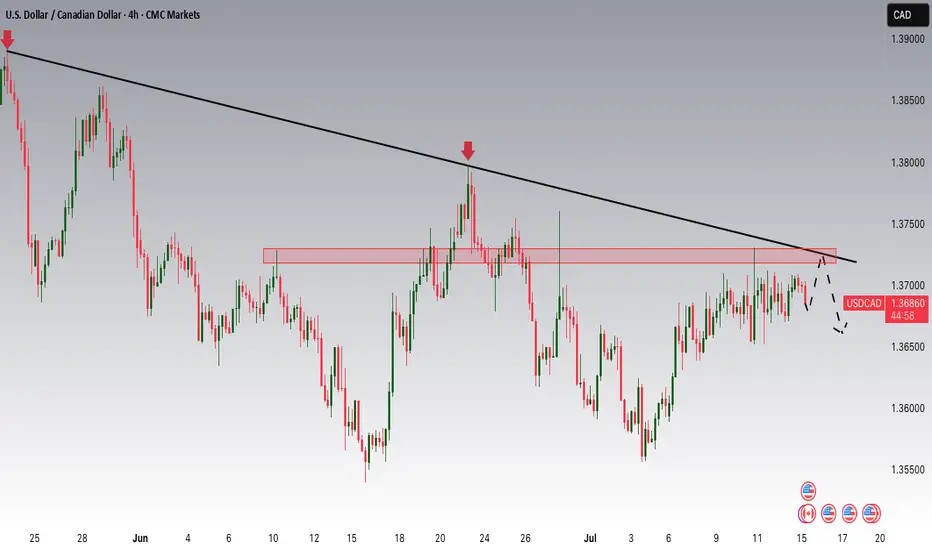
USDCAD Potential DownsidesHey Traders, in today's trading session we are monitoring USDCAD for a selling opportunity around 1.37200 zone, USDCAD is trading in a downtrend and currently is in a correction phase in which it is approaching the trend at 1.37200 support and resistance area.
Trade safe, Joe.
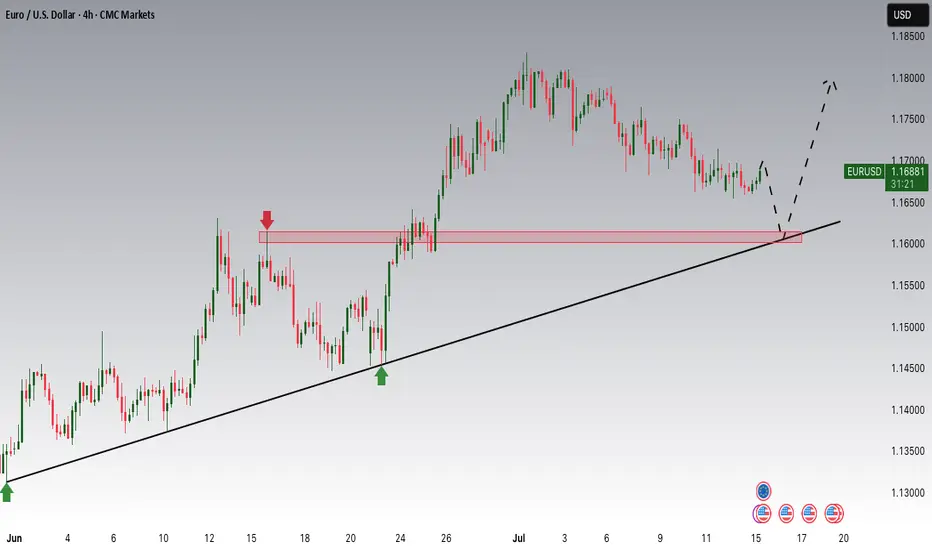
EURUSD: Consolidation Phase Nearing the Main Trend!!Hey Traders, in today's trading session we are monitoring EURUSD for a buying opportunity around 1.16100 zone, EURUSD is trading in an uptrend and currently is in a correction phase in which it is approaching the trend at 1.16100 support and resistance area.
Trade safe, Joe.
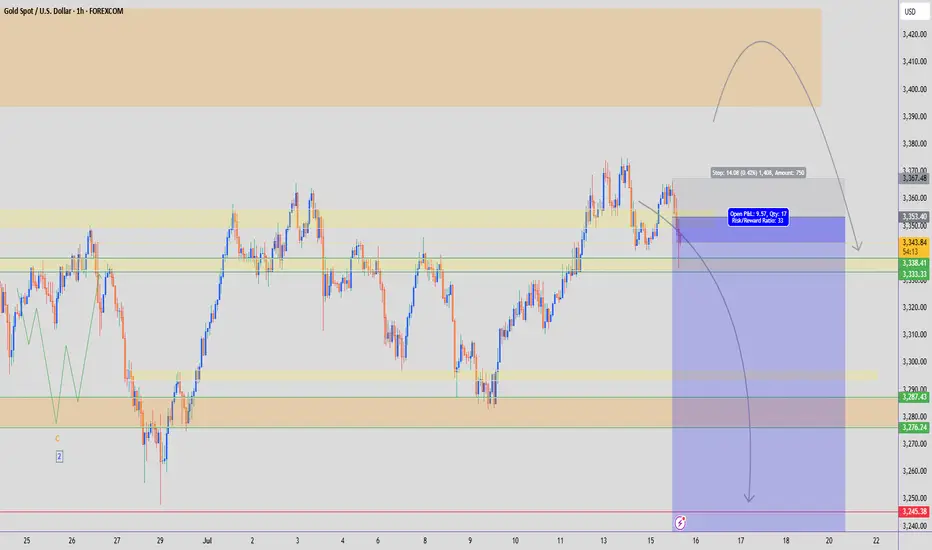
GOLD - SHORT TO $2,800 (1H UPDATE)Yesterday's entry hit SL, as price pushed up a little higher for liquidity, ahead of today's CPI data.
I have entered another sell entry today at $3,353. Couldn't send analysis straight away as I was out & didn't have my laptop on me. But re-trying this analysis one last time. If SL is hit, we will wait for $3,400 entry.
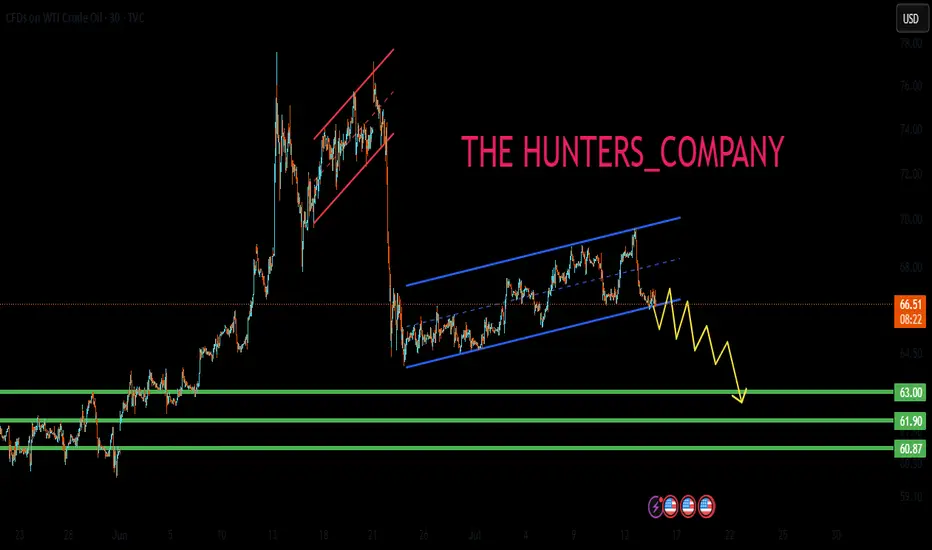
US OIL SELL...Hello friends🙌
🔊As you can see, this chart works well in forming a channel, and now that
we have witnessed a price drop, the price has reached the bottom of the channel, and given the previous heavy drop, the channel shows that the power is currently in the hands of sellers and it is likely that the specified targets will move.
🔥Follow us for more signals🔥
Trade safely with us