Bearish drop off pullback resistance?USD/CHF is rising towards the resistance level, which is a pullback resistance that aligns with the 50% Fibonacci retracement and could drop from this level to our take-profit.
Entry: 0.7985
Why we like it:
There is a pullback resistance that aligns with the 50% Fibonacci retracement.
Stop loss: 0.8067
Why we like it:
There is an overlap resistance.
Take profit: 0.7888
Why we like it:
There is a swing low support that aligns with the 127.2% Fibonacci extension.
Enjoying your TradingView experience? Review us!
Please be advised that the information presented on TradingView is provided to Vantage (‘Vantage Global Limited’, ‘we’) by a third-party provider (‘Everest Fortune Group’). Please be reminded that you are solely responsible for the trading decisions on your account. There is a very high degree of risk involved in trading. Any information and/or content is intended entirely for research, educational and informational purposes only and does not constitute investment or consultation advice or investment strategy. The information is not tailored to the investment needs of any specific person and therefore does not involve a consideration of any of the investment objectives, financial situation or needs of any viewer that may receive it. Kindly also note that past performance is not a reliable indicator of future results. Actual results may differ materially from those anticipated in forward-looking or past performance statements. We assume no liability as to the accuracy or completeness of any of the information and/or content provided herein and the Company cannot be held responsible for any omission, mistake nor for any loss or damage including without limitation to any loss of profit which may arise from reliance on any information supplied by Everest Fortune Group.
USD

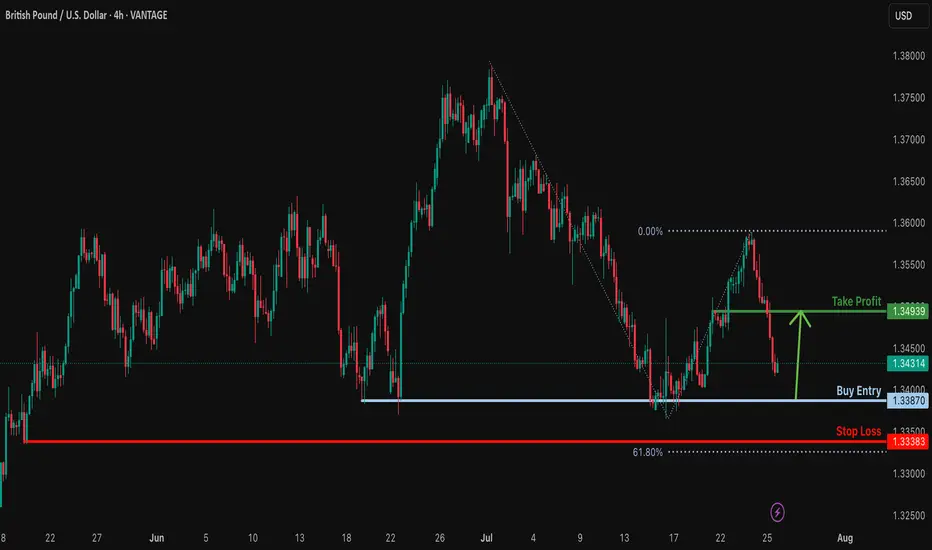
Bullish bounce?GBP/USD is falling towards the support level which is a multi swing low support and could bounce from this level to our take profit.
Entry: 1.3387
Why we like it:
There is a multi swing low support.
Stop loss: 1.3338
Why we like it:
There is a swing low support that is slightly above the 61.8% Fibonacci projection.
Take profit: 1.3493
Why we like it:
There is a pullback resistance.
Enjoying your TradingView experience? Review us!
Please be advised that the information presented on TradingView is provided to Vantage (‘Vantage Global Limited’, ‘we’) by a third-party provider (‘Everest Fortune Group’). Please be reminded that you are solely responsible for the trading decisions on your account. There is a very high degree of risk involved in trading. Any information and/or content is intended entirely for research, educational and informational purposes only and does not constitute investment or consultation advice or investment strategy. The information is not tailored to the investment needs of any specific person and therefore does not involve a consideration of any of the investment objectives, financial situation or needs of any viewer that may receive it. Kindly also note that past performance is not a reliable indicator of future results. Actual results may differ materially from those anticipated in forward-looking or past performance statements. We assume no liability as to the accuracy or completeness of any of the information and/or content provided herein and the Company cannot be held responsible for any omission, mistake nor for any loss or damage including without limitation to any loss of profit which may arise from reliance on any information supplied by Everest Fortune Group.
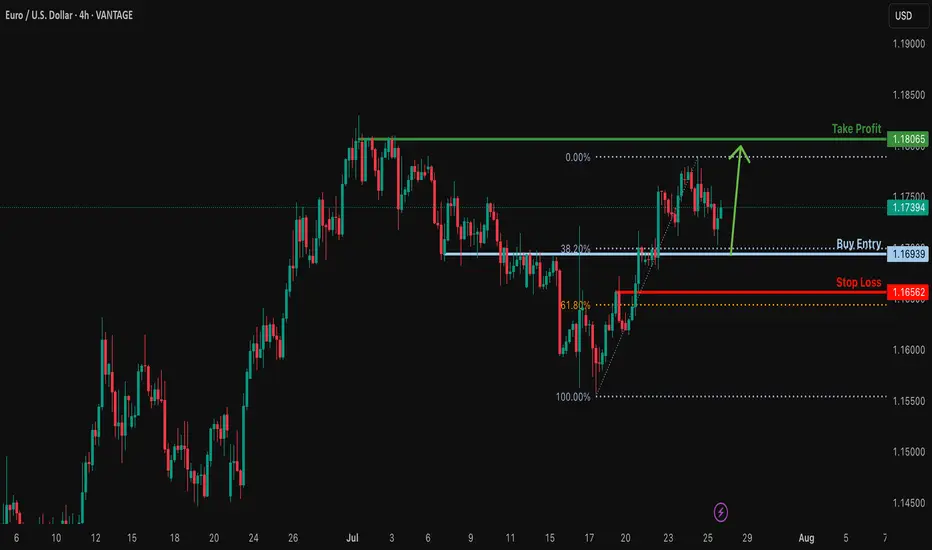
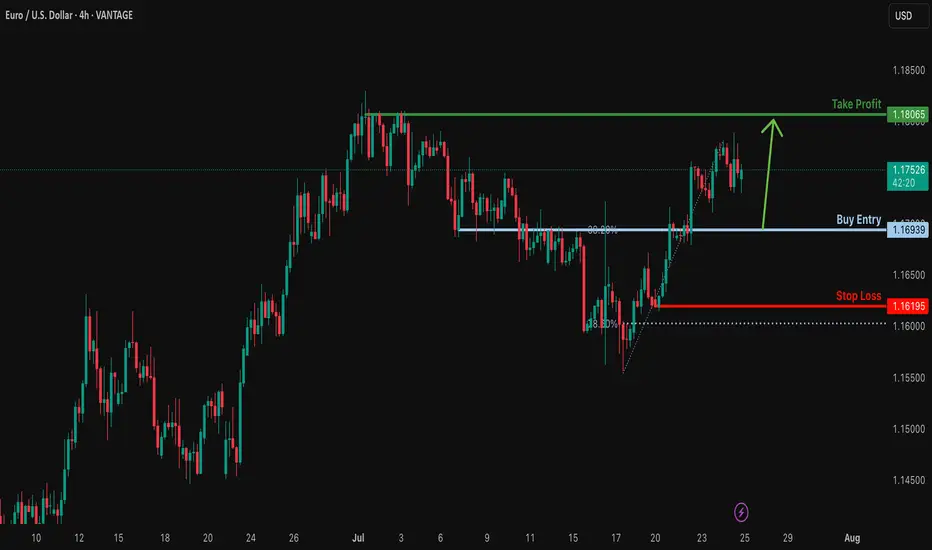
Bullish bounce off 38.2% Fibonacci support?EUR/USD is falling towards the support level, which is an overlap support that aligns with the 38.2% Fibonacci retracement and could bounce from this level to our take-profit.
Entry: 1.1693
Why we like it:
There is an overlap support that lines up with the 38.2% Fibonacci retracement.
Stop loss: 1.1656
Why we like it:
There is a pullback support that is slightly above the 61.8% Fibonacci retracement.
Take profit: 1.1806
Why we like it:
There is a swing high resistance.
Enjoying your TradingView experience? Review us!
Please be advised that the information presented on TradingView is provided to Vantage (‘Vantage Global Limited’, ‘we’) by a third-party provider (‘Everest Fortune Group’). Please be reminded that you are solely responsible for the trading decisions on your account. There is a very high degree of risk involved in trading. Any information and/or content is intended entirely for research, educational and informational purposes only and does not constitute investment or consultation advice or investment strategy. The information is not tailored to the investment needs of any specific person and therefore does not involve a consideration of any of the investment objectives, financial situation or needs of any viewer that may receive it. Kindly also note that past performance is not a reliable indicator of future results. Actual results may differ materially from those anticipated in forward-looking or past performance statements. We assume no liability as to the accuracy or completeness of any of the information and/or content provided herein and the Company cannot be held responsible for any omission, mistake nor for any loss or damage including without limitation to any loss of profit which may arise from reliance on any information supplied by Everest Fortune Group.
AUDUSD 4Hour TF - July 27th, 2025AUDUSD 7/27/2025
AUDUSD 4hour Bullish idea
Monthly - Bearish
Weekly - Bearish
Dailly - Bullish
4hour - Bullish
AUDUSD is holding steady in this weekly channel but has been showing signs of high volume ranging over the last month. Going into this week we’re looking mostly bullish but we have some minor zones that could slow price action down.
Here are two scenarios we are looking out for, for the week ahead:
Bullish Continuation - This is our ideal scenario as we want the trend to continue so we can have the best quality trade. For us to get comfortable going long AU we need to see structure above our 0.65800 zone. We want to see price action use this zone as support and establish structure (the next higher low).
If this happens we can look to target higher toward major resistance levels and key fib levels.
Bearish Reversal into range - If we fail to see bullish conviction at the current zone it’s possible price action will fall back into the range. This is a likely scenario as we have seen price action bounce between 0.65800 and 0.65000 multiple times over the last month.
I wouldn’t recommend trading this scenario as I don’t like trading ranges but we could see price action head lower to 0.65000.

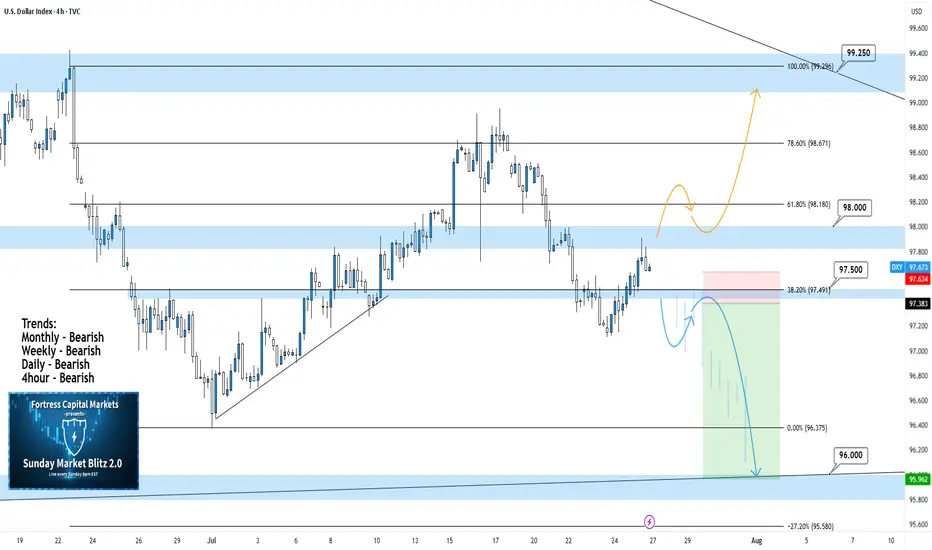
DXY 4Hour TF - July 27, 2025DXY 7/27/2025
DXY 4hour Bearish Idea
Monthly - Bearish
Weekly - Bearish
Dailly - Bearish
4hour - Bearish
**We analyze DXY as an indicator of USD strength on a week to week basis**
This week is looking like we can expect bearish momentum on USD but here are two scenarios breaking down the potential:
Bearish Continuation - USD pulled a strong bearish reversal all last week which pushed us below our major 98.000 support zone.
We are now testing that same 98.000 zone as resistance and are looking to see if it will hold. Ideally, we can confirm further bearish structure to gain confidence in a bearish USD for the week ahead.
Bullish Reversal- For us to consider DXY as bullish again we would need to see bullish structure above our 98.000 zone. This would include: A break back above 98.000 with an established HH and HL.
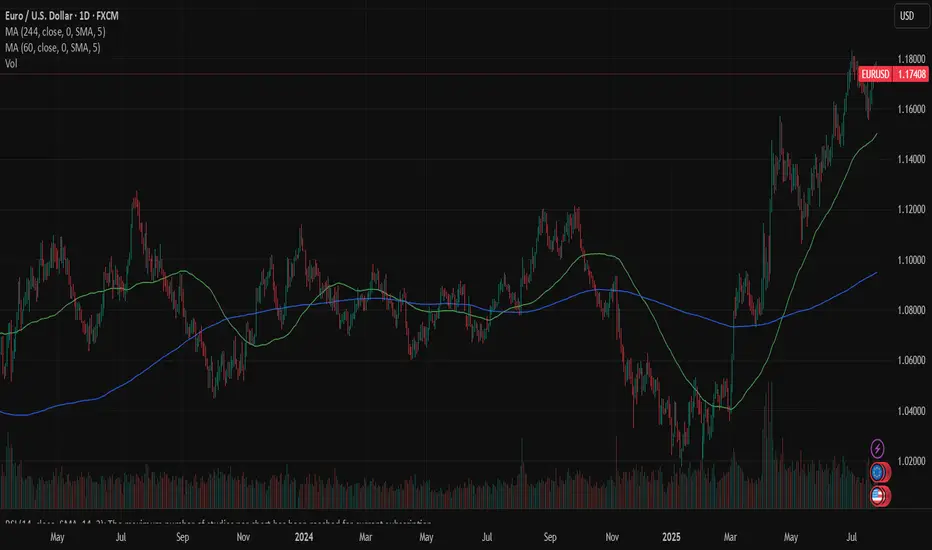
EURUSD: FOMC, PCE, NFP, JOLTs - busy week guaranteedThe ECB meeting was one of the major events during the previous week, when it comes to macro data. As it was widely expected, the ECB left rates unchanged, amid uncertainties related to trade tariffs with the U.S.. The ECB maintains its previous macro outlook, viewing the Euro Zone economy as resilient but facing downside risks. President Lagarde highlighted global trade tensions, geopolitical instability and negative shifts in market sentiment as key risks to further growth. At the same time, Lagarde dismissed concerns about the stronger euro, reiterating that the ECB does not target the exchange rate directly. With the inflation level of 2% and deposit rate of 2%, the ECB is in the position to take a wait-and-see stance on further rate cuts, although some analysts are mentioning the possibility of another 25bps cut in September.
Other macro data for the Euro Zone and Germany include the HCOB Manufacturing PMI Flash for July, which stood at 49,8 for the Euro Zone and 49,2 for Germany. Both indicators were standing in line with market expectations. The Ifo business Climate in Germany in July reached 88,6, in line with market forecast.
The previous week was relatively weak when it comes to currently important macro data for the U.S. economy. Posted data include Existing Home Sales in June, which reached 3,93M and were a bit lower from forecasted 4,0M. The indicator dropped by 2,7% compared to the previous month. The S&P Global Manufacturing PMI flash for July reached 49,5 a bit lower from market forecast of 52,6. At the same time the S&P Global Services PMI flash for July beat market expectation with the level of 55,2. The durable Goods Orders in June dropped by -9,3% compared to the previous month, which was a bit lower from -10,8% expected by the market.
The ECB meeting left its mark on the parity of eurusd currency pair during the previous week. The euro strengthened till the level of 1,1786, but eased as of the end of the week, closing it at 1,1742. The currency pair was testing the 1,17 support line on Friday's trading session. The RSI continues to move at levels above the 50 line, ending the week modestly below the level of 60. The MA50 continues to diverge from MA200, without an indication of a potential cross in the near term period.
The week ahead is an important one from the perspective of macro data. A bunch of currently closely watched data for the U.S. will be posted, including PCE, NFP, JOLTs, Unemployment rate in July. In addition to data, the FOMC meeting will be held on Wednesday, July 30th, where the Fed will decide on interest rates. Current market expectation is that the Fed will leave rates unchanged at this meeting. However, the final decision is with the Fed, in which case, any surprises might significantly move the currency pair toward one side. Also, in case of surprises with any of the above mentioned macro data the market reaction could bring higher volatility. Precaution in trading with eurusd in the week ahead is highly advisable. As per current charts, there is a high probability that the currency pair will move to the downside to test the 1,17 support level for one more time. Levels around the 1,1650 might also be shortly tested. In case that the market decides for a higher ground, there is some probability for the level of 1,18, as the next resistance level to be tested shortly.
Important news to watch during the week ahead are:
EUR: GDP Growth Rate for Q2 for both Germany and the Euro Zone, Unemployment rate in Germany in July, Inflation rate in Germany and the Euro Zone preliminary for July,
USD: JOLTs Job Openings in June, GDP Growth Rate for Q2, Pending Home Sales in June, the FOMC meeting and Fed interest rate decision will be held on Wednesday, July 30th, PCE Price Index for June will be posted on Thursday, July 31st, Non-farm Payrolls for July, Unemployment rate in July, ISM Manufacturing PMI in July, University of Michigan Consumer Sentiment final for July.
USDJPY Breakout and Potential RetraceHey Traders, in today's trading session we are monitoring USDJPY for a buying opportunity around 146.300 zone, USDJPY was trading in a downtrend and successfully managed to break it out. Currently is in a correction phase in which it is approaching the retrace area at 146.300 support and resistance area.
Trade safe, Joe.

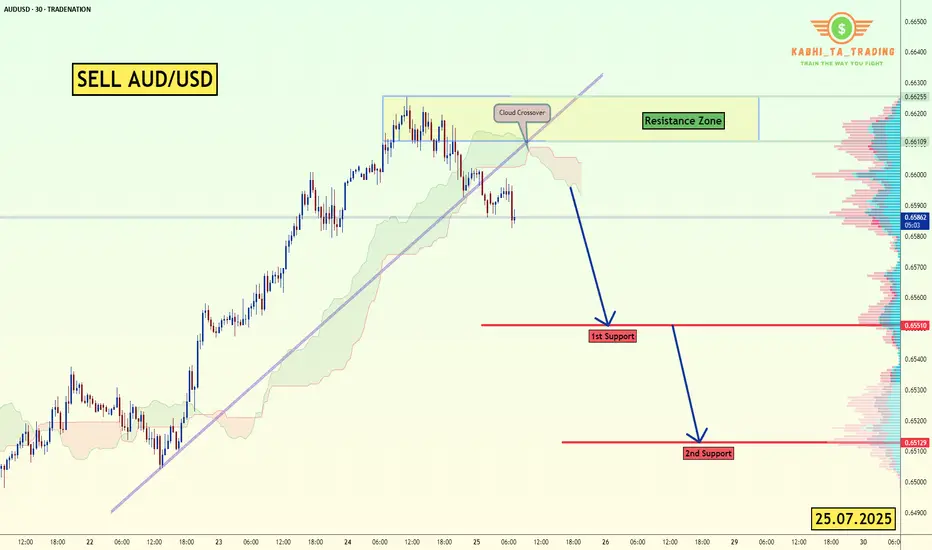
AUD/USD - Breakout (25.07.2025)The AUD/USD Pair on the M30 timeframe presents a Potential Selling Opportunity due to a recent Formation of a Trendline Pattern. This suggests a shift in momentum towards the downside in the coming hours.
Possible Short Trade:
Entry: Consider Entering A Short Position around Trendline Of The Pattern.
Target Levels:
1st Support – 0.6551
2nd Support – 0.6513
🎁 Please hit the like button and
🎁 Leave a comment to support for My Post !
Your likes and comments are incredibly motivating and will encourage me to share more analysis with you.
Best Regards, KABHI_TA_TRADING
Thank you.
Disclosure: I am part of Trade Nation's Influencer program and receive a monthly fee for using their TradingView charts in my analysis.
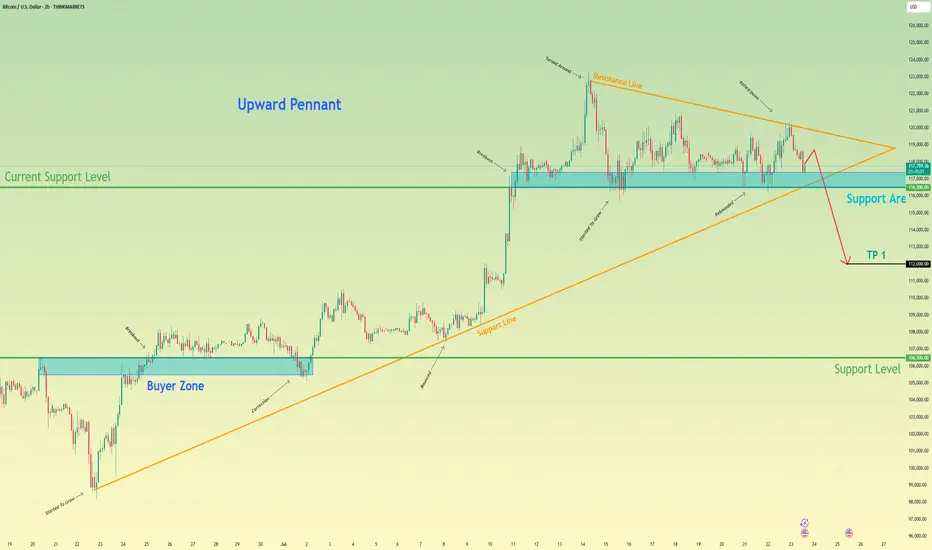
HelenP. I Bitcoin can fall to support zone and then start riseHi folks today I'm prepared for you Bitcoin analytics. If we look at the Bitcoin chart, the most prominent feature is the formation of a large bullish pennant following a strong upward impulse. This type of consolidation pattern typically suggests that the market is pausing to gather strength before continuing in the direction of the primary trend. The price is currently consolidating within the boundaries of this pennant, which are defined by an upper resistance line and a strong ascending trend line acting as the lower support. It is crucial to note the confluence of this ascending trend line with the horizontal support zone between 116000 and 116800, creating a powerful area of potential support. My analysis is based on the expectation that the price will make a final test of this key support confluence. I believe that a dip towards the 116000 - 116800 zone will be met with strong buying interest. A clear rejection from this area, confirming that buyers are defending both the horizontal and dynamic support, would be the critical condition validating a long position. A successful bounce should provide the catalyst for a bullish breakout from the top of the pennant, signaling the resumption of the uptrend. Therefore, I have set the primary goal for this subsequent upward move at the 122000 level, a logical target that would confirm the continuation of the bullish market structure. If you like my analytics you may support me with your like/comment ❤️
Disclaimer: As part of ThinkMarkets’ Influencer Program, I am sponsored to share and publish their charts in my analysis.

Bitcoin can start to decline and break support levelHello traders, I want share with you my opinion about Bitcoin. After completing a powerful upward impulse that originated from the buyer zone near 106500, the price action for BTC has transitioned into a corrective market phase. This consolidation has taken the form of an upward pennant, characterised by a narrowing trading range that suggests a significant directional move is forthcoming. Currently, the asset is undergoing a sequence of downward corrections within the pennant, exerting repeated pressure on the critical demand zone between 116500 and 117400. The importance of this zone is amplified by its confluence with the lower trend line of the formation itself. The primary working hypothesis is a bearish resolution, anticipating that persistent selling pressure will culminate in a decisive breakdown of this support. This event would act as a bearish breakout from the pennant, providing strong confirmation for the continuation of the downward impulsive momentum and shifting the local market structure. Therefore, the take-profit level is logically positioned at the 112000 mark. Please share this idea with your friends and click Boost 🚀
Disclaimer: As part of ThinkMarkets’ Influencer Program, I am sponsored to share and publish their charts in my analysis.
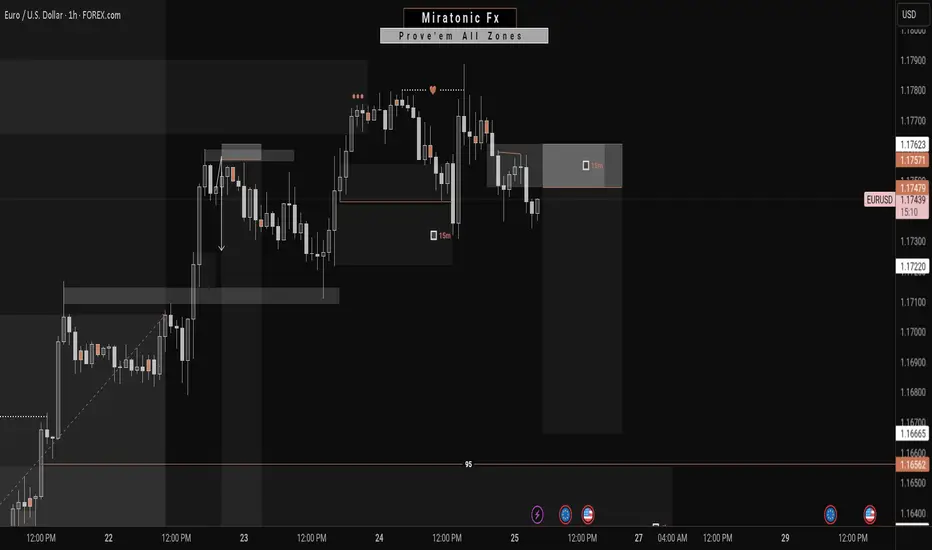
EURUSD | Time For A Pullback?The week kicked off with strong impulsive moves to the upside, leaving no room for deeper correction. Then slowly from Wednesday, we started to see a decline in strength in the bullish run.
Now, with price edging toward the next swing low for a possible bearish change of character, is this a good way to ride the stream to the downside?
Keep your A-game on as we watch price unfold, and trade reactively to price movement.
Do not forget to guard your capitals with risk management.
Good luck traders. 👍
Follow me for more and more of these analyses.
See you on the next one. 🫡
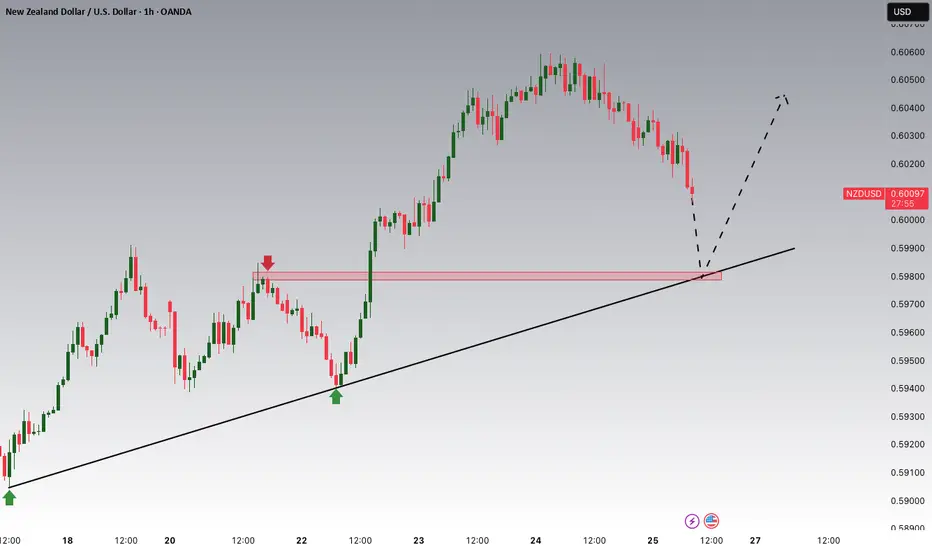
NZDUSD Potential UpsidesHey Traders, in today's trading session we are monitoring NZDUSD for a buying opportunity around 0.59800 zone, NZDUSD is trading in an uptrend and currently is in a correction phase in which it is approaching the trend at 0.59800 support and resistance area.
Trade safe, Joe.
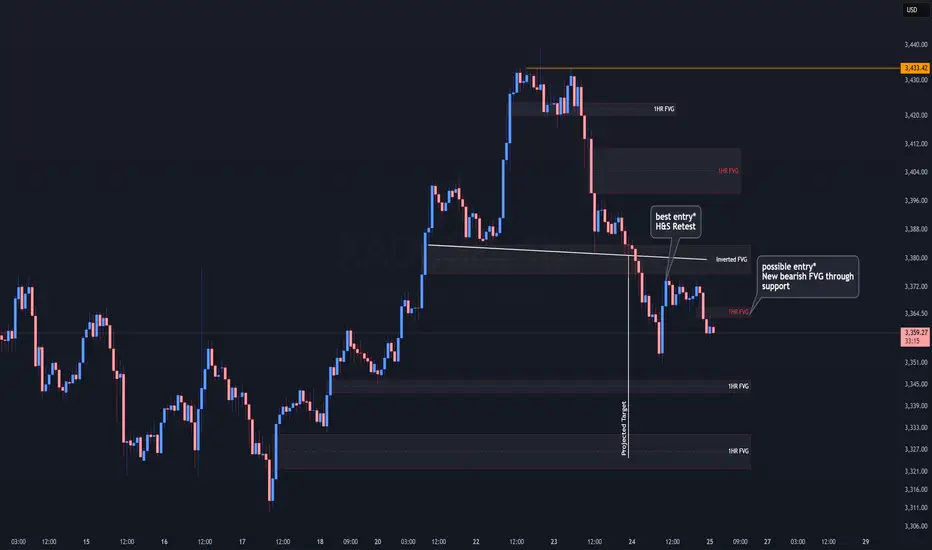
XAUUSD - 1hr | Head and ShouldersSimple Trading: Head and Shoulders Pattern
With the price topping out at 3440 , gold is now making a pullback to clear some LOWS. Watch 3375
If gold remains under 3375 , the price may continue to fall. If Gold rebounds above 3375 , we should see the price start to consolidate as buyers will try to take control.
**Keep in mind, the price has already made its way 50% to the target.
This entry is a higher risk**
Patterns Target: 3325
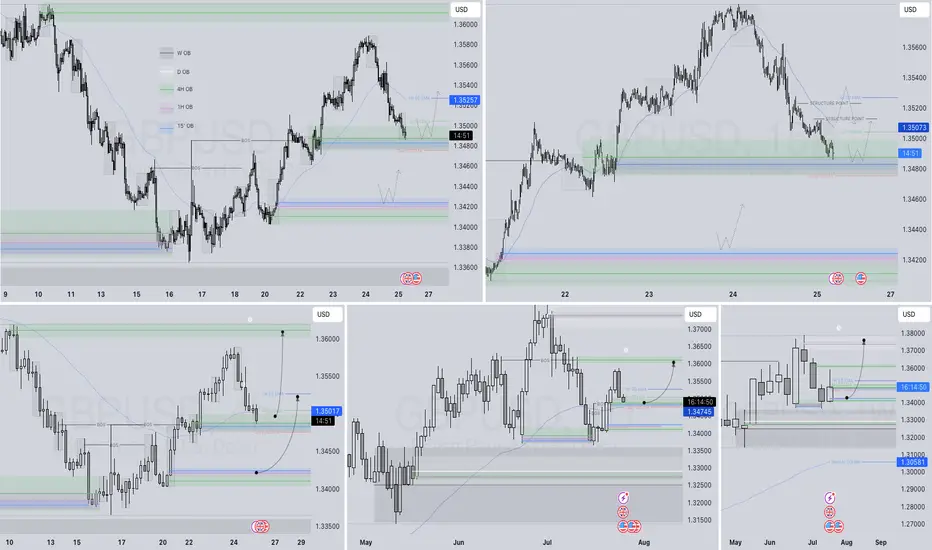
GBPUSD Q3 | D25 | W30 | Y25 FUN COUPON FRIDAYGBPUSD Q3 | D25 | W30 | Y25
Daily Forecast🔍📅
Here’s a short diagnosis of the current chart setup 🧠📈
Higher time frame order blocks have been identified — these are our patient points of interest 🎯🧭.
It’s crucial to wait for a confirmed break of structure 🧱✅ before forming a directional bias.
This keeps us disciplined and aligned with what price action is truly telling us.
📈 Risk Management Protocols
🔑 Core principles:
Max 1% risk per trade
Only execute at pre-identified levels
Use alerts, not emotion
Stick to your RR plan — minimum 1:2
🧠 You’re not paid for how many trades you take, you’re paid for how well you manage risk.
🧠 Weekly FRGNT Insight
"Trade what the market gives, not what your ego wants."
Stay mechanical. Stay focused. Let the probabilities work.
FRGNT
FX:GBPUSD
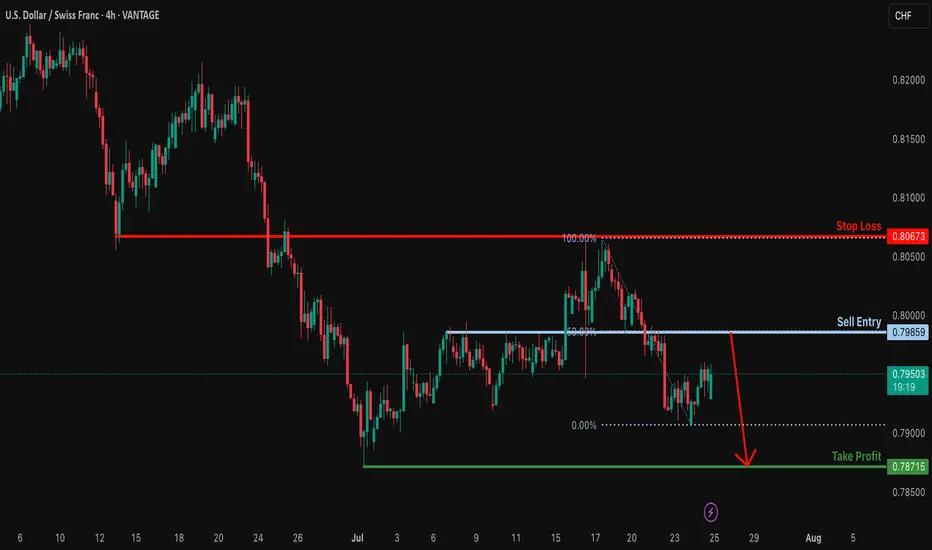
Bearish drop?USD/CHF is rising towards the resistance level which is an overlap resitance that lines up with the 50% FIbonacci retracement and could reverse from this level to our take profit.
Entry: 0.7985
Why we like it:
There is an overlap reistance that lines up with the 50% FIbonacci retraecment.
Stop loss: 0.8067
Why we like it:
There is an overlap resitance.
Take profit: 0.7871
Why we like it:
There is a swing low support.
Enjoying your TradingView experience? Review us!
Please be advised that the information presented on TradingView is provided to Vantage (‘Vantage Global Limited’, ‘we’) by a third-party provider (‘Everest Fortune Group’). Please be reminded that you are solely responsible for the trading decisions on your account. There is a very high degree of risk involved in trading. Any information and/or content is intended entirely for research, educational and informational purposes only and does not constitute investment or consultation advice or investment strategy. The information is not tailored to the investment needs of any specific person and therefore does not involve a consideration of any of the investment objectives, financial situation or needs of any viewer that may receive it. Kindly also note that past performance is not a reliable indicator of future results. Actual results may differ materially from those anticipated in forward-looking or past performance statements. We assume no liability as to the accuracy or completeness of any of the information and/or content provided herein and the Company cannot be held responsible for any omission, mistake nor for any loss or damage including without limitation to any loss of profit which may arise from reliance on any information supplied by Everest Fortune Group.
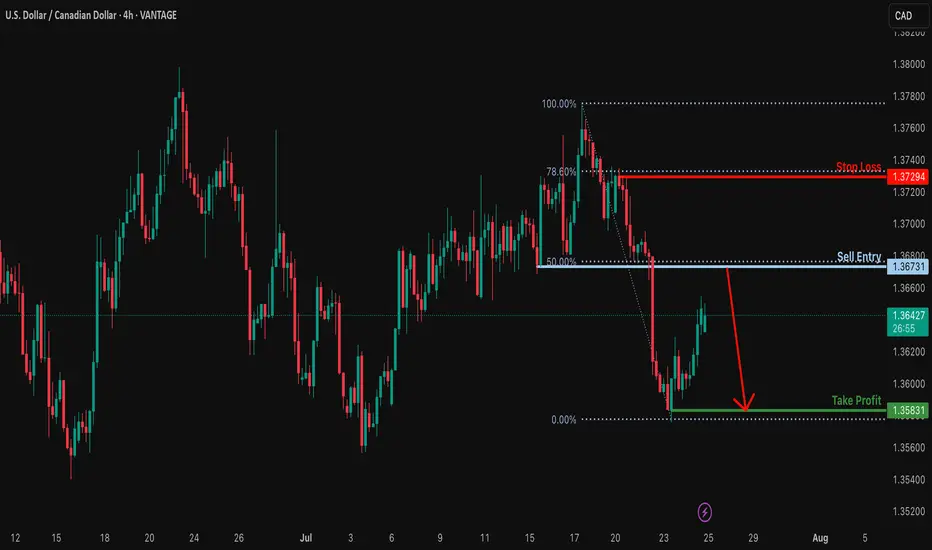
Heading into 50% Fibonacci resistance?USD/CAD is rising towards the resistance level, which serves as a pullback resistance that aligns with the 50% Fibonacci retracement and could reverse from this level to our take-profit target.
Entry: 1.3673
Why we like it:
There is a pullback resistance that lines up with the 50% Fibonacci retracement.
Stop loss: 1.3729
Why we like it:
There is a pullback resistance that lines up with the 78.6% Fibonacci retracement.
Take profit: 1.3583
Why we like it:
There is a swing low support.
Enjoying your TradingView experience? Review us!
Please be advised that the information presented on TradingView is provided to Vantage (‘Vantage Global Limited’, ‘we’) by a third-party provider (‘Everest Fortune Group’). Please be reminded that you are solely responsible for the trading decisions on your account. There is a very high degree of risk involved in trading. Any information and/or content is intended entirely for research, educational and informational purposes only and does not constitute investment or consultation advice or investment strategy. The information is not tailored to the investment needs of any specific person and therefore does not involve a consideration of any of the investment objectives, financial situation or needs of any viewer that may receive it. Kindly also note that past performance is not a reliable indicator of future results. Actual results may differ materially from those anticipated in forward-looking or past performance statements. We assume no liability as to the accuracy or completeness of any of the information and/or content provided herein and the Company cannot be held responsible for any omission, mistake nor for any loss or damage including without limitation to any loss of profit which may arise from reliance on any information supplied by Everest Fortune Group.
Bullish bounce for the Cable?The price is falling towards the suoprt level which is an overlap support that is slightly above the 61.8% Fibonacci retracement and could bounce from this level to our take profit.
Entry: 1.3468
Why we like it:
There is an overlap support that is slightly above the 61.8% Fibonacci retracement.
Stop loss: 1.3377
Why we like it:
There is a swing low support.
Take profit: 1.3577
Why we like it:
There is a pullback resistance.
Enjoying your TradingView experience? Review us!
Please be advised that the information presented on TradingView is provided to Vantage (‘Vantage Global Limited’, ‘we’) by a third-party provider (‘Everest Fortune Group’). Please be reminded that you are solely responsible for the trading decisions on your account. There is a very high degree of risk involved in trading. Any information and/or content is intended entirely for research, educational and informational purposes only and does not constitute investment or consultation advice or investment strategy. The information is not tailored to the investment needs of any specific person and therefore does not involve a consideration of any of the investment objectives, financial situation or needs of any viewer that may receive it. Kindly also note that past performance is not a reliable indicator of future results. Actual results may differ materially from those anticipated in forward-looking or past performance statements. We assume no liability as to the accuracy or completeness of any of the information and/or content provided herein and the Company cannot be held responsible for any omission, mistake nor for any loss or damage including without limitation to any loss of profit which may arise from reliance on any information supplied by Everest Fortune Group.

Bullish bounce off overlap support?EUR/USD is falling towards the support level, which is an overlap support that aligns with the 38.2% Fibonacci retracement and could bounce from this level to our take profit.
Entry: 1.1693
Why we like it:
There is an overlap support that lines up with the 38.2% Fibonacci retracement.
Stop loss: 1.1619
Why we like it:
There is a pullback support that is slightly above the 78.6% Fibonacci retracement.
Take profit: 1.1806
Why we like it:
There is a swing high resistance.
Enjoying your TradingView experience? Review us!
Please be advised that the information presented on TradingView is provided to Vantage (‘Vantage Global Limited’, ‘we’) by a third-party provider (‘Everest Fortune Group’). Please be reminded that you are solely responsible for the trading decisions on your account. There is a very high degree of risk involved in trading. Any information and/or content is intended entirely for research, educational and informational purposes only and does not constitute investment or consultation advice or investment strategy. The information is not tailored to the investment needs of any specific person and therefore does not involve a consideration of any of the investment objectives, financial situation or needs of any viewer that may receive it. Kindly also note that past performance is not a reliable indicator of future results. Actual results may differ materially from those anticipated in forward-looking or past performance statements. We assume no liability as to the accuracy or completeness of any of the information and/or content provided herein and the Company cannot be held responsible for any omission, mistake nor for any loss or damage including without limitation to any loss of profit which may arise from reliance on any information supplied by Everest Fortune Group.
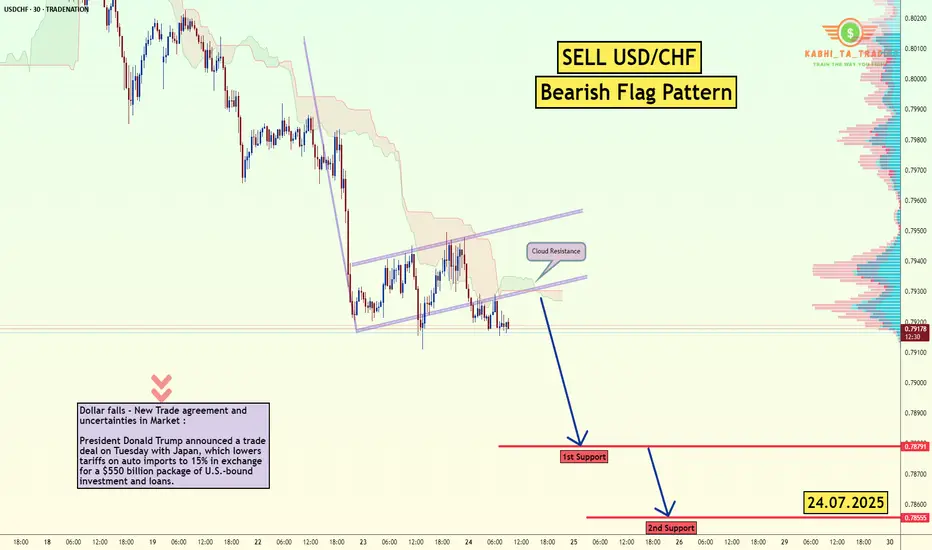
USD/CHF - Bearish Flag (24.07.2025)Fundamental Updates :
Dollar falls - New Trade agreement and uncertainties in Market :
President Donald Trump announced a trade deal on Tuesday with Japan, which lowers tariffs on auto imports to 15% in exchange for a $550 billion package of U.S.-bound investment and loans.
The USD/CHF Pair on the M30 timeframe presents a Potential Selling Opportunity due to a recent Formation of a Bearish Flag Pattern. This suggests a shift in momentum towards the downside in the coming hours.
Possible Short Trade:
Entry: Consider Entering A Short Position around Trendline Of The Pattern.
Target Levels:
1st Support – 0.7878
2nd Support – 0.7855
🎁 Please hit the like button and
🎁 Leave a comment to support for My Post !
Your likes and comments are incredibly motivating and will encourage me to share more analysis with you.
Best Regards, KABHI_TA_TRADING
Thank you.
Disclosure: I am part of Trade Nation's Influencer program and receive a monthly fee for using their TradingView charts in my analysis.
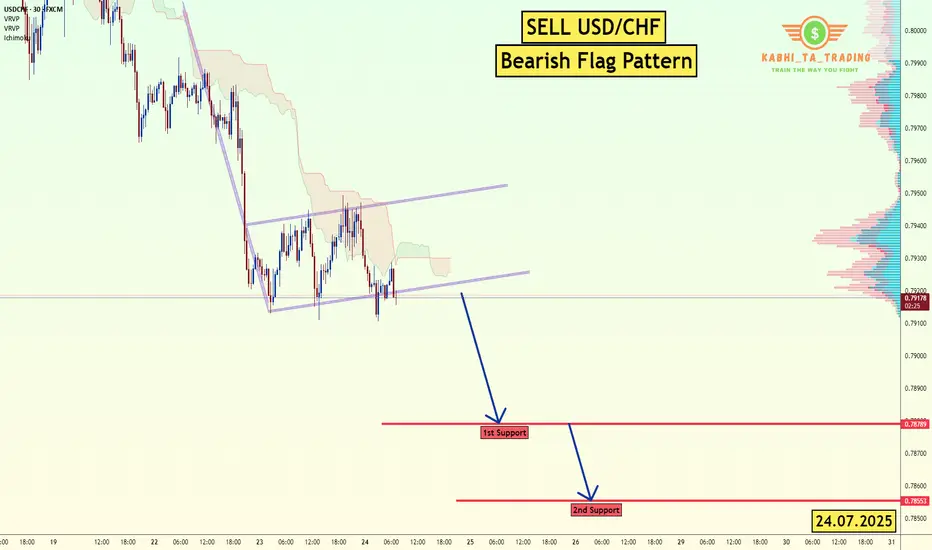
USD/CHF - Bearish Flag (24.07.2025)The USD/CHF Pair on the M30 timeframe presents a Potential Selling Opportunity due to a recent Formation of a Bearish Flag Pattern. This suggests a shift in momentum towards the downside in the coming hours.
Possible Short Trade:
Entry: Consider Entering A Short Position around Trendline Of The Pattern.
Target Levels:
1st Support – 0.7878
2nd Support – 0.7855
🎁 Please hit the like button and
🎁 Leave a comment to support for My Post !
Your likes and comments are incredibly motivating and will encourage me to share more analysis with you.
Best Regards, KABHI_TA_TRADING
Thank you.
Disclosure: I am part of Trade Nation's Influencer program and receive a monthly fee for using their TradingView charts in my analysis.
Is USDCAD staring at a new low for 2025?FX_IDC:USDCAD ready for a lower low? Let's see.
MARKETSCOM:USDCAD
Let us know what you think in the comments below.
Thank you.
75.2% of retail investor accounts lose money when trading CFDs with this provider. You should consider whether you understand how CFDs work and whether you can afford to take the high risk of losing your money. Past performance is not necessarily indicative of future results. The value of investments may fall as well as rise and the investor may not get back the amount initially invested. This content is not intended for nor applicable to residents of the UK. Cryptocurrency CFDs and spread bets are restricted in the UK for all retail clients.

NC HAMMER CRYPTO find meLooking at omg we see that it is practically dead, however we have seen this before it does a major pump when it gets over the 200EMA like we have seen with XCN… a little goes a long way with this one. ATH roughly $20 currently at $0.20, you do the math on risk vs reward.

Bearish drop?The Gold (XAU/USD) has reacted off the pivot and could potentially drop to the 1st support, which is a pullback support that is slightly below the 61.8% Fibonacci retracement.
Pivot: 3,385.61
1st Support: 3,355.52
1st Resistance: 3,401.17
Risk Warning:
Trading Forex and CFDs carries a high level of risk to your capital and you should only trade with money you can afford to lose. Trading Forex and CFDs may not be suitable for all investors, so please ensure that you fully understand the risks involved and seek independent advice if necessary.
Disclaimer:
The above opinions given constitute general market commentary, and do not constitute the opinion or advice of IC Markets or any form of personal or investment advice.
Any opinions, news, research, analyses, prices, other information, or links to third-party sites contained on this website are provided on an "as-is" basis, are intended only to be informative, is not an advice nor a recommendation, nor research, or a record of our trading prices, or an offer of, or solicitation for a transaction in any financial instrument and thus should not be treated as such. The information provided does not involve any specific investment objectives, financial situation and needs of any specific person who may receive it. Please be aware, that past performance is not a reliable indicator of future performance and/or results. Past Performance or Forward-looking scenarios based upon the reasonable beliefs of the third-party provider are not a guarantee of future performance. Actual results may differ materially from those anticipated in forward-looking or past performance statements. IC Markets makes no representation or warranty and assumes no liability as to the accuracy or completeness of the information provided, nor any loss arising from any investment based on a recommendation, forecast or any information supplied by any third-party.
