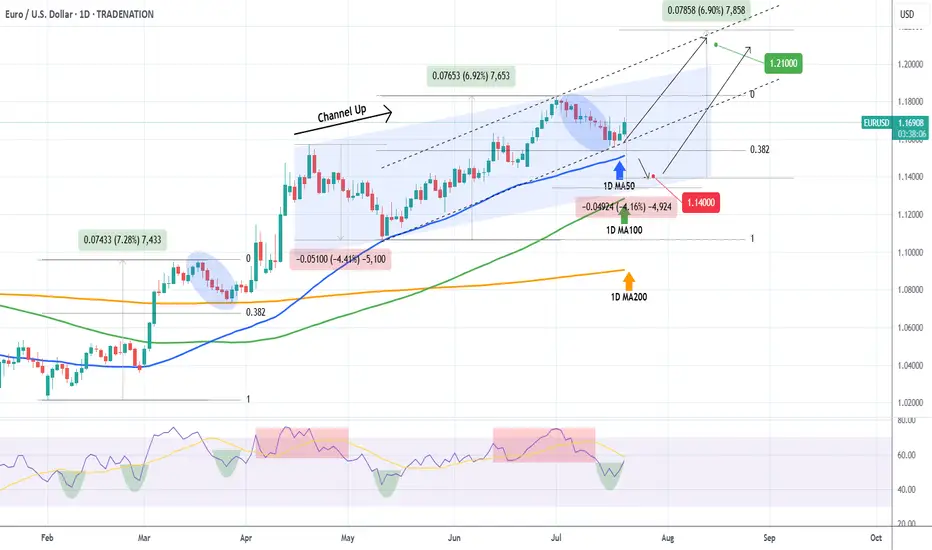
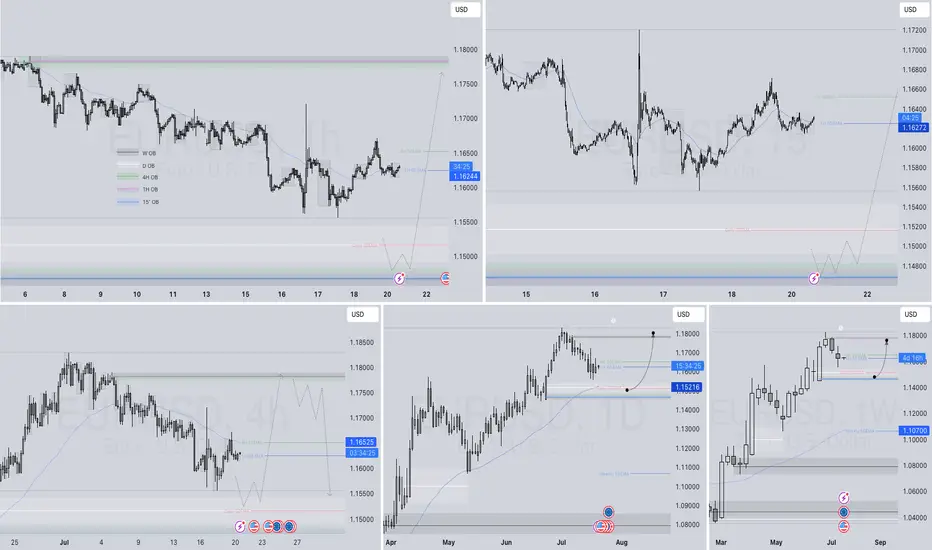
EURUSD Will the 1D MA50 hold?The EURUSD pair seems to be rebounding just before a 1D MA50 (blue trend-line) test, which is its short-term Support. At the same time it bounced off the 0.382 Fibonacci retracement level, which after a +6.92% rise, it resembles the March 27 rebound.
The 1D RSI is printing a standard bullish reversal setup, seen already 4 times since February, and a break above its MA will confirm it.
As long as the 1D MA50 holds, it may extend the uptrend to a new Channel Up (dashed), outside the blue one that may look for a new +6.92% rise. In that case our Target will be 1.21000.
If the 1D MA50 breaks, we will add one last buy at 1.14000, near the 1D MA100 (green trend-line).
-------------------------------------------------------------------------------
** Please LIKE 👍, FOLLOW ✅, SHARE 🙌 and COMMENT ✍ if you enjoy this idea! Also share your ideas and charts in the comments section below! This is best way to keep it relevant, support us, keep the content here free and allow the idea to reach as many people as possible. **
-------------------------------------------------------------------------------
Disclosure: I am part of Trade Nation's Influencer program and receive a monthly fee for using their TradingView charts in my analysis.
💸💸💸💸💸💸
👇 👇 👇 👇 👇 👇
USD
EURUSD Bullish ProjectionIt’s been a while since my last update here.
Here’s my projection and actual entry/entries on EURUSD, based on a sweep of the previous 1H swing low and mitigation of a Daily imbalance (Fair Value Gap).
We're anticipating a full Change of Character to mark the end of the ongoing Daily pullback.
HelenP. I Bitcoin will rebound from trend line and rise to $123KHi folks today I'm prepared for you Bitcoin analytics. If we look at the chart, we can see a very clear and long-term bullish structure. The entire uptrend is supported by a major ascending trend line that has acted as a reliable foundation for the price for a significant amount of time. Currently, the price is consolidating above this crucial trend line and is interacting with the key support zone between 117500 and 116700 points. I believe that the most probable scenario here is a brief corrective move downwards for the price to properly retest the main ascending trend line. This type of retest is often a healthy sign in a strong trend, as it allows for the confirmation of support and gathers momentum for the next leg up. A strong rebound from this trend line would serve as a powerful signal that the buyers are still in control. Therefore, once the price confirms its bounce from this dynamic support, the path should be clear for a continuation of the uptrend. For this reason, my primary goal for this trade idea is set at the 123000 points. If you like my analytics you may support me with your like/comment ❤️
Disclaimer: As part of ThinkMarkets’ Influencer Program, I am sponsored to share and publish their charts in my analysis.
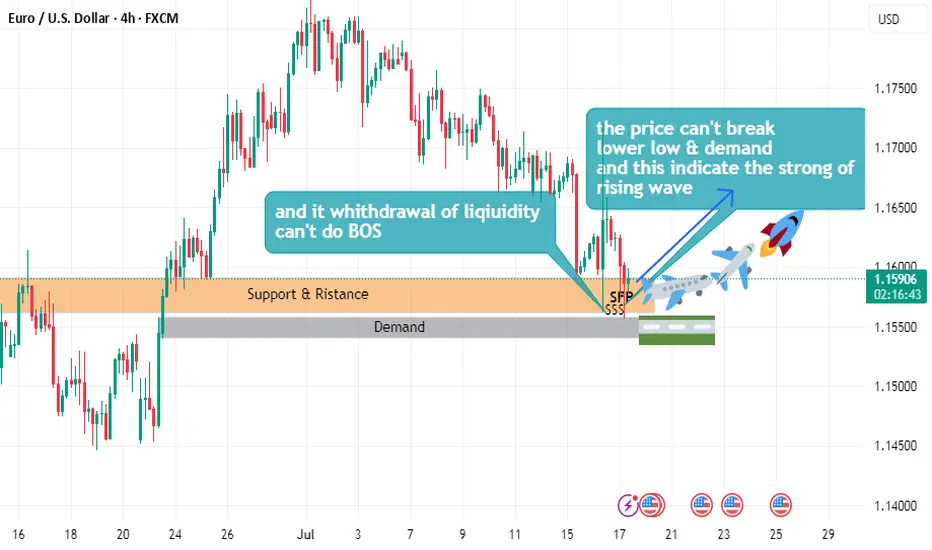
EURUSD buy plane Setuphello
the price can't break lower low
and can't demand
and this indicate the strong of uptrend wave
and it withdrawal of liquidity
and can't do beak of structure
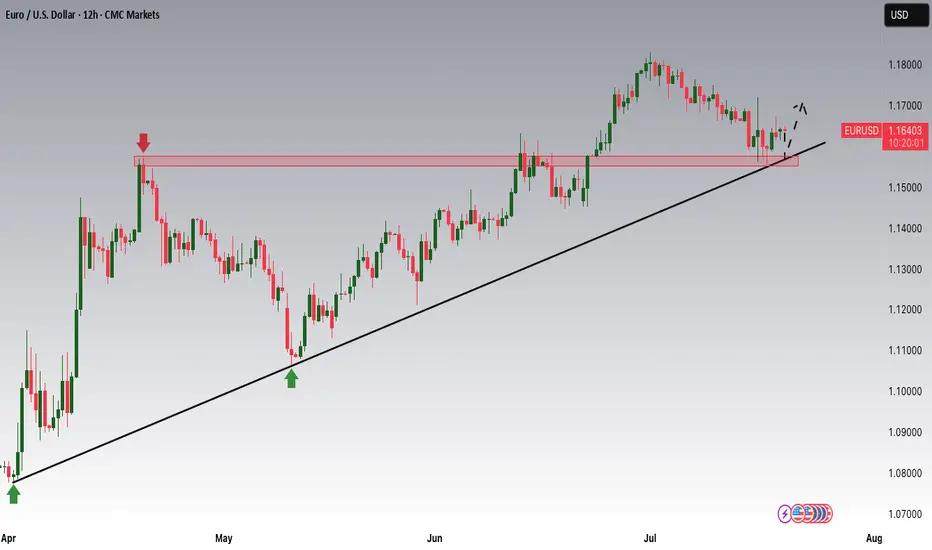
EURUSD is Nearing the Daily Uptrend! Hey Traders, in today's trading session we are monitoring EURUSD for a buying opportunity around 1.15800 zone, EURUSD is trading in an uptrend and currently is in a correction phase in which it is approaching the trend at 1.15800 support and resistance area.
Trade safe, Joe.
Bitcoin - Will Bitcoin reach its previous ATH?!Bitcoin is above the EMA50 and EMA200 on the four-hour timeframe and is in its ascending channel. Bitcoin’s current upward momentum has the potential to reach its previous ATH. If it corrects, we can look for Bitcoin buying positions from the specified support area, which is also at the intersection of the bottom of the ascending channel.
If this support is lost, the decline will continue to around $113,000, where we can again buy Bitcoin with a better risk-reward ratio.
It should be noted that there is a possibility of heavy fluctuations and shadows due to the movement of whales in the market, and capital management in the cryptocurrency market will be more important. If the downward trend continues, we can buy within the demand area.
Last week, the U.S. House of Representatives passed the CLARITY Act (Crypto-Asset National Regulatory Transparency for Investors and Consumers Act) with 294 votes in favor and 134 against, including support from 78 Democrats. The bill represents the first comprehensive legislative effort to regulate the cryptocurrency industry and is considered a major regulatory win for digital asset proponents.
Key features of the legislation include:
• Clearly defining the regulatory roles of agencies like the SEC and CFTC
• Establishing a new category for registered digital assets
• Facilitating broader integration of cryptocurrencies into traditional financial systems
Status in the Senate: Despite bipartisan approval in the House, the bill’s future in the Senate remains uncertain. Senators are still in the early stages of drafting their own version, and significant revisions are expected. Some Senate Democrats insist that the bill must explicitly address President Trump’s and his family’s cryptocurrency holdings.
The CLARITY Act is part of a broader Republican-led legislative initiative dubbed “Crypto Week,” which includes two additional major digital asset bills aimed at modernizing blockchain regulation and the broader digital finance ecosystem.
Meanwhile, Donald Trump is preparing to issue an executive order that would open up U.S. retirement markets to cryptocurrencies, gold, and private equity. This order would allow 401(k) fund managers to incorporate alternative assets into retirement portfolios.
The move follows the rollback of Biden-era restrictions and the recent passage of three crypto-related bills in the House. While major investment firms have welcomed the proposal, critics warn that alternative assets may expose retail investors to greater financial risks.
Also last week, Bitcoin reached a new all-time high, pushing its market capitalization to $2.43 trillion. It has now surpassed Amazon, Google, and even silver, becoming the fifth-largest asset globally by market value.
Looking ahead, one of the key events on the economic calendar is Federal Reserve Chair Jerome Powell’s upcoming speech at an official central bank-hosted conference on Tuesday. This event comes just before the release of the preliminary S&P Global Purchasing Managers’ Indexes (PMIs) on Thursday. Given Trump’s escalating verbal attacks on Powell, a central question is whether this political pressure has influenced the Fed Chair’s stance.
Trump has repeatedly urged Powell to lower interest rates. This week, reports emerged suggesting that the President had discussed with some Republicans the possibility of removing Powell from his position. However, Trump was quick to downplay the reports, stating that the likelihood of Powell being dismissed was “very low.”
In this context, if Powell uses his speech to reassert the Fed’s independence and calls for patience to assess the impact of tariffs more thoroughly, the U.S. dollar may continue its recent upward trend. Still, it’s too early to confirm a definitive bullish reversal for the dollar. While the global reserve currency has responded positively to headlines fueling tariff concerns, markets could mirror April’s behavior—when fears of recession led investors to sell the dollar instead of buying it—should those concerns intensify again.

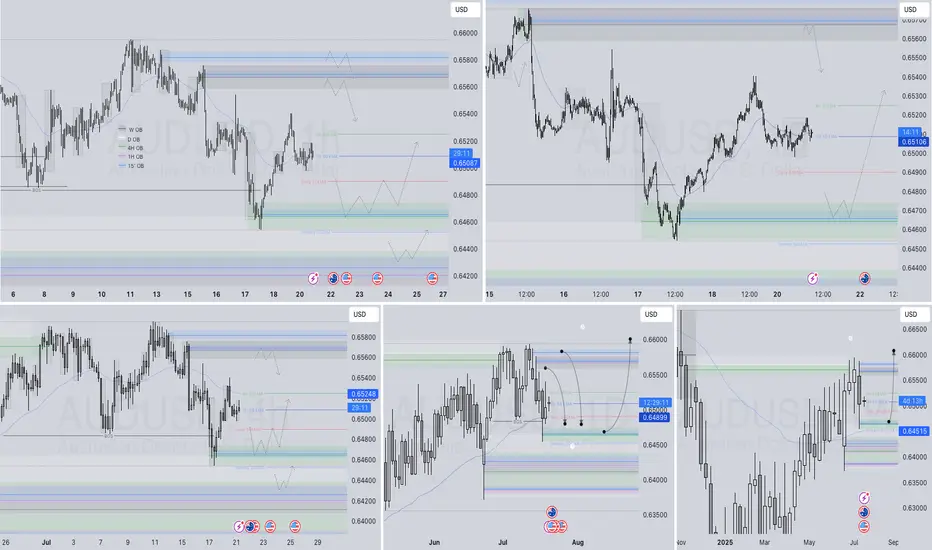
AUDUSD Q3 | D21 | W30 | Y25📊AUDUSD Q3 | D21 | W30 | Y25
Daily Forecast 🔍📅
Here’s a short diagnosis of the current chart setup 🧠📈
Higher time frame order blocks have been identified — these are our patient points of interest 🎯🧭.
It’s crucial to wait for a confirmed break of structure 🧱✅ before forming a directional bias.
This keeps us disciplined and aligned with what price action is truly telling us.
📈 Risk Management Protocols
🔑 Core principles:
Max 1% risk per trade
Only execute at pre-identified levels
Use alerts, not emotion
Stick to your RR plan — minimum 1:2
🧠 You’re not paid for how many trades you take, you’re paid for how well you manage risk.
🧠 Weekly FRGNT Insight
"Trade what the market gives, not what your ego wants."
Stay mechanical. Stay focused. Let the probabilities work.
FRGNT 📊
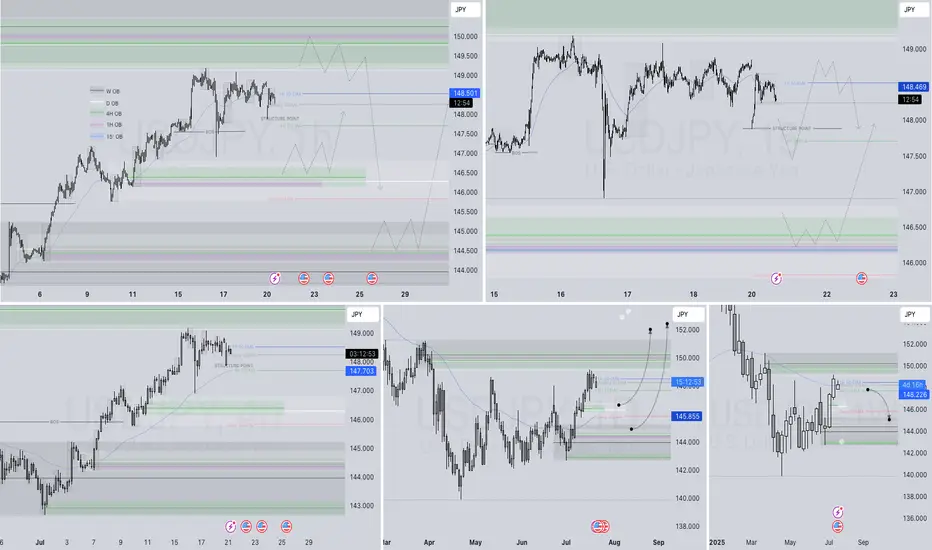
USDJPY Q3 | D21 | W30 | Y25 15' OB UPDATE 📊USDJPY Q3 | D21 | W30 | Y25 15' OB UPDATE
Daily Forecast 🔍📅
Here’s a short diagnosis of the current chart setup 🧠📈
Higher time frame order blocks have been identified — these are our patient points of interest 🎯🧭.
It’s crucial to wait for a confirmed break of structure 🧱✅ before forming a directional bias.
This keeps us disciplined and aligned with what price action is truly telling us.
📈 Risk Management Protocols
🔑 Core principles:
Max 1% risk per trade
Only execute at pre-identified levels
Use alerts, not emotion
Stick to your RR plan — minimum 1:2
🧠 You’re not paid for how many trades you take, you’re paid for how well you manage risk.
🧠 Weekly FRGNT Insight
"Trade what the market gives, not what your ego wants."
Stay mechanical. Stay focused. Let the probabilities work.
FRGNT 📊

USDJPY Q3 | D21 | W30 | Y25📊USDJPY Q3 | D21 | W30 | Y25
Daily Forecast 🔍📅
Here’s a short diagnosis of the current chart setup 🧠📈
Higher time frame order blocks have been identified — these are our patient points of interest 🎯🧭.
It’s crucial to wait for a confirmed break of structure 🧱✅ before forming a directional bias.
This keeps us disciplined and aligned with what price action is truly telling us.
📈 Risk Management Protocols
🔑 Core principles:
Max 1% risk per trade
Only execute at pre-identified levels
Use alerts, not emotion
Stick to your RR plan — minimum 1:2
🧠 You’re not paid for how many trades you take, you’re paid for how well you manage risk.
🧠 Weekly FRGNT Insight
"Trade what the market gives, not what your ego wants."
Stay mechanical. Stay focused. Let the probabilities work.
FRGNT 📊
EURUSD Q3 | D21 | W30 | Y25 📊EURUSD Q3 | D21 | W30 | Y25
Daily Forecast 🔍📅
Here’s a short diagnosis of the current chart setup 🧠📈
Higher time frame order blocks have been identified — these are our patient points of interest 🎯🧭.
It’s crucial to wait for a confirmed break of structure 🧱✅ before forming a directional bias.
This keeps us disciplined and aligned with what price action is truly telling us.
📈 Risk Management Protocols
🔑 Core principles:
Max 1% risk per trade
Only execute at pre-identified levels
Use alerts, not emotion
Stick to your RR plan — minimum 1:2
🧠 You’re not paid for how many trades you take, you’re paid for how well you manage risk.
🧠 Weekly FRGNT Insight
"Trade what the market gives, not what your ego wants."
Stay mechanical. Stay focused. Let the probabilities work.
FRGNT 📊
Bullish bounce?WTI Oil (XTI/USD) has bounced off the pivot and could rise to the 1st resistance that is slightly below the 50% Fibonacci retracement.
Pivot: 65.64
1st Support: 60.22
1st Resistance: 71.20
Risk Warning:
Trading Forex and CFDs carries a high level of risk to your capital and you should only trade with money you can afford to lose. Trading Forex and CFDs may not be suitable for all investors, so please ensure that you fully understand the risks involved and seek independent advice if necessary.
Disclaimer:
The above opinions given constitute general market commentary, and do not constitute the opinion or advice of IC Markets or any form of personal or investment advice.
Any opinions, news, research, analyses, prices, other information, or links to third-party sites contained on this website are provided on an "as-is" basis, are intended only to be informative, is not an advice nor a recommendation, nor research, or a record of our trading prices, or an offer of, or solicitation for a transaction in any financial instrument and thus should not be treated as such. The information provided does not involve any specific investment objectives, financial situation and needs of any specific person who may receive it. Please be aware, that past performance is not a reliable indicator of future performance and/or results. Past Performance or Forward-looking scenarios based upon the reasonable beliefs of the third-party provider are not a guarantee of future performance. Actual results may differ materially from those anticipated in forward-looking or past performance statements. IC Markets makes no representation or warranty and assumes no liability as to the accuracy or completeness of the information provided, nor any loss arising from any investment based on a recommendation, forecast or any information supplied by any third-party.
Heading into overlap resistance?USD/JPY is rising towards the pivot and could reverse to the 1st support which has been identified as a pullback support.
Pivot: 151.42
1st Support: 146.67
1st Resistance: 154.34
Risk Warning:
Trading Forex and CFDs carries a high level of risk to your capital and you should only trade with money you can afford to lose. Trading Forex and CFDs may not be suitable for all investors, so please ensure that you fully understand the risks involved and seek independent advice if necessary.
Disclaimer:
The above opinions given constitute general market commentary, and do not constitute the opinion or advice of IC Markets or any form of personal or investment advice.
Any opinions, news, research, analyses, prices, other information, or links to third-party sites contained on this website are provided on an "as-is" basis, are intended only to be informative, is not an advice nor a recommendation, nor research, or a record of our trading prices, or an offer of, or solicitation for a transaction in any financial instrument and thus should not be treated as such. The information provided does not involve any specific investment objectives, financial situation and needs of any specific person who may receive it. Please be aware, that past performance is not a reliable indicator of future performance and/or results. Past Performance or Forward-looking scenarios based upon the reasonable beliefs of the third-party provider are not a guarantee of future performance. Actual results may differ materially from those anticipated in forward-looking or past performance statements. IC Markets makes no representation or warranty and assumes no liability as to the accuracy or completeness of the information provided, nor any loss arising from any investment based on a recommendation, forecast or any information supplied by any third-party.

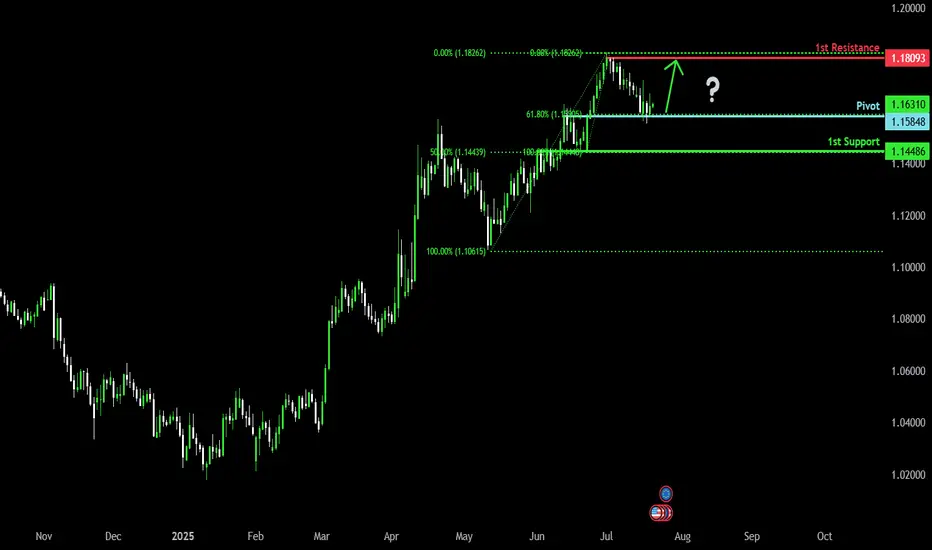
Bullish momentum to extend?The Fiber (EUR/USD) is reacting off the pivot which is a pullback support that aligns with the 61.8% Fibonacci retracement and could bounce to the 1st resistance.
Pivot: 1.1584
1st Support: 1.1448
1st Resistance: 1.1809
Risk Warning:
Trading Forex and CFDs carries a high level of risk to your capital and you should only trade with money you can afford to lose. Trading Forex and CFDs may not be suitable for all investors, so please ensure that you fully understand the risks involved and seek independent advice if necessary.
Disclaimer:
The above opinions given constitute general market commentary, and do not constitute the opinion or advice of IC Markets or any form of personal or investment advice.
Any opinions, news, research, analyses, prices, other information, or links to third-party sites contained on this website are provided on an "as-is" basis, are intended only to be informative, is not an advice nor a recommendation, nor research, or a record of our trading prices, or an offer of, or solicitation for a transaction in any financial instrument and thus should not be treated as such. The information provided does not involve any specific investment objectives, financial situation and needs of any specific person who may receive it. Please be aware, that past performance is not a reliable indicator of future performance and/or results. Past Performance or Forward-looking scenarios based upon the reasonable beliefs of the third-party provider are not a guarantee of future performance. Actual results may differ materially from those anticipated in forward-looking or past performance statements. IC Markets makes no representation or warranty and assumes no liability as to the accuracy or completeness of the information provided, nor any loss arising from any investment based on a recommendation, forecast or any information supplied by any third-party.
Bullish bounce?The Cable (GBP/USD) is falling towards the pivot and could bounce to the 1st resistance which is a pullback support.
Pivot: 1.3373
1st Support: 1.3116
1st Resistance: 1.3622
Risk Warning:
Trading Forex and CFDs carries a high level of risk to your capital and you should only trade with money you can afford to lose. Trading Forex and CFDs may not be suitable for all investors, so please ensure that you fully understand the risks involved and seek independent advice if necessary.
Disclaimer:
The above opinions given constitute general market commentary, and do not constitute the opinion or advice of IC Markets or any form of personal or investment advice.
Any opinions, news, research, analyses, prices, other information, or links to third-party sites contained on this website are provided on an "as-is" basis, are intended only to be informative, is not an advice nor a recommendation, nor research, or a record of our trading prices, or an offer of, or solicitation for a transaction in any financial instrument and thus should not be treated as such. The information provided does not involve any specific investment objectives, financial situation and needs of any specific person who may receive it. Please be aware, that past performance is not a reliable indicator of future performance and/or results. Past Performance or Forward-looking scenarios based upon the reasonable beliefs of the third-party provider are not a guarantee of future performance. Actual results may differ materially from those anticipated in forward-looking or past performance statements. IC Markets makes no representation or warranty and assumes no liability as to the accuracy or completeness of the information provided, nor any loss arising from any investment based on a recommendation, forecast or any information supplied by any third-party.

Bullish continuation?The Ethereum (ETH/USD) is falling towards the pivot and could bounce to the 1st resistance.
Pivot: 3,471.00
1st Support: 3,039.91
1st Resistance: 4,094.93
Risk Warning:
Trading Forex and CFDs carries a high level of risk to your capital and you should only trade with money you can afford to lose. Trading Forex and CFDs may not be suitable for all investors, so please ensure that you fully understand the risks involved and seek independent advice if necessary.
Disclaimer:
The above opinions given constitute general market commentary, and do not constitute the opinion or advice of IC Markets or any form of personal or investment advice.
Any opinions, news, research, analyses, prices, other information, or links to third-party sites contained on this website are provided on an "as-is" basis, are intended only to be informative, is not an advice nor a recommendation, nor research, or a record of our trading prices, or an offer of, or solicitation for a transaction in any financial instrument and thus should not be treated as such. The information provided does not involve any specific investment objectives, financial situation and needs of any specific person who may receive it. Please be aware, that past performance is not a reliable indicator of future performance and/or results. Past Performance or Forward-looking scenarios based upon the reasonable beliefs of the third-party provider are not a guarantee of future performance. Actual results may differ materially from those anticipated in forward-looking or past performance statements. IC Markets makes no representation or warranty and assumes no liability as to the accuracy or completeness of the information provided, nor any loss arising from any investment based on a recommendation, forecast or any information supplied by any third-party.

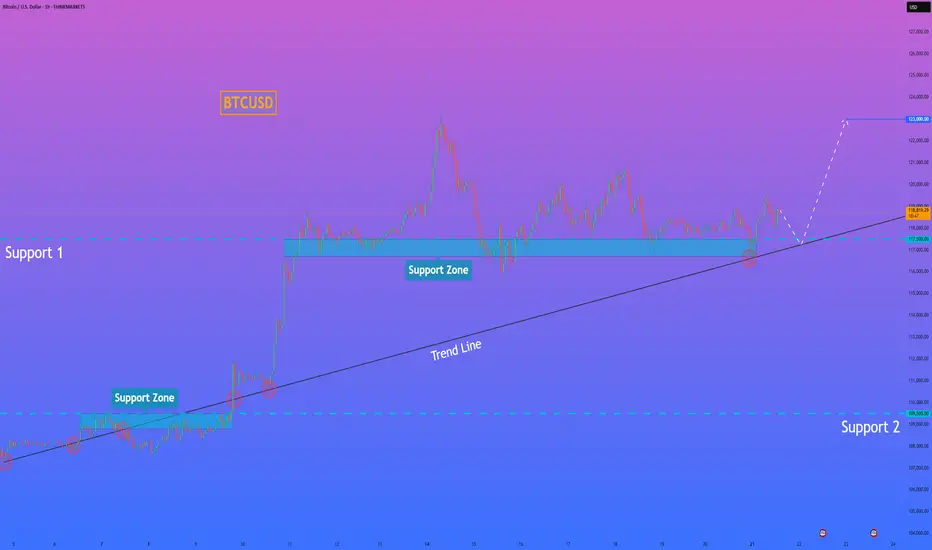
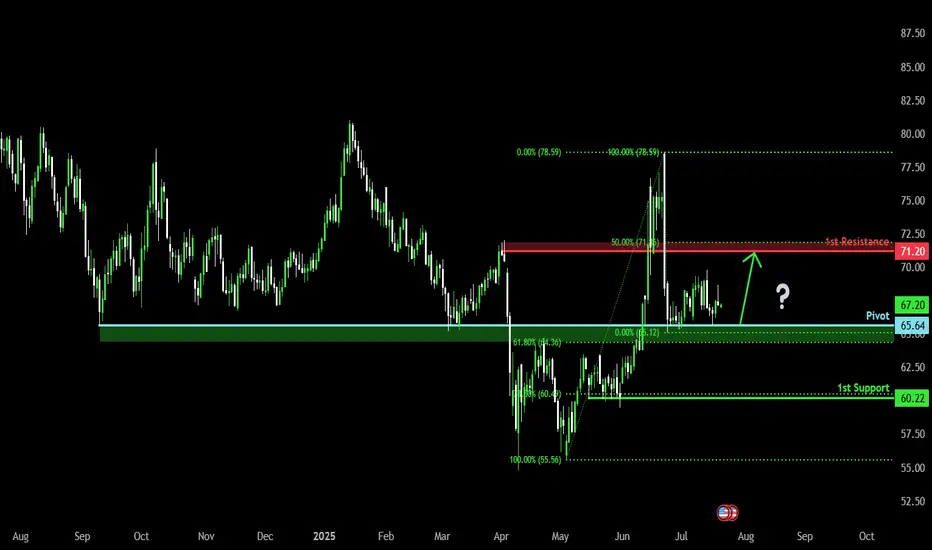
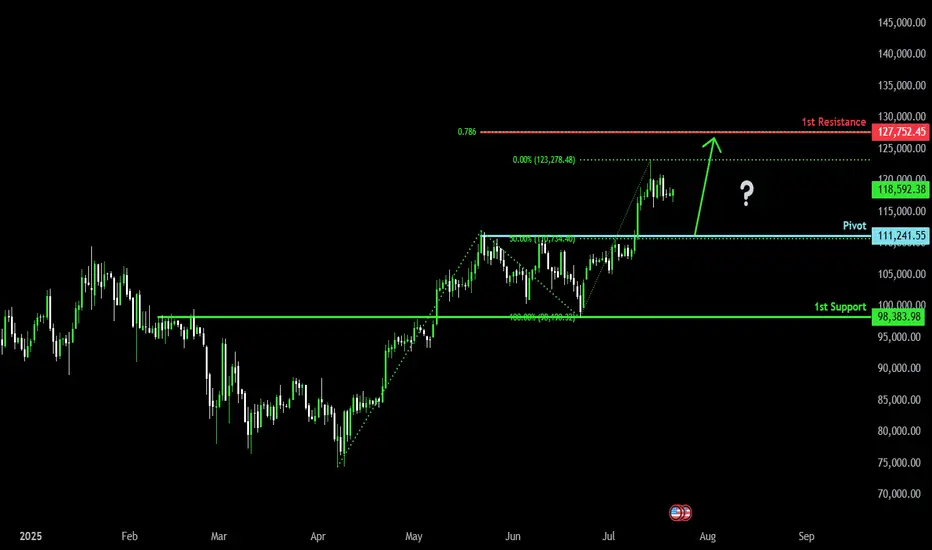
Bullish bounce?The Bitcoin (BTC/USD) is falling toward the pivot and could bounce to the 1st resistance.
Pivot: 111,241.55
1st Support: 98,383.98
1st Resistance: 127,752.45
Risk Warning:
Trading Forex and CFDs carries a high level of risk to your capital and you should only trade with money you can afford to lose. Trading Forex and CFDs may not be suitable for all investors, so please ensure that you fully understand the risks involved and seek independent advice if necessary.
Disclaimer:
The above opinions given constitute general market commentary, and do not constitute the opinion or advice of IC Markets or any form of personal or investment advice.
Any opinions, news, research, analyses, prices, other information, or links to third-party sites contained on this website are provided on an "as-is" basis, are intended only to be informative, is not an advice nor a recommendation, nor research, or a record of our trading prices, or an offer of, or solicitation for a transaction in any financial instrument and thus should not be treated as such. The information provided does not involve any specific investment objectives, financial situation and needs of any specific person who may receive it. Please be aware, that past performance is not a reliable indicator of future performance and/or results. Past Performance or Forward-looking scenarios based upon the reasonable beliefs of the third-party provider are not a guarantee of future performance. Actual results may differ materially from those anticipated in forward-looking or past performance statements. IC Markets makes no representation or warranty and assumes no liability as to the accuracy or completeness of the information provided, nor any loss arising from any investment based on a recommendation, forecast or any information supplied by any third-party.
Gold will make a Low for the Week before Pushing BullishOn my previous Update I mention that we should have support off this H4 Gap. My problem with it s it immediately reacted to it when the market opened back up. well before the killzone. So I feel like this is a fake out to go short for now. they will make a low for the week then we will see it set up for the bullish move.

Bullish bounce off pullback support?USD/CAD is falling towards the support level which is a pullback support that lines up with the 38.2% Fibonacci retracement and could bounce from this level to our take profit.
Entry: 1.3681
Why we like it:
There is a pullback support level that aligns with the 38.2% Fibonacci retracement.
Stop loss: 1.3645
Why we like it:
There is a pullback support that lines up with the 61.8% Fibonacci retracement.
Take profit: 1.3782
Why we like it:
There is a pullback resistance.
Enjoying your TradingView experience? Review us!
Please be advised that the information presented on TradingView is provided to Vantage (‘Vantage Global Limited’, ‘we’) by a third-party provider (‘Everest Fortune Group’). Please be reminded that you are solely responsible for the trading decisions on your account. There is a very high degree of risk involved in trading. Any information and/or content is intended entirely for research, educational and informational purposes only and does not constitute investment or consultation advice or investment strategy. The information is not tailored to the investment needs of any specific person and therefore does not involve a consideration of any of the investment objectives, financial situation or needs of any viewer that may receive it. Kindly also note that past performance is not a reliable indicator of future results. Actual results may differ materially from those anticipated in forward-looking or past performance statements. We assume no liability as to the accuracy or completeness of any of the information and/or content provided herein and the Company cannot be held responsible for any omission, mistake nor for any loss or damage including without limitation to any loss of profit which may arise from reliance on any information supplied by Everest Fortune Group.

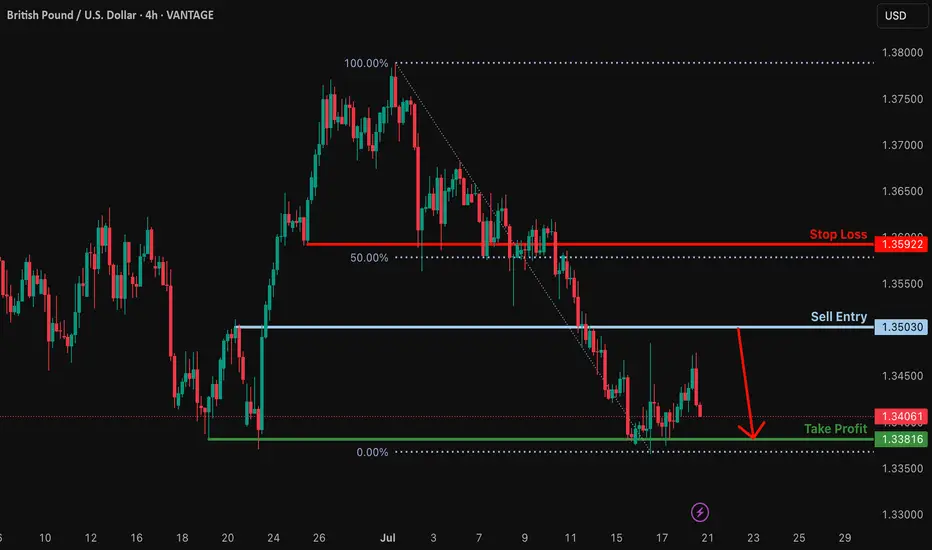
Bearish reversal off pullback resistance?GBP/USD is rising towards the resistance which is a pullback resistance and could drop from this level to our take profit.
Entry: 1.3603
Why we like it:
There is a pullback resistance level.
Stop loss: 1.3592
Why we like it:
There is a pullback resistance that is slightly above the 50% Fibonacci retracement.
Take profit: 1.3361
Why we like it:
There is a pullback support.
Enjoying your TradingView experience? Review us!
Please be advised that the information presented on TradingView is provided to Vantage (‘Vantage Global Limited’, ‘we’) by a third-party provider (‘Everest Fortune Group’). Please be reminded that you are solely responsible for the trading decisions on your account. There is a very high degree of risk involved in trading. Any information and/or content is intended entirely for research, educational and informational purposes only and does not constitute investment or consultation advice or investment strategy. The information is not tailored to the investment needs of any specific person and therefore does not involve a consideration of any of the investment objectives, financial situation or needs of any viewer that may receive it. Kindly also note that past performance is not a reliable indicator of future results. Actual results may differ materially from those anticipated in forward-looking or past performance statements. We assume no liability as to the accuracy or completeness of any of the information and/or content provided herein and the Company cannot be held responsible for any omission, mistake nor for any loss or damage including without limitation to any loss of profit which may arise from reliance on any information supplied by Everest Fortune Group.
XAUUSD 4Hour TF - July 20th, 2025XAUUSD 7/20/2025
XAUUSD 4 hour Long Idea
Monthly - Bullish
Weekly - Bullish
Daily - Bullish
4hour - Bullish
GOLD,GOLD,GOLD. This thing has been bullish on all timeframes and doesn’t really show any signs of stopping just yet.
We can see two scenarios for the week ahead so let’s dive in:
Bullish continuation - Price action on gold is breaking out of a descending triangle pattern. This is a strong bullish move but for us to consider trades we want the confirmation.
Look for a retest of our 61.8% fib level and mostly recently broken structure. If we can spot bullish conviction coming off this level we can then consider targeting higher resistance levels like 3.395.000. Our -27% fib level lines up with this zone as well.
Bearish Reversal - For us to consider Gold bearish again we would need to see something very convincing. If we did see a break below 3,320.000 with a confirmed lower high I would then consider short scenarios.
Look to target toward major support levels on the way down to 3,225.000, our next monthly support zone.

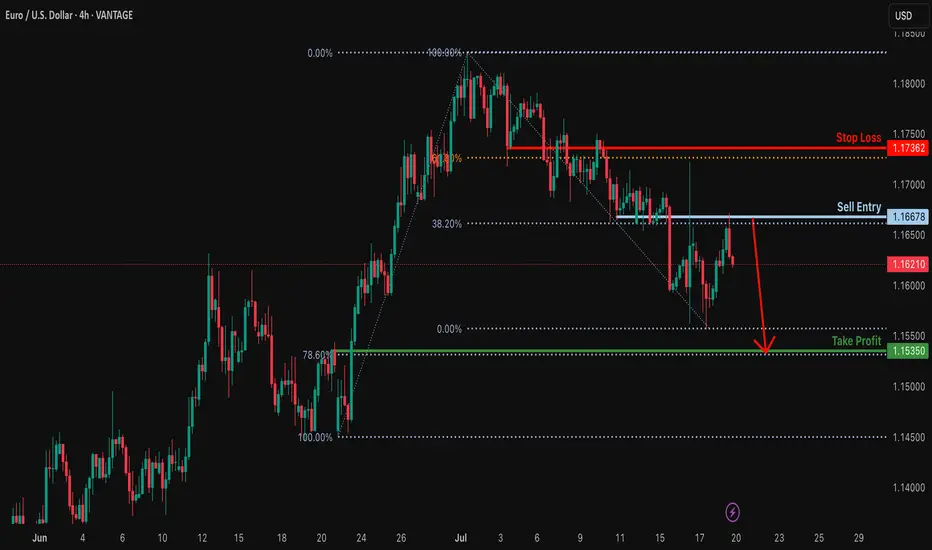
Bearish drop?EUR/USD has rejected off the resistance level which is a pullback resistance that lines up with the 38.2% Fibonacci retracement and could drop from this level to our tale profit.
Entry: 1.1667
Why we like it:
There is a pullback resistance that aligns with the 38.2% Fibonacci retracement.
Stop loss: 1.1736
Why we like it:
There is an overlap resistance that aligns with the 61.8% Fibonacci retracement.
Take profit: 1.1535
Why we like it:
There is a pullback support that lines up with the 78.6% Fibonacci retracement.
Enjoying your TradingView experience? Review us!
Please be advised that the information presented on TradingView is provided to Vantage (‘Vantage Global Limited’, ‘we’) by a third-party provider (‘Everest Fortune Group’). Please be reminded that you are solely responsible for the trading decisions on your account. There is a very high degree of risk involved in trading. Any information and/or content is intended entirely for research, educational and informational purposes only and does not constitute investment or consultation advice or investment strategy. The information is not tailored to the investment needs of any specific person and therefore does not involve a consideration of any of the investment objectives, financial situation or needs of any viewer that may receive it. Kindly also note that past performance is not a reliable indicator of future results. Actual results may differ materially from those anticipated in forward-looking or past performance statements. We assume no liability as to the accuracy or completeness of any of the information and/or content provided herein and the Company cannot be held responsible for any omission, mistake nor for any loss or damage including without limitation to any loss of profit which may arise from reliance on any information supplied by Everest Fortune Group.
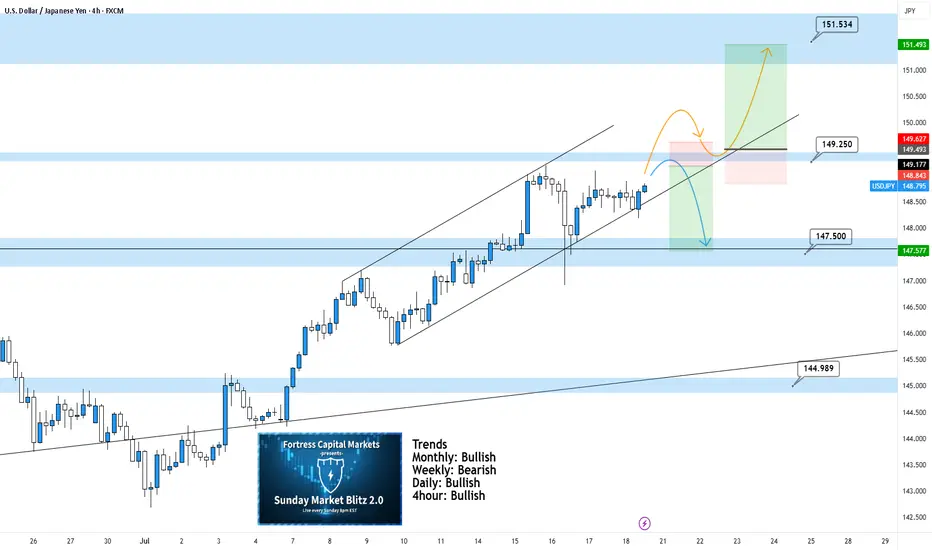
USDJPY 4Hour TF - July 20th,2025USDJPY 7/20/2025
USDJPY 4Hour Neutral Idea
Monthly - Bullish
Weekly - Bearish
Daily - Bullish
4Hour - Bullish
UJ is looking better than a couple weeks ago and at least we can spot some decent setups for the week ahead. These are NOT perfect setups but we have two scenarios that we are ready for if price action shows it is ready too. Here are the two scenarios we’re looking at for the week:
Bullish Continuation - We can see UJ in a nice 4hour channel but we are currently seeing a bit of flat price action. For us to consider UJ long setups again we would need to be convinced. Look for a break above our 149.250 zone with a confirmed higher low above. This would be enough to consider longs and target higher toward key levels of resistance.
Bearish Reversal - If price action continues to stall, this bearish setup will become more and more likely. Ideally, we want to see some strong rejection from our 149.250. If this happens look to target lower toward 147.500.
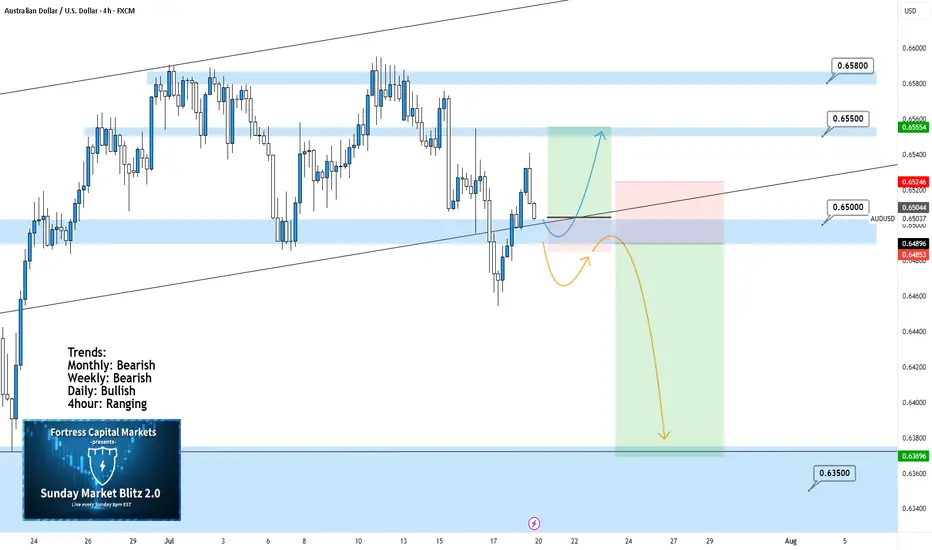
AUDUSD 4Hour TF - July 20th, 2025AUDUSD 7/20/2025
AUDUSD 4hour Neutral idea
Monthly - Bearish
Weekly - Bearish
Dailly - Bullish
4hour - Ranging
We’re looking at a fairly large range here on AU and although the higher timeframe suggests a potential bearish move, I am unsure until we have some clarity around 0.65000. Here are two scenarios that break down what could happen this week and how 0.65000 plays into it:
Range Continuation - Since late June we have seen price action establish this large range and stick to it (0.65800 Resistance & 0.65000 Support).
Currently, we can see price action attempting to break 0.65000 support but it has not done so yet. If we don’t break below 0.65000 early this week it is very likely we will see a rally into the top of the range.
Bearish Breakout - This is the setup we want to see play out this week as it presents a beauty of a trade.
For us to see AU as bearish on the 4hour we need to see a clear break below 0.65000 with a confirmed lower high below. If this happens look to target toward major support levels like 0.63500 area.