USDCAD - Big Picture and MomentumBig Picture and Momentum
USD/CAD is trading comfortably above the 50-day EMA (~1.3728) and above the 9-day EMA, indicating continued bullish momentum. The 14-day RSI is above the 50 level, confirming the positive market sentiment.
Key Support and Resistance
Resistance: 1.3770–1.3798 range is the current target, a break of which could open the way to the January high around 1.4016.
Support:
50-day EMA (~1.3728) is the first line of defense.
Next is the 9-day EMA (~1.3679).
A further weakening could see a decline to 1.3560, and a strong correction could see a decline to the February 2024 lows (~1.3420).
Market Behavior Scenarios
Bullish scenario: holding above EMA with RSI > 50 creates good conditions for a move up to 1.3770-1.3800, and then to 1.4016, with increasing momentum.
Bearish scenario: falling below EMA, especially below 1.3679, can lead to a deeper decline - to 1.3560 and then to 1.3420.
Recommendations for traders
Long position: can be considered for entry when holding above 1.3728, with a target of 1.3770-1.3800, and a stop just below the EMA.
Short position: justified when falling below 1.3728-1.3679, with a target of 1.3560, and a stop just above the EMA level.
Usdacdsignal

USD /CAD) bearish reversal analysis Read The captionSMC trading point update
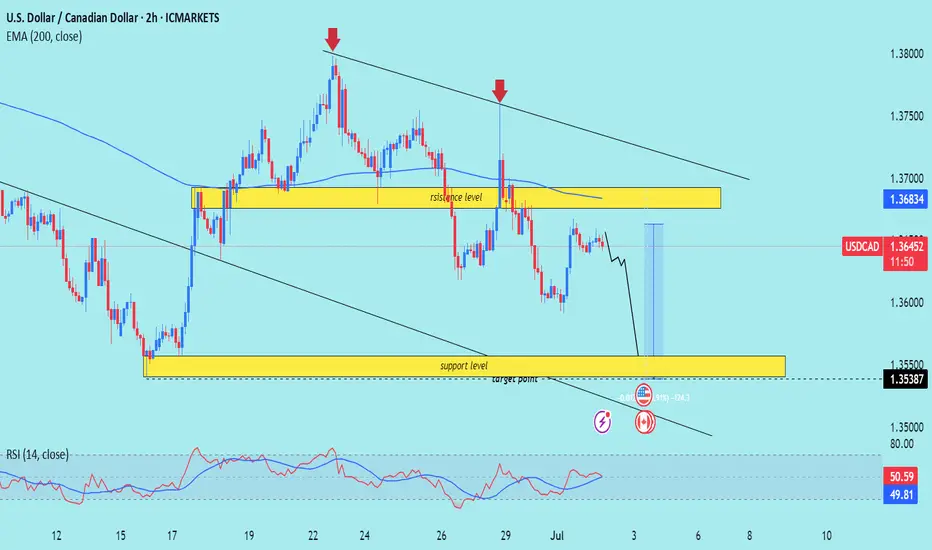
Technical analysis of USD/CAD pair on the 2-hour timeframe, suggesting that the price is likely to drop toward the support zone. Here's the detailed idea behind the analysis:
---
Chart Breakdown (2H – USD/CAD)
1. Resistance Zone (Yellow Box - Top):
Marked as a strong supply area where price has repeatedly been rejected (highlighted by red arrows).
Acts as a key zone where sellers are in control.
Also aligns with a descending trendline, reinforcing bearish pressure.
2. Support Zone (Yellow Box - Bottom):
This is the target point marked at 1.35387, which previously served as a demand zone.
The chart suggests this level as the next significant area where price might find buyers.
3. Trend Context:
Price is moving within a descending channel (black trendlines), confirming the overall downtrend.
The 200 EMA (1.36834) is acting as dynamic resistance, keeping price under pressure.
4. Projected Move (Blue Box):
Shows a potential drop of ~91 pips toward the support level.
A bearish wave is anticipated as per the black zigzag line on the chart.
5. RSI Indicator:
RSI is near neutral (49.02 and 49.70) — suggesting no overbought/oversold conditions, but confirming lack of bullish momentum.
RSI is aligned with price trending down.
Mr SMC Trading point
---
Summary:
Bias: Bearish
Entry Zone: Near current price or minor pullback (1.364–1.365)
Target: 1.35387 (support zone)
Invalidation: Break and close above resistance level / 200 EMA (~1.3685)
Trend: Downtrend within channel
---
Please support boost 🚀 analysis)
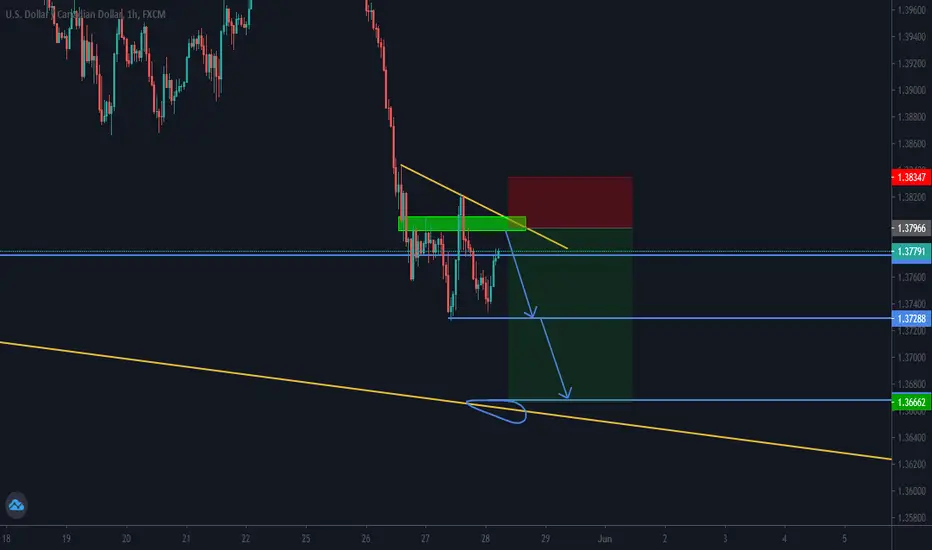
USD/CAD SELL NOW.......
Hello Traders, here is the full analysis for this pair,
let me know in the comment section below if you have any questions,
the entry will be taken only if all rules of the strategies will be
satisfied. I suggest you keep this pair on your watch list and see if
the rules of your strategy are satisfied.
Dear Traders,
If you like this idea, do not forget to support with a like and follow.
PLZ! LIKE COMMAND AND SUBSCRIBE
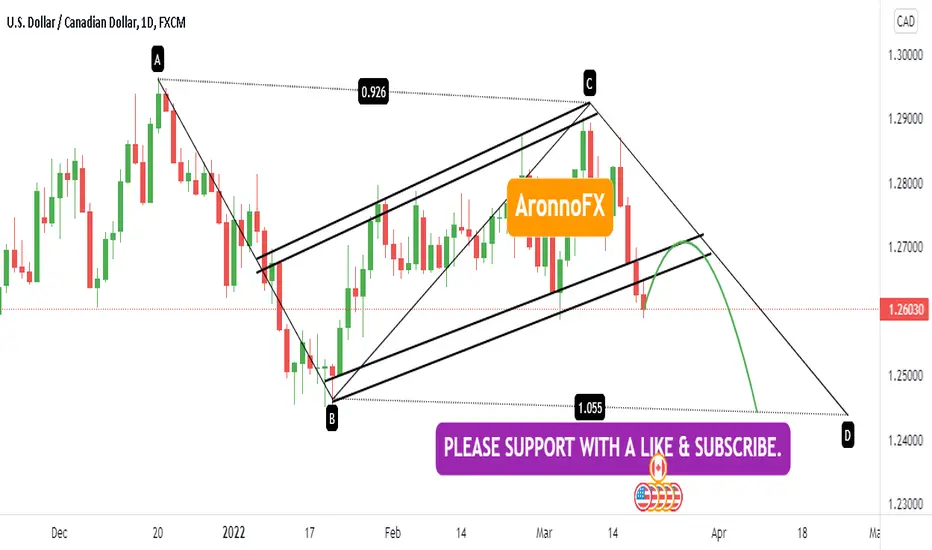
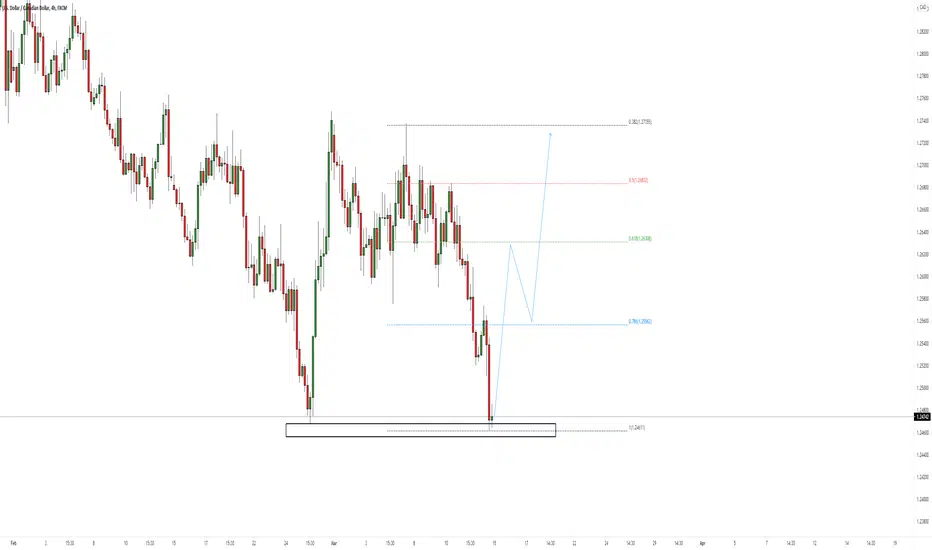
USD CAD BUY SETUPprice currently testing the daily support.. i see bullish divergence on the 4hrs am taking an early buy from this level... you can wait for price to break out the channel
USDCAD 4H ANALYSISHello Traders, here is the full analysis for this pair, let me know if you have any questions, the entry will be taken only if all rules of the strategies will be satisfied. I suggest you keep this pair on your watchlist and see if the rules of your strategy are satisfied